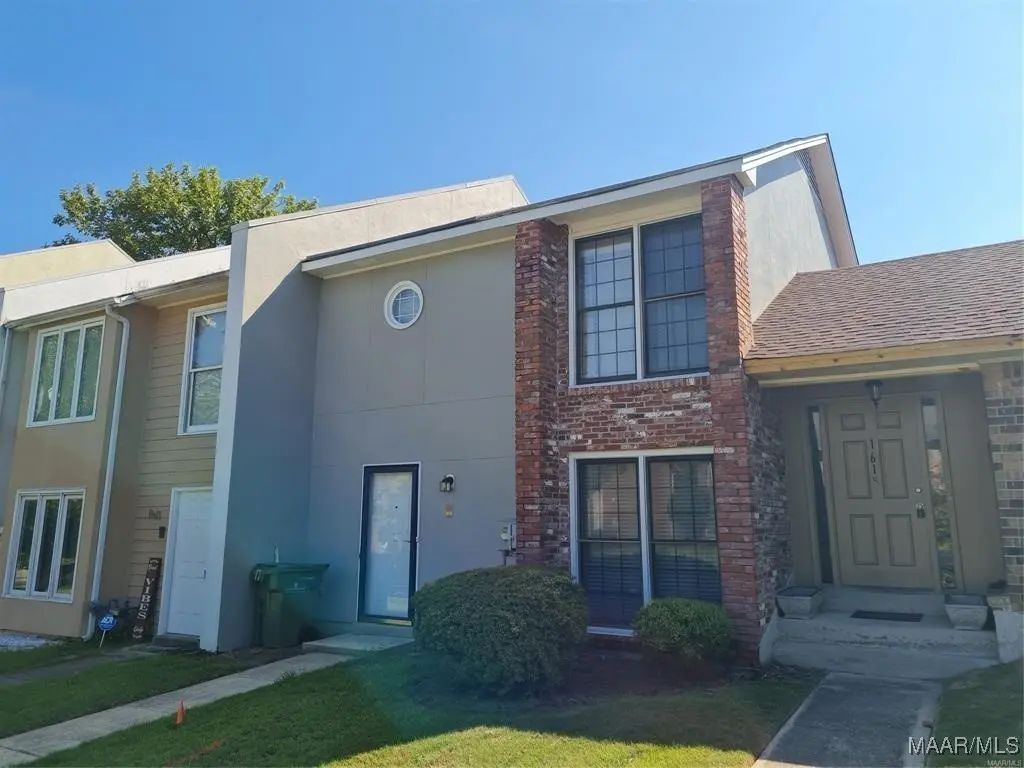
1613 Cobblestone Ct · Montgomery, AL
Flood risk 1/10 · Minimal
- FEMA flood zone
- X (unshaded)
- Chance of flooding over 30 yrs
- 0.0%
- Est. flood insurance / yr
- $507 – $1,088
Fire risk 3/10 · Minor
- Est. fire insurance / yr
- $916 – $1,700
Heat risk 8/10 · Major
- Hot days now (above 108°F)
- 7 days/yr
- Hot days in 30 yrs
- 20 days/yr
Wind risk 6/10 · Moderate
- Chance of severe wind over 30 yrs
- 77.0%
Air-quality risk 4/10 · Minor
- Unhealthy air days now
- 4 days/yr
- Unhealthy air days in 30 yrs
- 5 days/yr
Risk factors via First Street. Map © Google.
Why this score? — see what drove the B grade
The composite is a weighted blend of 9 inputs, each scored 0–100. Each bar is that input's sub-score; the figure is the points it added to the 100-point composite (weight × sub-score).
- Cash flow +29.6/30.0
- ARV discount +11.8/15.0
- DSCR +10.0/10.0
- 1% rule +7.9/10.0
- Rent growth +3.2/5.0
- Livability +3.2/5.0
- Condition / age +2.5/5.0
- Schools +1.7/10.0
- Appreciation +0.0/10.0
$118,400
🖨 Deal sheet (PDF) 📄 Offer letter ✓ Due diligence
Listing remarks MLS
Current tenant on section 8 at $1,184 until 10/30/26. Ask about interest rate buy down too! You're going to love the location of this house. Located seconds from Woodmere Park and the Shakespeare Festival makes it super easy to get to all restaurants and interstate. Recently painted & new LVP flooring has been installed upstairs (summer of 2025). Dishwasher, refrigerator and electric range remain. Located next door to the Alabama Shakespeare Festival, Montgomery Museum of Fine Arts, & the Blount Cultural Park, you'll have culture and nature at your doorstep. Plus, you're just minutes away from shopping and the Maxwell and Gunter Air Force Bases.
Key facts
- Blount cultural park
- Woodmere park
- New lvp flooring
Tags
Neighborhood map
What this means for you Summary
Snapshot
- This is a 3-bed/2.0-bath townhouse listed at $118k.
Deal economics
- At list price, monthly cash flow is $428 ($5k/yr) — positive.
- The deal already cash-flows at list — no discount required.
- Meets the 1% rule at list price ($2k rent vs $118k).
- Recommended offer: $104k (12.0% below list) — sets the bar for market timing.
- Cap rate 10.6% vs local median 6.0% in Montgomery — top-decile yield for the area; either an underpriced asset or a hidden risk that comps aren't pricing in. Stress-test before assuming the spread holds.
Location & tenants
- Location reads 65/100 on livability (#138 in AL) — a middle-class / working-renter tenant base. Strengths: cost of living A+, housing A+; Watch: employment D, crime F, amenities D-.
- Montgomery County (urban): math 9% / reading 31% proficiency, ranked #106 of 129 in AL (top 82%) — low school quality limits family demand, transient renter base, plan for 1-2y turnover; 70% free/reduced lunch — lower-income household profile, screen leases tightly.
- Zoned schools: Dozier Elementary School (math 2% / reading 17%, grade F, #568 of 627 statewide, top 94%, 394 students, 84% FRL); Carr Middle School (math 6% / reading 37%, grade F, #185 of 257 statewide, top 73%, 761 students, 58% FRL); Jefferson Davis High School (math 3% / reading 16%, grade F, #258 of 305 statewide, top 85%, 1,522 students, 83% FRL) — zoned schools at 75% FRL track the district average.
- Market conditions: Rents rising (+3.0%/yr); 409 active listings in the ZIP; 29 comparable units currently listed for rent nearby; rentals at typical pace (median 23d on market — plan ~3-4 weeks tenant-placement turnaround); 41% of comp listings sitting > 30 days — soft ceiling on asking rent; 460 units permitted in Montgomery County in 2024 (37 in 5+ unit buildings).
Forward outlook
- Local home prices are declining (-3.0%/yr); year-one equity from $819 of loan paydown is wiped out by about $4k of value loss. Plan a longer hold.
- Montgomery County population projected to shrink 8% by 2050 — rents likely to lag national; underwrite the cash flow, not the appreciation.
- At projected returns (-3.0% appreciation + 3.0% rent growth), your $33k cash investment doubles in ~8 years — after that, you're playing with house money.
Negotiation context
- It's been on market 127 days — a 12% lower offer ($104k) is reasonable based on typical stale-listing flexibility.
- 8 sale attempts since 3y ago with the ask held roughly flat each time — persistent listings suggest the price (not the market) is what's stuck; bring a comps-based counter.
Risks & watch-outs
- Climate carrying-cost: major wind risk, 77% chance of damaging wind over 30y; extreme-heat days projected 7→20/yr by 2055 (HVAC capex compounding) — expect insurance premiums to compound above CPI over the hold.
Questions for the listing agent
- It's been on market 127 days. Have you received any prior offers? Is the seller open to a 12% concession, seller financing, or rate buy-down credit?
- Built in 1979 — when were the roof, HVAC, electrical panel, plumbing, and water heater last replaced?
- Why hasn't it sold? Are there any deal-killer items the seller is aware of (foundation, flood, title, zoning, code violations)?
- Is there a deadline driving the sale (1031 exchange, divorce, estate, relocation)? That informs how much negotiation room exists.
- Crime grade is F in this area — have there been break-ins, vandalism, or insurance claims at this property in the last 3 years? What carrier currently insures it and at what premium?
- What's the average days-on-market for RENTAL listings here right now (not sales)? A rising rental-DOM trend means longer vacancies and softer asking-rent achievability than the comps imply.
- What's the recent tenant-quality profile in this submarket — average credit score on applications, eviction rate, late-payment / NSF rate, and stable-employment percentage? A property-management company in the area should have these aggregated.
- How much new for-sale + rental construction is in the pipeline within 1–3 miles? Heavy new supply typically softens prices + rents 12–24 months out; constrained supply supports both.
Investment metrics
- 1% rule
- 1.29% ✓
- Cap rate
- 10.63%
- Cash-on-cash
- 15.49%
- DSCR
- 1.69
- GRM
- 6.5
CMA / ARV
- ARV (median comp)
- $130,858
- List price
- $118,400
- Delta
- -9.52%
- Verdict
- FAIR
- Comps
- 20 within 1.0 mi
Show comp detail 8 sales within ~0.75 mi
| Address | Dist | Beds/Ba | Sqft | Sold | Price | $/sf | Match |
|---|---|---|---|---|---|---|---|
| 1614 Sandstone Ct | 0.10mi | 3/2.0 | 1,608 (+1%) | 3mo | $135,000 | $84 | 91 |
| 1600 Cobblestone Ct | 0.04mi | 3/2.5 | 1,638 (+3%) | 1mo | $85,000 | $52 | 91 |
| 1619 Cobblestone Ct | 0.01mi | 3/2.0 | 1,596 (0%) | 18mo | $133,000 | $83 | 84 |
| 1629 Cobblestone Ct | 0.05mi | 3/2.5 | 1,680 (+5%) | 4mo | $130,000 | $77 | 84 |
| 1635 Cobblestone Ct | 0.05mi | 3/2.5 | 1,560 (-2%) | 19mo | $120,000 | $77 | 76 |
| 1624 Sandstone Ct | 0.10mi | 3/2.5 | 1,409 (-12%) | 12mo | $132,900 | $94 | 63 |
| 1604 Cobblestone Ct | 0.04mi | 2/2.5 (-1) | 1,380 (-14%) | 10mo | $120,000 | $87 | 60 |
| 1596 Cobblestone Ct | 0.05mi | 2/2.5 (-1) | 1,364 (-14%) | 17mo | $70,000 | $51 | 52 |
Match score weights: distance 35% · size 25% · config 20% · recency 20%. Top-matched comps best support the ARV.
Projected returns pro-forma
-3.0% appreciation · 2.99% rent growth · sell at horizon
- IRR
- 6.2%
- Equity multiple
- 1.24×
- Total profit
- $8,055
- Equity at exit
- $17,654
- IRR
- 15.6%
- Equity multiple
- 2.27×
- Total profit
- $42,046
- Equity at exit
- $10,237
Cash invested: $33,152 (down + closing). Projections, not guarantees.
Landlord ↔ Tenant lean methodology
- Overall (STATE)
- 90 Strongly Landlord-Friendly
- State Alabama
- 90 Strongly Landlord-Friendly · R+15
- County
- — inherits STATE
- City
- — inherits STATE
ZIP-level market 36117
- Home prices YoY
- -20.0%
- Rents YoY
- 3.0%
- Active inventory
- 409
- Price-to-rent
- 6.5×
Monthly cashflow live
- Estimated rent
- $1,528 high interval (Pro) →
- Mortgage (P&I)
- −$621
- Tax from tax record
- −$109 /mo · $1,310/yr
- Insurance
- −$49
- HOA
- −$0
- Vacancy / Maint / Mgmt
- −$321
- Net cashflow
- $428
Break-even live
Sensitivity live
| Price | -10% $495 | -5% $461 | +0% $428 | +5% $394 | +10% $361 |
|---|---|---|---|---|---|
| Rent | -10% $307 | -5% $368 | +0% $428 | +5% $488 | +10% $549 |
| Rate | -1.0pp $488 | -0.5pp $458 | base $428 | +0.5pp $397 | +1.0pp $366 |
UW: 25.0% down · 7.5% · 30yr · 1.5% tax · 5.0% vac · 8.0% maint · 8.0% mgmt
Financing live
Cash to close
- Down payment
- $29,600
- Closing costs
- $3,552
- Reserves months
- —
- Total cash needed
- —
Loan-product check · same deal, 3 products live
Conventional
25% down · 7.5% · 30yr
- Down + closing
- —
- Monthly P&I
- —
- Monthly cashflow
- —
- DSCR
- —
- Eligible?
- —
Personal DTI + credit; lowest rate.
DSCR
20% down · 8.5% · 30yr
- Down + closing
- —
- Monthly P&I
- —
- Monthly cashflow
- —
- DSCR
- —
- Eligible?
- —
No personal income docs; deal must DSCR.
Hard money
10% down · 12.0% · 12mo
- Down + closing
- —
- Monthly P&I
- —
- Monthly cashflow
- —
- DSCR
- —
- Eligible?
- —
Short-term bridge; refi at stabilization.
Rent comps 29 comps
| Address | Beds | Baths | Sqft | Rent | $/sqft | DOM | Units | Dist |
|---|---|---|---|---|---|---|---|---|
| 1610 Limestone Ct Montgomery, AL | 3.0 | 2.5 | 1218 | $1,300 | $1.07 | 22d | 1 | 0.06mi |
| 1612 Woodmere Loop Montgomery, AL | 3.0 | 1.5 | 1425 | $1,775 | $1.25 | 45d | 1 | 0.13mi |
| 2000 London Town Ln Montgomery, AL | 1.0–3.0 | 1.0–2.0 | 950 | $1,159 | $1.22 | 15d | 11 | 0.14mi |
| 1615 Woodmere Loop Montgomery, AL | 3.0 | 2.0 | 1212 | $1,250 | $1.03 | 45d | 1 | 0.17mi |
| 6025 Oldcastle Pl Montgomery, AL | 3.0 | 2.0 | 1350 | $1,775 | $1.31 | 45d | 1 | 0.22mi |
| 1421 Stonehenge Rd Montgomery, AL | 1.0–3.0 | 1.0–1.5 | 895 | $1,199 | $1.34 | 45d | 1 | 0.25mi |
| 5600 Carmichael Rd Montgomery, AL | 2.0 | 1.0–2.0 | 722 | $1,153 | $1.60 | 45d | 1 | 0.41mi |
| 1944 Woodrun Dr Montgomery, AL | 3.0 | 2.0 | 1689 | $1,595 | $0.94 | 15d | 1 | 0.44mi |
| 6225 Whitewater Ct Montgomery, AL | 3.0 | 2.0 | 1581 | $1,600 | $1.01 | 22d | 1 | 0.51mi |
| 1857 Still Oaks Dr Montgomery, AL | 4.0 | 2.0 | 1791 | $1,850 | $1.03 | 22d | 1 | 0.52mi |
| 2495 Meadow Ridge Ln Montgomery, AL | 1.0–3.0 | 1.0–2.0 | 1205 | $1,199 | $1.00 | 15d | 14 | 0.56mi |
| 6037 Monticello Dr Montgomery, AL | 1.0–2.0 | 1.0–2.0 | 974 | $1,025 | $1.05 | 15d | 3 | 0.91mi |
| 2000 Central Pkwy Montgomery, AL | 1.0–3.0 | 1.0–2.0 | 1133 | $2,135 | $1.88 | 15d | 14 | 1.04mi |
| 2014 Rexford Rd Montgomery, AL | 3.0 | 2.0 | 1596 | $1,150 | $0.72 | 45d | 1 | 1.05mi |
| 2060 Rexford Rd Montgomery, AL | 3.0 | 2.5 | 1566 | $925 | $0.59 | 22d | 1 | 1.14mi |
| 5701 E Shirley Ln Montgomery, AL | 1.0–2.0 | 1.0 | 975 | $850 | $0.87 | 15d | 7 | 1.15mi |
| 2066 Rexford Rd Montgomery, AL | 3.0 | 2.5 | 1632 | $1,250 | $0.77 | 22d | 1 | 1.16mi |
| 5720 Worchester Dr Montgomery, AL | 2.0 | 2.0 | 1060 | $895 | $0.84 | 22d | 1 | 1.19mi |
| 4707 Mitford Cir Montgomery, AL | 3.0 | 2.0 | 1943 | $1,800 | $0.93 | 45d | 1 | 1.28mi |
| 5635 Red Barn Rd Unit 1043848P Montgomery, AL | 3.0 | 2.0 | 1496 | $3,390 | $2.27 | 15d | 1 | 1.29mi |
| 2140 Rexford Rd Montgomery, AL | 2.0 | 2.5 | 1428 | $1,275 | $0.89 | 45d | 1 | 1.30mi |
| 7104 Fair Oaks Ct Montgomery, AL | 3.0 | 2.0 | 1656 | $1,881 | $1.14 | 45d | 1 | 1.34mi |
| 500 Eastdale Rd S Montgomery, AL | 1.0–3.0 | 1.0–2.5 | 1042 | $900 | $0.86 | 22d | 20 | 1.34mi |
| 455 Eastdale Rd S Montgomery, AL | 1.0–2.0 | 1.0 | 950 | $850 | $0.89 | 15d | 6 | 1.35mi |
| 3201 Watchman Dr Montgomery, AL | 1.0–3.0 | 1.0–2.0 | 1054 | $1,644 | $1.56 | 15d | 10 | 1.37mi |
| 336 Davors Dr Montgomery, AL | 3.0 | 2.0 | 1569 | $2,200 | $1.40 | 45d | 1 | 1.41mi |
| 7406 Mill Ridge Ct Montgomery, AL | 3.0 | 2.0 | 1785 | $2,250 | $1.26 | 46d | 1 | 1.42mi |
| 1845 Young Farm Rd Montgomery, AL | 3.0 | 2.0 | 1444 | $1,750 | $1.21 | 45d | 1 | 1.44mi |
| 5540 Ash Grove Cir Montgomery, AL | 4.0 | 2.0 | 1904 | $2,200 | $1.16 | 22d | 1 | 1.48mi |
Listing history 25 events
-
2026-06-03status $118,400 Pending 127 DOM
-
2026-06-02days on market $118,400 Contingent 127 DOM
-
2026-06-01days on market $118,400 Contingent 126 DOM
-
2026-05-31days on market $118,400 Contingent 125 DOM
-
2026-05-30days on market $118,400 Contingent 124 DOM
-
2026-04-07status Active 664-char remark
Show marketing remark (664 chars)
Current tenant on section 8 at $1,184 until 10/30/26. Ask about interest rate buy down too! You're going to love the location of this house. Located seconds from Woodmere Park and the Shakespeare Festival makes it super easy to get to all restaurants and interstate. Recently painted & new LVP flooring has been installed upstairs (summer of 2025). Dishwasher, refrigerator and electric range remain. Located next door to the Alabama Shakespeare Festival, Montgomery Museum of Fine Arts, & the Blount Cultural Park, you'll have culture and nature at your doorstep. Plus, you're just minutes away from shopping and the Maxwell and Gunter Air Force Bases.
-
2026-03-28historical Contingent 664-char remark
Show marketing remark (664 chars)
Current tenant on section 8 at $1,184 until 10/30/26. Ask about interest rate buy down too! You're going to love the location of this house. Located seconds from Woodmere Park and the Shakespeare Festival makes it super easy to get to all restaurants and interstate. Recently painted & new LVP flooring has been installed upstairs (summer of 2025). Dishwasher, refrigerator and electric range remain. Located next door to the Alabama Shakespeare Festival, Montgomery Museum of Fine Arts, & the Blount Cultural Park, you'll have culture and nature at your doorstep. Plus, you're just minutes away from shopping and the Maxwell and Gunter Air Force Bases.
-
2026-01-26$118,400 Active 664-char remark
Show marketing remark (664 chars)
Current tenant on section 8 at $1,184 until 10/30/26. Ask about interest rate buy down too! You're going to love the location of this house. Located seconds from Woodmere Park and the Shakespeare Festival makes it super easy to get to all restaurants and interstate. Recently painted & new LVP flooring has been installed upstairs (summer of 2025). Dishwasher, refrigerator and electric range remain. Located next door to the Alabama Shakespeare Festival, Montgomery Museum of Fine Arts, & the Blount Cultural Park, you'll have culture and nature at your doorstep. Plus, you're just minutes away from shopping and the Maxwell and Gunter Air Force Bases.
-
2025-10-15historical $1,200
-
2025-10-14$1,200
-
2025-07-30$124,900 Active
-
2025-04-29historical Contingent
-
2025-02-12status Active
-
2025-01-29status Pending
-
2025-01-21historical Contingent
-
2025-01-06price $129,900
-
2024-08-19$145,000 Active
-
2024-04-19$150,000 Active
-
2023-09-13soldstatus $129,900
-
2023-09-09status Pending
-
2023-09-07soldstatus $129,900 Closed
-
2023-08-16historical Contingent
-
2023-08-14$129,900 Active
-
2023-06-20soldstatus $64,500
-
2011-05-19soldstatus $80,000
ⓘ Source: listings_history table (triggers on properties + properties_extension) + one-shot
backfill from property_details.listing_events for pre-trigger history.
Tax reassessment forecast AL · Resets to sale price
- Current annual tax
- $1,310 · $109/mo
- Projected year-2 tax
- $1,310 · $109/mo
- Expected delta
- $0/yr ($0/mo · 0.0%)
ⓘ Screening estimate from a state-policy table — verify with the county assessor before closing.
Climate risk First Street
- Flood 1/10 Low FEMA zone X (unshaded) · 0% chance over 30 yrs
- Wildfire 3/10 Moderate
- Heat 8/10 Severe 7 d/yr ≥108°F today · 20 d/yr by 30 yrs out
- Wind 6/10 Major 77% chance of damaging wind over 30 yrs
- Air quality 4/10 Moderate 4 unhealthy d/yr today · 5 by 30 yrs out
Nearby sold comps map
Loading sold comps map…
Walkable amenities ~0.75 mi
Loading nearby amenities…
Taxation est. · year 1
- Rental income
- $18,340
- − Mortgage interest
- −$6,632
- − Property taxes
- −$1,310
- − Insurance
- −$592
- − Repairs & maintenance
- −$1,467
- − Management
- −$1,467
- − Depreciation
- −$3,444
- Taxable income
- $3,427
- Est. tax owed @ 24.0%
- −$822
- After-tax cash flow
- $4,313/yr
For passive investors: Depreciation is non-cash, so a rental often shows a tax loss while cash-flowing — sheltering income. Rental losses are passive: they offset passive income freely, and up to $25,000/yr can offset ordinary (W-2) income if you actively participate and your MAGI is under $100k (phasing out to $0 by $150k); unused losses carry forward. On sale, claimed depreciation is recaptured at up to 25%, and gains may owe capital-gains tax (a 1031 exchange can defer both). Figures are a year-1 estimate at your 24.0% rate — not tax advice; consult a CPA.
Schools (NCES district)
- District
- Montgomery County
- NCES district ID
- 0102430
- Math proficiency
- 9% ▼ -21.00%
- Reading proficiency
- 31% ▼ -1.00%
- Median HH income
- $43,902
- Composite
- 17.24/100
- National rank
- #9093
- State rank
- #106 of 129 in AL
Livability — Montgomery
- Score
- 65/100
- State rank
- #138
- US rank
- #13416
Category grades
Schools grade is shown separately in the Schools card above.
Census & demographics
- Census place
- Montgomery, AL
- County
- Montgomery County · 190,016 people
- City population
- 175,913
- Metro
- Montgomery, AL
- Population (ZIP)
- 53,172
- Household income
- $74,720
- Rent vs Own
- Severe rent burden
- 1742.0
Population outlook (Montgomery County) Hauer SSP2
- Today (2025)
- 224,008 people
- By 2030
- 221,460 · -1.1%
- By 2040
- 214,179 · -4.4%
- By 2050
- 204,912 · -8.5%
- By 2075
- 177,821 · -20.6%
- By 2100
- 145,134 · -35.2%
Race, ethnicity, and origin ACS 2023
- Neighborhood character
- Diverse neighborhood (Simpson 0.60)
- Race & ethnicity
- Black 53% White 34% Asian 8% Two or more races 3% Hispanic / Latino 3%
- Common ancestry
- Italian 1% Slovak 1% Lithuanian 1%
- Foreign-born
- 9% · South Korea, Canada, China
- Languages at home
- 90% English-only · Korean 4% Spanish 3% Other Indo-European 1%
Political lean MEDSL · Montgomery
- 2024 margin
- Solid D (+30.7) · D 64.8% · R 34.1% · Other 1.1%
- 2008→2024 swing
- +11.5pp toward D · 2008: 19.2pp · 2024: 30.7pp
- All cycles
- 2024: D+30.7 2020: D+31.5 2016: D+26.2 2012: D+24.3 2008: D+19.2
Not yet ingested
- Civics
- —
Market trends
- HPI YoY
- ▼ -37.24%
- Current HPI
- 148.7728
- Rent YoY
- ▲ 2.99%
- Metro
- Montgomery, AL
- State GDP YoY
- ▲ 2.94%
- F500 in state
- 4
Industry mix (Fortune 500 HQ in AL)
| Industry | F500 HQs | Revenue |
|---|---|---|
| Financial Services | 1 | $8B |
|
||
| Healthcare | 1 | $5B |
|
||
Price history
+48.0% since first listed20 events — show timeline
- 2026-04-07 Relisted — MAAR
- 2026-03-28 Contingent — MAAR
- 2026-01-26 Listed $118,400 MAAR
- 2025-10-15 Rental Removed $1,200 MAAR
- 2025-10-14 Listed for Rent $1,200 MAAR
- 2025-07-30 Listed $124,900 MAAR
- 2025-04-29 Contingent — MAAR
- 2025-02-12 Relisted — MAAR
- 2025-01-29 Pending — MAAR
- 2025-01-21 Contingent — MAAR
- 2025-01-06 Price Changed $129,900 MAAR
- 2024-08-19 Listed $145,000 MAAR
- 2024-04-19 Listed $150,000 MAAR
- 2023-09-13 Sold (Public Records) $129,900 Public Records
- 2023-09-09 Pending — MAAR
- 2023-09-07 Sold (MLS) $129,900 MAAR
- 2023-08-16 Contingent — MAAR
- 2023-08-14 Listed $129,900 MAAR
- 2023-06-20 Sold (Public Records) $64,500 Public Records
- 2011-05-19 Sold (Public Records) $80,000 Public Records
Property tax history
+14.8%/yrLatest (2025): $1,310 · +4.4% YoY. Source: county tax records.
Cash-flow waterfall
monthlySold comps — $/sqft
last 12 mo · ≤1 miLoading sold comps…