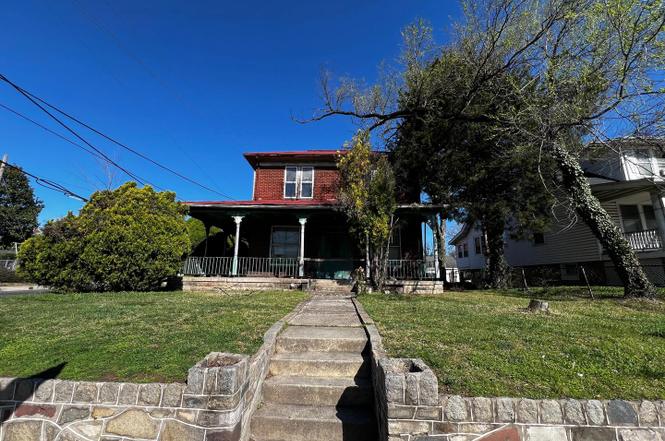
5301 Blair Rd NE · Washington, DC
Flood risk 1/10 · Minimal
- FEMA flood zone
- X (unshaded)
- Chance of flooding over 30 yrs
- 0.0%
- Est. flood insurance / yr
- $473 – $860
Fire risk 1/10 · Minimal
- Est. fire insurance / yr
- $631 – $1,173
Heat risk 7/10 · Major
- Hot days now (above 104°F)
- 7 days/yr
- Hot days in 30 yrs
- 15 days/yr
Wind risk 4/10 · Minor
- Chance of severe wind over 30 yrs
- 20.0%
Air-quality risk 4/10 · Minor
- Unhealthy air days now
- 5 days/yr
- Unhealthy air days in 30 yrs
- 6 days/yr
Risk factors via First Street. Map © Google.
Why this score? — see what drove the B grade
The composite is a weighted blend of 9 inputs, each scored 0–100. Each bar is that input's sub-score; the figure is the points it added to the 100-point composite (weight × sub-score).
- Cash flow +28.5/30.0
- ARV discount +15.0/15.0
- DSCR +10.0/10.0
- 1% rule +7.9/10.0
- Livability +3.7/5.0
- Schools +3.6/10.0
- Rent growth +2.9/5.0
- Condition / age +2.5/5.0
- Appreciation +0.0/10.0
$325,000
🖨 Deal sheet 📄 Offer letter ✓ Due diligence
Listing remarks
Exceptional Rebuild Opportunity in Chillum/Brightwood! SOLD STRICTLY AS-IS! This corner lot property presents a rare chance to start fresh and build new in one of NE DC’s most central locations. The existing home includes 4 bedrooms and 2 full baths, but the structure has extensive interior damage and significant portions are beyond repair, making this property an ideal candidate for a complete teardown and custom rebuild. The lot offers great potential and is conveniently located near shopping, schools, and commuter routes. An oversized detached two-car garage with a full second level adds extra value and versatility—perfect for storage, a workshop, or future renovation. All sh
Key facts
- Custom rebuild
- Corner lot
- 6,500 sq ft lot
Tags
Neighborhood map
What this means for you Summary
Snapshot
- This is a 4-bed/1.0-bath single-family listed at $325k.
Deal economics
- At list price, monthly cash flow is $1k ($13k/yr) — positive.
- The deal already cash-flows at list — no discount required.
- Meets the 1% rule at list price ($4k rent vs $325k).
- Recommended offer: $315k (3.0% below list) — sets the bar for market timing.
- Cap rate 10.2% vs local median 2.5% in Washington — top-decile yield for the area; either an underpriced asset or a hidden risk that comps aren't pricing in. Stress-test before assuming the spread holds.
Location & tenants
- Location reads 73/100 on livability (#1 in DC) — a middle-class / working-renter tenant base. Strengths: amenities A+, commute A+, employment A+; Watch: crime F, cost of living F.
- District Of Columbia Public Schools (urban): math 33% / reading 40% proficiency, ranked #8 of 32 in DC (top 25%) — families likely to look elsewhere, expect single-tenant / working-renter base with shorter leases; 65% free/reduced lunch — lower-income household profile, screen leases tightly.
- Zoned schools: Coolidge Hs (1,015 students, 0% FRL) — zoned schools average 0% FRL vs 65% district-wide (65 pts lower); this property's tenant base skews higher-income than the district average.
- Market conditions: Rents rising (+1.4%/yr); 370 active listings in the ZIP; 40 comparable units currently listed for rent nearby; rentals at typical pace (median 19d on market — plan ~3-4 weeks tenant-placement turnaround); high-income renter base; 1,737 units permitted in District of Columbia in 2024 (1,506 in 5+ unit buildings).
- At $4,182/mo this rent would consume 45% of the median local household income ($110k/yr) (locally 3020% of renters already pay >50% of income on rent) — very limited rent-growth headroom before tenants either downsize or default.
Forward outlook
- Local home prices are declining (-3.0%/yr); year-one equity from $2k of loan paydown is wiped out by about $10k of value loss. Plan a longer hold.
- District of Columbia County population projected at +50% by 2050 — long-run rental-demand tailwind backs the buy-and-hold thesis.
- At projected returns (-3.0% appreciation + 1.4% rent growth), your $91k cash investment doubles in ~10 years — after that, you're playing with house money.
Negotiation context
- It's been on market 32 days — a 3% lower offer ($315k) is reasonable based on typical stale-listing flexibility.
- 5 sale attempts since 4y ago; this cycle's ask has dropped $25k (7%) from the opening price — seller is motivated, your offer sets the floor, not the list.
Risks & watch-outs
- Watch-outs: built in 1910 — expect roof / HVAC / electrical / plumbing capex.
- Climate carrying-cost: extreme-heat days projected 7→15/yr by 2055 (HVAC capex compounding) — expect insurance premiums to compound above CPI over the hold.
Questions for the listing agent
- It's been on market 32 days. Have you received any prior offers? Is the seller open to a 3% concession, seller financing, or rate buy-down credit?
- Built in 1910 — when were the roof, HVAC, electrical panel, plumbing, and water heater last replaced?
- Is there a deadline driving the sale (1031 exchange, divorce, estate, relocation)? That informs how much negotiation room exists.
- Crime grade is F in this area — have there been break-ins, vandalism, or insurance claims at this property in the last 3 years? What carrier currently insures it and at what premium?
- What's the average days-on-market for RENTAL listings here right now (not sales)? A rising rental-DOM trend means longer vacancies and softer asking-rent achievability than the comps imply.
- What's the recent tenant-quality profile in this submarket — average credit score on applications, eviction rate, late-payment / NSF rate, and stable-employment percentage? A property-management company in the area should have these aggregated.
- How much new for-sale + rental construction is in the pipeline within 1–3 miles? Heavy new supply typically softens prices + rents 12–24 months out; constrained supply supports both.
Investment metrics
- 1% rule
- 1.29% ✓
- Cap rate
- 10.20%
- Cash-on-cash
- 13.95%
- DSCR
- 1.62
- GRM
- 6.5
CMA / ARV
- ARV (on-the-fly)
- $613,456
- Comps found
- 12
Show comp detail 12 sales within ~0.75 mi
| Address | Dist | Beds/Ba | Sqft | Sold | Price | $/sf | Match |
|---|---|---|---|---|---|---|---|
| 5608 1st St NE | 0.19mi | 3/2.0 (-1) | 1,643 (-1%) | 7mo | $659,700 | $402 | 74 |
| 31 Mcdonald Pl NE | 0.28mi | 4/2.0 | 1,780 (+7%) | 6mo | $525,000 | $295 | 67 |
| 5506 Blair Rd NE | 0.11mi | 3/2.5 (-1) | 1,880 (+13%) | 8mo | $695,000 | $370 | 56 |
| 6021 North Dakota Ave NW | 0.61mi | 3/2.0 (-1) | 1,737 (+4%) | 4mo | $650,000 | $374 | 52 |
| 5520 North Capitol St NW | 0.18mi | 3/1.5 (-1) | 1,902 (+14%) | 11mo | $510,000 | $268 | 52 |
| 129 Hamilton St NW | 0.33mi | 3/2.0 (-1) | 1,520 (-9%) | 15mo | $470,000 | $309 | 49 |
| 6118 Sligo Mill Rd NE | 0.63mi | 3/— (-1) | 1,855 (+11%) | 4mo | $682,500 | $368 | 44 |
| 203 Peabody St NW | 0.63mi | 3/3.0 (-1) | 1,799 (+8%) | 1mo | $703,000 | $391 | 43 |
| 214 Oneida St NE | 0.49mi | 3/3.5 (-1) | 1,760 (+6%) | 16mo | $595,000 | $338 | 39 |
| 5911 4th St NW | 0.72mi | 4/2.5 | 1,844 (+11%) | 7mo | $685,000 | $371 | 37 |
| 315 Quackenbos St NE | 0.63mi | 4/3.0 | 1,917 (+15%) | 12mo | $534,000 | $279 | 28 |
| 6212 New Hampshire Ave NE | 0.74mi | 3/2.5 (-1) | 1,856 (+11%) | 15mo | $405,000 | $218 | 23 |
Match score weights: distance 35% · size 25% · config 20% · recency 20%. Top-matched comps best support the ARV.
Projected returns pro-forma
-3.0% appreciation · 1.45% rent growth · sell at horizon
- IRR
- 2.4%
- Equity multiple
- 1.09×
- Total profit
- $8,370
- Equity at exit
- $48,459
- IRR
- 10.5%
- Equity multiple
- 1.76×
- Total profit
- $68,776
- Equity at exit
- $28,100
Cash invested: $91,000 (down + closing). Projections, not guarantees.
Landlord ↔ Tenant lean methodology
- Overall (CITY)
- 0 Strongly Tenant-Friendly
- State District of Columbia
- 12 Strongly Tenant-Friendly · D+43
- County
- — inherits STATE
- City Washington
- 0 Strongly Tenant-Friendly · D+43
ZIP-level market 20011
- Rents YoY
- 1.4%
- Active inventory
- 370
- Price-to-rent
- 6.5×
Monthly cashflow live
- Estimated rent
- $4,182 high interval (Pro) →
- Mortgage (P&I)
- −$1,704
- Tax est. 1.5%
- −$406 /mo · $4,875/yr
- Insurance
- −$135
- HOA
- −$0
- Vacancy / Maint / Mgmt
- −$878
- Net cashflow
- $1,058
Break-even live
UW: 25.0% down · 7.5% · 30yr · 1.5% tax · 5.0% vac · 8.0% maint · 8.0% mgmt
Financing live
Cash to close
- Down payment
- $81,250
- Closing costs
- $9,750
- Reserves months
- —
- Total cash needed
- —
Loan-product check · same deal, 3 products live
Conventional
25% down · 7.5% · 30yr
- Down + closing
- —
- Monthly P&I
- —
- Monthly cashflow
- —
- DSCR
- —
- Eligible?
- —
Personal DTI + credit; lowest rate.
DSCR
20% down · 8.5% · 30yr
- Down + closing
- —
- Monthly P&I
- —
- Monthly cashflow
- —
- DSCR
- —
- Eligible?
- —
No personal income docs; deal must DSCR.
Hard money
10% down · 12.0% · 12mo
- Down + closing
- —
- Monthly P&I
- —
- Monthly cashflow
- —
- DSCR
- —
- Eligible?
- —
Short-term bridge; refi at stabilization.
Rent comps 40 comps
| Address | Beds | Baths | Sqft | Rent | $/sqft | DOM | Units | Dist |
|---|---|---|---|---|---|---|---|---|
| 5520 N Capitol St NW Washington, DC | 4.0 | 3.5 | 2070 | $5,399 | $2.61 | 4d | 1 | 0.21mi |
| 118 Longfellow St NW Washington, DC | 3.0 | 2.5 | 1803 | $7,804 | $4.33 | 1d | 1 | 0.34mi |
| 5201 2nd St NW Unit A Washington, DC | 4.0 | 2.5 | 2000 | $4,000 | $2.00 | 24d | 1 | 0.35mi |
| 317 Riggs Rd NE Washington, DC | 3.0 | 3.5 | 2040 | $3,950 | $1.94 | 19d | 1 | 0.36mi |
| 317 Riggs Rd NE Washington, DC | 3.0 | 3.5 | 2040 | $3,950 | $1.94 | 18d | 1 | 0.36mi |
| 207 Kennedy St NW Washington, DC | 5.0 | 2.5 | 1537 | $6,600 | $4.29 | 1d | 1 | 0.40mi |
| 225 Missouri Ave NW Washington, DC | 5.0 | 4.5 | 2138 | $7,100 | $3.32 | 1d | 1 | 0.43mi |
| 4607 N Capitol St NE Washington, DC | 3.0 | 1.5 | 1536 | $2,975 | $1.94 | 24d | 1 | 0.51mi |
| 5370 Chillum Pl NE Washington, DC | 4.0 | 2.5 | 1088 | $4,400 | $4.04 | 24d | 1 | 0.53mi |
| 607 Jefferson St NE Washington, DC | 3.0 | 1.5 | 1200 | $3,295 | $2.75 | 4d | 1 | 0.55mi |
| 12 Hawaii Ave NE Washington, DC | 3.0 | 2.0 | 1650 | $4,000 | $2.42 | 24d | 1 | 0.55mi |
| 66 Allison St NE Unit 66 Washington, DC | 3.0 | 2.0 | 1545 | $3,500 | $2.27 | 24d | 1 | 0.57mi |
| 242 Emerson St NW Washington, DC | 4.0 | 2.5 | 1800 | $3,775 | $2.10 | 18d | 1 | 0.58mi |
| 5404 4th St NW #2 Washington, DC | 4.0 | 3.5 | 2250 | $5,900 | $2.62 | 4d | 1 | 0.60mi |
| 5404 4th St NW #1 Washington, DC | 4.0 | 4.5 | 2250 | $5,500 | $2.44 | 4d | 1 | 0.60mi |
| 612 Totten Pl NE Washington, DC | 3.0 | 3.5 | 1876 | $3,700 | $1.97 | 24d | 1 | 0.66mi |
| 5802 8th St NE Washington, DC | 3.0 | 2.5 | 1534 | $3,300 | $2.15 | 24d | 1 | 0.67mi |
| 775 Oglethorpe St NE Washington, DC | 4.0 | 2.5 | 1700 | $3,450 | $2.03 | 12d | 1 | 0.67mi |
| 424 Missouri Ave NW #4 Washington, DC | 3.0 | 3.0 | 1500 | $4,500 | $3.00 | 24d | 1 | 0.70mi |
| 5042 8th St NE Washington, DC | 3.0 | 2.0 | 1479 | $3,295 | $2.23 | 24d | 1 | 0.74mi |
| 521 Kennedy St NW #4 Washington, DC | 3.0 | 2.0 | 1333 | $3,250 | $2.44 | 24d | 1 | 0.75mi |
| 139 Hawaii Ave NE Washington, DC | 3.0 | 2.0 | 1728 | $3,600 | $2.08 | 15d | 1 | 0.75mi |
| 440 Delafield Pl NW Washington, DC | 3.0 | 2.5 | 1564 | $3,400 | $2.17 | 18d | 1 | 0.75mi |
| 440 Delafield Pl NW Washington, DC | 3.0 | 3.5 | 1564 | $3,400 | $2.17 | 18d | 1 | 0.75mi |
| 5030 South Dakota Ave NE Washington, DC | 4.0 | 2.0 | 1600 | $6,200 | $3.88 | 1d | 1 | 0.76mi |
| 733 Crittenden St NE Washington, DC | 4.0 | 2.0 | 1886 | $3,300 | $1.75 | 24d | 1 | 0.82mi |
| 41 Tuckerman St NW Washington, DC | 3.0 | 1.5 | 1088 | $3,000 | $2.76 | 24d | 1 | 0.88mi |
| 1033 Higgins Way Unit 1 Hyattsville, MD | 4.0 | 3.5 | 1424 | $3,000 | $2.11 | 5d | 1 | 0.89mi |
| 1002 Chillum Rd Hyattsville, MD | 4.0 | 2.0 | 2232 | $3,000 | $1.34 | 43d | 1 | 0.91mi |
| 4969 12th St NE Washington, DC | 3.0 | 2.0 | 1674 | $2,900 | $1.73 | 24d | 1 | 0.96mi |
| 6416 Blair Rd NW Washington, DC | 3.0 | 2.0 | 1240 | $3,100 | $2.50 | 7d | 1 | 0.97mi |
| 5326 9th St NW Unit 1 Washington, DC | 3.0 | 3.5 | 1547 | $4,500 | $2.91 | 18d | 1 | 1.02mi |
| 801 Cox Ave Hyattsville, MD | 3.0 | 2.0 | 1169 | $3,100 | $2.65 | 18d | 1 | 1.03mi |
| 4823 9th St NW Washington, DC | 4.0 | 2.0 | 2144 | $3,750 | $1.75 | 5d | 1 | 1.05mi |
| 310 Taylor St NW Washington, DC | 3.0 | 2.0 | 1728 | $4,200 | $2.43 | 24d | 1 | 1.08mi |
| 4312 10th St NE Washington, DC | 3.0 | 2.5 | 1602 | $3,900 | $2.43 | 7d | 1 | 1.15mi |
| 6302 7th St NW Washington, DC | 3.0 | 2.0 | 1581 | $3,825 | $2.42 | 12d | 1 | 1.15mi |
| 4450 Joseph Pl NE Washington, DC | 3.0 | 2.5 | 1460 | $4,095 | $2.80 | 24d | 1 | 1.18mi |
| 4605 Georgia Ave NW Washington, DC | 4.0 | 3.0 | 2000 | $4,500 | $2.25 | 7d | 1 | 1.20mi |
| 5601 13th St NW Washington, DC | 2.0–4.0 | 1.0–2.0 | 862 | $5,008 | $5.81 | 3d | 21 | 1.21mi |
Listing history 12 events
-
2026-03-24status Pending
-
2026-03-13price $325,000
-
2026-03-13status Active
-
2026-02-17status Pending
-
2026-01-27$350,000 Active
-
2026-01-27historical
-
2026-01-23status Active
-
2026-01-09historical Active Under Contract
-
2025-11-06$350,000 Active
-
2022-12-23status Pending
-
2022-12-23historical
-
2022-12-16$300,000 Active
ⓘ Source: listings_history table (triggers on properties + properties_extension) + one-shot
backfill from property_details.listing_events for pre-trigger history.
Climate risk First Street
- Flood 1/10 Low FEMA zone X (unshaded) · 0% chance over 30 yrs
- Wildfire 1/10 Low
- Heat 7/10 Severe 7 d/yr ≥104°F today · 15 d/yr by 30 yrs out
- Wind 4/10 Moderate 20% chance of damaging wind over 30 yrs
- Air quality 4/10 Moderate 5 unhealthy d/yr today · 6 by 30 yrs out
Nearby sold comps map
Loading sold comps map…
Walkable amenities ~0.75 mi
Loading nearby amenities…
Taxation est. · year 1
- Rental income
- $50,190
- − Mortgage interest
- −$18,205
- − Property taxes
- −$4,875
- − Insurance
- −$1,625
- − Repairs & maintenance
- −$4,015
- − Management
- −$4,015
- − Depreciation
- −$9,455
- Taxable income
- $8,000
- Est. tax owed @ 24.0%
- −$1,920
- After-tax cash flow
- $10,778/yr
For passive investors: Depreciation is non-cash, so a rental often shows a tax loss while cash-flowing — sheltering income. Rental losses are passive: they offset passive income freely, and up to $25,000/yr can offset ordinary (W-2) income if you actively participate and your MAGI is under $100k (phasing out to $0 by $150k); unused losses carry forward. On sale, claimed depreciation is recaptured at up to 25%, and gains may owe capital-gains tax (a 1031 exchange can defer both). Figures are a year-1 estimate at your 24.0% rate — not tax advice; consult a CPA.
Schools (NCES district)
- District
- District Of Columbia Public Schools
- NCES district ID
- 1100030
- Math proficiency
- 33% ▲ 3.00%
- Reading proficiency
- 40% ▲ 5.00%
- Median HH income
- $67,671
- Composite
- 35.84/100
- National rank
- #9606
- State rank
- #8 of 32 in DC
Livability — Washington
- Score
- 73/100
- State rank
- #1
- US rank
- #5327
Category grades
Schools grade is shown separately in the Schools card above.
Census & demographics
- Census place
- Washington, DC
- County
- District of Columbia · 671,873 people
- City population
- 671,873
- Metro
- Washington-Arlington-Alexandria, DC-VA-MD-WV
- Population (ZIP)
- 67,434
- Household income
- $110,309
- Rent vs Own
- Severe rent burden
- 3020.0
Population outlook (District of Columbia County) Hauer SSP2
- Today (2025)
- 821,926 people
- By 2030
- 899,517 · +9.4%
- By 2040
- 1,061,162 · +29.1%
- By 2050
- 1,231,493 · +49.8%
- By 2075
- 1,603,312 · +95.1%
- By 2100
- 1,847,141 · +124.7%
Race, ethnicity, and origin ACS 2023
- Neighborhood character
- Diverse neighborhood (Simpson 0.66)
- Race & ethnicity
- Black 50% Hispanic / Latino 23% White 20% Two or more races 10% Asian 2%
- Hispanic origin (detail)
- Mexican 2% Dominican 1%
- Common ancestry
- Lithuanian 1% Romanian 1% Slovak 1%
- Foreign-born
- 21% · Canada
- Languages at home
- 70% English-only · Spanish 20% French/Haitian/Cajun 2% Other Indo-European 1%
Political lean MEDSL · District of Columbia
- 2024 margin
- Solid D (+86.1) · D 91.2% · R 5.1% · Other 3.8%
- 2008→2024 swing
- +0.1pp no change · 2008: 85.9pp · 2024: 86.1pp
- All cycles
- 2024: D+86.1 2020: D+86.8 2016: D+88.7 2012: D+84.2 2008: D+85.9
Not yet ingested
- Civics
- —
Market trends
- HPI YoY
- ▼ -755.96%
- Current HPI
- 378.1083
- Rent YoY
- ▲ 1.45%
- Metro
- Washington-Arlington-Alexandria, DC-VA-MD-WV
- State GDP YoY
- ▲ 1.33%
- F500 in state
- 6
Industry mix (Fortune 500 HQ in DC)
| Industry | F500 HQs | Revenue |
|---|---|---|
| Financial Services | 1 | $153B |
|
||
| Life Sciences / Industrials | 1 | $25B |
|
||
| Industrial Machinery | 1 | $8B |
|
||
Price history
+8.3% since first listed12 events — show timeline
- 2026-03-24 Pending — BRIGHT MLS
- 2026-03-13 Price Changed $325,000 BRIGHT MLS
- 2026-03-13 Relisted — BRIGHT MLS
- 2026-02-17 Pending — BRIGHT MLS
- 2026-01-27 Listing Removed — BRIGHT MLS
- 2026-01-27 Listed $350,000 BRIGHT MLS
- 2026-01-23 Relisted — BRIGHT MLS
- 2026-01-09 Contingent — BRIGHT MLS
- 2025-11-06 Listed $350,000 BRIGHT MLS
- 2022-12-23 Pending — BRIGHT MLS
- 2022-12-23 Listing Removed — BRIGHT MLS
- 2022-12-16 Listed $300,000 BRIGHT MLS
Cash-flow waterfall
monthlySold comps — $/sqft
last 12 mo · ≤1 miLoading sold comps…