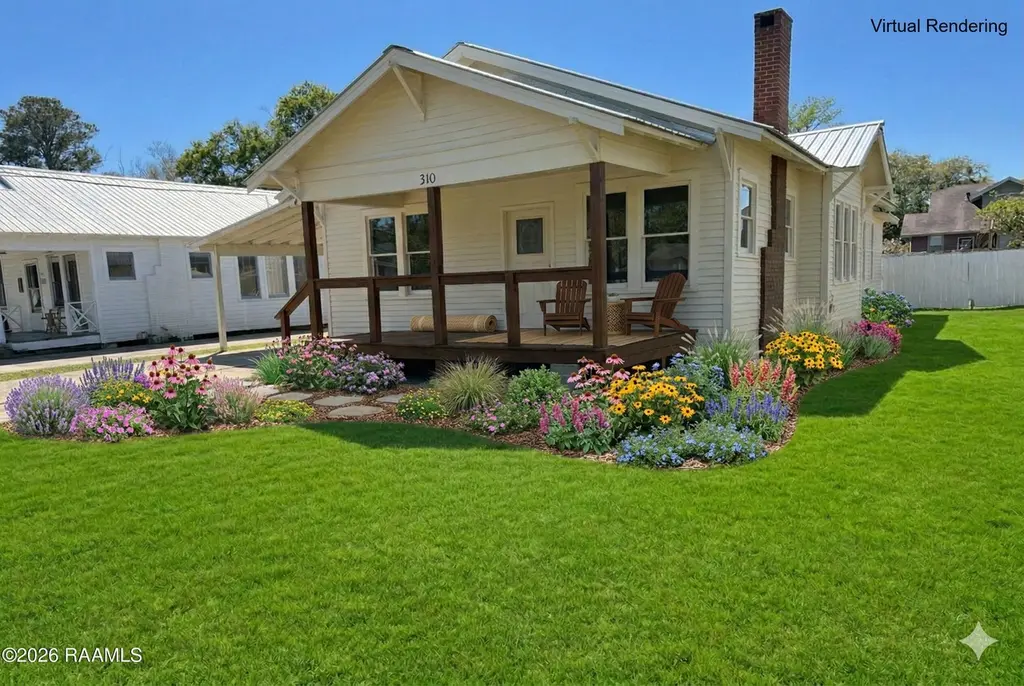
310 Monroe St · Lafayette, LA
Flood risk 4/10 · Minor
- FEMA flood zone
- X (unshaded)
- Chance of flooding over 30 yrs
- 0.22%
- Est. flood insurance / yr
- $507 – $1,088
Fire risk 1/10 · Minimal
- Est. fire insurance / yr
- $1,269 – $2,357
Heat risk 9/10 · Severe
- Hot days now (above 108°F)
- 7 days/yr
- Hot days in 30 yrs
- 21 days/yr
Wind risk 9/10 · Severe
- Chance of severe wind over 30 yrs
- 99.0%
Air-quality risk 2/10 · Minimal
- Unhealthy air days now
- 0 days/yr
- Unhealthy air days in 30 yrs
- 1 days/yr
Risk factors via First Street. Map © Google.
Why this score? — see what drove the B grade
The composite is a weighted blend of 9 inputs, each scored 0–100. Each bar is that input's sub-score; the figure is the points it added to the 100-point composite (weight × sub-score).
- Cash flow +30.0/30.0
- 1% rule +10.0/10.0
- DSCR +10.0/10.0
- ARV discount +7.5/15.0
- Rent growth +4.3/5.0
- Schools +3.6/10.0
- Livability +3.5/5.0
- Condition / age +2.5/5.0
- Appreciation +0.0/10.0
$95,000
🖨 Deal sheet (PDF) 📄 Offer letter ✓ Due diligence
Listing remarks MLS
Sold in ''As is Condition/No Repairs by Seller''.
Key facts
- New metal roof
- Convenient access
- Updated plumbing
Tags
Property features AI
Exterior
- Parking: Carport with 1 covered parking space (1 total parking space)
- Utilities: Public sewer; City electric
- Home design: Single-family residence; Fixer condition
- Construction: Wood siding; Frame construction; Metal roof
- Exterior features: Metal roof; Wood siding and frame construction; City street frontage
Interior
- Flooring: Carpet; Tile; Wood
- Bathrooms: 2 full bathrooms
- Heating & cooling: Central heating; Central air conditioning
- Interior features: Carpet, tile and wood flooring
Neighborhood map
What this means for you Summary
Snapshot
- This is a 3-bed/2.0-bath single-family listed at $95k.
Deal economics
- At list price, monthly cash flow is $548 ($7k/yr) — positive.
- The deal already cash-flows at list — no discount required.
- Meets the 1% rule at list price ($1k rent vs $95k).
- Cap rate 13.2% vs local median 4.7% in Lafayette — top-decile yield for the area; either an underpriced asset or a hidden risk that comps aren't pricing in. Stress-test before assuming the spread holds.
Location & tenants
- Location reads 70/100 on livability (#63 in LA) — a middle-class / working-renter tenant base. Strengths: cost of living A+, housing A+, health & safety A+; Watch: amenities C-, employment C-, crime F.
- Lafayette Parish (urban): math 38% / reading 46% proficiency, ranked #19 of 98 in LA (top 19%) — families likely to look elsewhere, expect single-tenant / working-renter base with shorter leases.
- Zoned schools: Acadian Middle School (math 13% / reading 27%, grade F, #166 of 218 statewide, top 76%, 372 students, 74% FRL); Lafayette High School (math 57% / reading 51%, grade C-, #28 of 265 statewide, top 11%, 1,852 students, 52% FRL).
- Market conditions: Rents rising fast (+7.3%/yr); 247 active listings in the ZIP; 30 comparable units currently listed for rent nearby; rentals at typical pace (median 22d on market — plan ~3-4 weeks tenant-placement turnaround); 47% of comp listings sitting > 30 days — soft ceiling on asking rent; lower-income renter base — watch delinquency; 1,585 units permitted in Lafayette Parish in 2024 (10 in 5+ unit buildings).
- At $1,451/mo this rent would consume 52% of the median local household income ($33k/yr) (locally 2089% of renters already pay >50% of income on rent) — very limited rent-growth headroom before tenants either downsize or default.
Forward outlook
- Local home prices are declining (-3.0%/yr); year-one equity from $657 of loan paydown is wiped out by about $3k of value loss. Plan a longer hold.
- Lafayette County population projected at +34% by 2050 — long-run rental-demand tailwind backs the buy-and-hold thesis.
- At projected returns (-3.0% appreciation + 7.3% rent growth), your $27k cash investment doubles in ~5 years — after that, you're playing with house money.
Negotiation context
- Only 11 days on market — expect competitive offers; lowballing is unlikely to land.
- 4 sale attempts since 22y ago with the ask held roughly flat each time — persistent listings suggest the price (not the market) is what's stuck; bring a comps-based counter.
- Current owner paid $68k; 39% above their basis — modest negotiation headroom, anchor on the comps not their cost.
Risks & watch-outs
- Climate carrying-cost: severe wind risk, 99% chance of damaging wind over 30y; extreme-heat days projected 7→21/yr by 2055 (HVAC capex compounding) — expect insurance premiums to compound above CPI over the hold.
Questions for the listing agent
- Built in 1960 — when were the roof, HVAC, electrical panel, plumbing, and water heater last replaced?
- Is there a deadline driving the sale (1031 exchange, divorce, estate, relocation)? That informs how much negotiation room exists.
- Schools are B-rated — typically a magnet for longer-tenancy family renters. What's the average tenant stay here, and is there a school-zone premium baked into asking?
- Crime grade is F in this area — have there been break-ins, vandalism, or insurance claims at this property in the last 3 years? What carrier currently insures it and at what premium?
- What's the average days-on-market for RENTAL listings here right now (not sales)? A rising rental-DOM trend means longer vacancies and softer asking-rent achievability than the comps imply.
- What's the recent tenant-quality profile in this submarket — average credit score on applications, eviction rate, late-payment / NSF rate, and stable-employment percentage? A property-management company in the area should have these aggregated.
- How much new for-sale + rental construction is in the pipeline within 1–3 miles? Heavy new supply typically softens prices + rents 12–24 months out; constrained supply supports both.
Investment metrics
- 1% rule
- 1.53% ✓
- Cap rate
- 13.21%
- Cash-on-cash
- 24.72%
- DSCR
- 2.10
- GRM
- 5.5
CMA / ARV
- ARV (median comp)
- $194,488
- List price
- $95,000
- Delta
- -43.44%
- Verdict
- UNDERPRICED
- Comps
- 20 within 1.0 mi
Show comp detail 12 sales within ~0.75 mi
| Address | Dist | Beds/Ba | Sqft | Sold | Price | $/sf | Match |
|---|---|---|---|---|---|---|---|
| 405 N Buchanan St | 0.28mi | 2/2.0 (-1) | 1,507 (-3%) | 0mo | $65,000 | $43 | 76 |
| 314 Monroe St | 0.01mi | 3/2.0 | 1,360 (-13%) | 7mo | $194,900 | $143 | 72 |
| 518 Evangeline Dr | 0.67mi | 3/2.0 | 1,579 (+1%) | 2mo | $252,000 | $160 | 65 |
| 123 Park Ave | 0.61mi | 2/2.0 (-1) | 1,613 (+4%) | 2mo | $155,000 | $96 | 59 |
| 223 Lafayette St | 0.20mi | 4/2.0 (+1) | 1,371 (-12%) | 9mo | $34,000 | $25 | 58 |
| 519 Mudd Ave | 0.41mi | 3/2.0 | 1,412 (-9%) | 9mo | $145,000 | $103 | 58 |
| 317 Cedar Crest Ct | 0.57mi | 3/2.0 | 1,433 (-8%) | 9mo | $160,000 | $112 | 53 |
| 217 S Orange St | 0.56mi | 3/2.0 | 1,490 (-4%) | 18mo | $100,000 | $67 | 52 |
| 412 S Sterling St | 0.69mi | 3/2.0 | 1,650 (+6%) | 9mo | $140,000 | $85 | 51 |
| 904 W Congress St | 0.48mi | 3/2.0 | 1,722 (+10%) | 12mo | $250,000 | $145 | 50 |
| 304 Versailles Blvd | 0.64mi | 2/1.0 (-1) | 1,450 (-7%) | 3mo | $240,000 | $166 | 47 |
| 508 Evangeline Dr | 0.65mi | 2/1.0 (-1) | 1,470 (-6%) | 15mo | $216,000 | $147 | 39 |
Match score weights: distance 35% · size 25% · config 20% · recency 20%. Top-matched comps best support the ARV.
Projected returns pro-forma
-3.0% appreciation · 7.35% rent growth · sell at horizon
- IRR
- 22.7%
- Equity multiple
- 1.98×
- Total profit
- $26,118
- Equity at exit
- $14,165
- IRR
- 33.3%
- Equity multiple
- 4.66×
- Total profit
- $97,377
- Equity at exit
- $8,214
Cash invested: $26,600 (down + closing). Projections, not guarantees.
Landlord ↔ Tenant lean methodology
- Overall (STATE)
- 90 Strongly Landlord-Friendly
- State Louisiana
- 90 Strongly Landlord-Friendly · R+12
- County
- — inherits STATE
- City
- — inherits STATE
ZIP-level market 70501
- Rents YoY
- 7.3%
- Active inventory
- 247
- Price-to-rent
- 5.5×
Monthly cashflow live
- Estimated rent
- $1,451 high interval (Pro) →
- Mortgage (P&I)
- −$498
- Tax from tax record
- −$60 /mo · $725/yr
- Insurance
- −$40
- HOA
- −$0
- Vacancy / Maint / Mgmt
- −$305
- Net cashflow
- $548
Break-even live
Sensitivity live
| Price | -10% $602 | -5% $575 | +0% $548 | +5% $521 | +10% $494 |
|---|---|---|---|---|---|
| Rent | -10% $433 | -5% $491 | +0% $548 | +5% $605 | +10% $663 |
| Rate | -1.0pp $596 | -0.5pp $572 | base $548 | +0.5pp $523 | +1.0pp $498 |
UW: 25.0% down · 7.5% · 30yr · 1.5% tax · 5.0% vac · 8.0% maint · 8.0% mgmt
Financing live
Cash to close
- Down payment
- $23,750
- Closing costs
- $2,850
- Reserves months
- —
- Total cash needed
- —
Loan-product check · same deal, 3 products live
Conventional
25% down · 7.5% · 30yr
- Down + closing
- —
- Monthly P&I
- —
- Monthly cashflow
- —
- DSCR
- —
- Eligible?
- —
Personal DTI + credit; lowest rate.
DSCR
20% down · 8.5% · 30yr
- Down + closing
- —
- Monthly P&I
- —
- Monthly cashflow
- —
- DSCR
- —
- Eligible?
- —
No personal income docs; deal must DSCR.
Hard money
10% down · 12.0% · 12mo
- Down + closing
- —
- Monthly P&I
- —
- Monthly cashflow
- —
- DSCR
- —
- Eligible?
- —
Short-term bridge; refi at stabilization.
Rent comps 30 comps
| Address | Beds | Baths | Sqft | Rent | $/sqft | DOM | Units | Dist |
|---|---|---|---|---|---|---|---|---|
| 615 Lafayette St Lafayette, LA | 2.0 | 2.0 | 1188 | $1,350 | $1.14 | 44d | 1 | 0.23mi |
| 109 Perth PL Lafayette, LA | 2.0 | 2.0 | 1150 | $1,625 | $1.41 | 14d | 1 | 0.42mi |
| 117 Perth PL Lafayette, LA | 2.0 | 2.0 | 1150 | $1,625 | $1.41 | 22d | 1 | 0.42mi |
| 423 Sampson St Lafayette, LA | 4.0 | 2.0 | 1400 | $950 | $0.68 | 44d | 1 | 0.45mi |
| 114 Carlin St Lafayette, LA | 2.0 | 2.5 | 1200 | $2,000 | $1.67 | 44d | 1 | 0.46mi |
| 1011 W Congress St Lafayette, LA | 2.0 | 1.0 | 1181 | $1,400 | $1.19 | 44d | 1 | 0.52mi |
| 1114 W Congress St Lafayette, LA | 2.0 | 1.0 | 1200 | $1,350 | $1.12 | 44d | 1 | 0.58mi |
| 215 Versailles Blvd Unit 3 Lafayette, LA | 3.0 | 2.0 | 1800 | $1,675 | $0.93 | 22d | 1 | 0.61mi |
| 1312 W University Ave Lafayette, LA | 3.0 | 2.0 | 1700 | $1,300 | $0.76 | 44d | 1 | 0.65mi |
| 1002 E Simcoe St Lafayette, LA | 4.0 | 2.0 | 1100 | $950 | $0.86 | 44d | 1 | 0.81mi |
| 903 Myrtle Pl Lafayette, LA | 3.0 | 2.0 | 2093 | $2,000 | $0.96 | 22d | 1 | 0.86mi |
| 213 General Gardner Ave Lafayette, LA | 3.0 | 1.0 | 1300 | $1,750 | $1.35 | 22d | 1 | 0.86mi |
| 300 General Mouton Ave #6 Lafayette, LA | 2.0 | 2.5 | 1200 | $1,600 | $1.33 | 14d | 1 | 0.89mi |
| 228 Amelia St Lafayette, LA | 3.0 | 1.5 | 1796 | $2,300 | $1.28 | 22d | 1 | 0.89mi |
| 908 Lamar St Unit 108 Lafayette, LA | 2.0 | 1.0 | 1050 | $1,025 | $0.98 | 14d | 1 | 0.90mi |
| 330 General Mouton Ave Lafayette, LA | 3.0 | 1.0 | 1200 | $1,500 | $1.25 | 14d | 1 | 0.92mi |
| 419 Saint Joseph St Lafayette, LA | 3.0 | 1.0 | 1200 | $1,500 | $1.25 | 14d | 1 | 1.02mi |
| 914 Saint Patrick St Lafayette, LA | 2.0 | 1.0 | 1200 | $1,295 | $1.08 | 44d | 1 | 1.05mi |
| 908 Saint Charles St Lafayette, LA | 3.0 | 2.0 | 1200 | $1,250 | $1.04 | 22d | 1 | 1.06mi |
| 300 Roosevelt St Unit A Lafayette, LA | 2.0 | 2.0 | 1070 | $1,750 | $1.64 | 14d | 1 | 1.06mi |
| 517 Saint Patrick St Lafayette, LA | 3.0 | 2.0 | 1600 | $1,650 | $1.03 | 22d | 1 | 1.08mi |
| 111 Sternberg Dr Lafayette, LA | 3.0 | 2.0 | 1050 | $900 | $0.86 | 44d | 1 | 1.15mi |
| 313 Saint Thomas St Lafayette, LA | 3.0 | 1.0 | 1265 | $1,500 | $1.19 | 22d | 1 | 1.16mi |
| 816 Martin Luther King Jr Dr Lafayette, LA | 4.0 | 2.0 | 1453 | $1,450 | $1.00 | 22d | 1 | 1.32mi |
| 701 W Taft St #7 Lafayette, LA | 2.0 | 2.5 | 1142 | $1,600 | $1.40 | 44d | 1 | 1.34mi |
| 119 Saint Julien Ave Lafayette, LA | 4.0 | 3.0 | 1600 | $1,785 | $1.12 | 44d | 1 | 1.36mi |
| 126 S Refinery St Lafayette, LA | 4.0 | 2.0 | 1550 | $1,495 | $0.96 | 44d | 1 | 1.39mi |
| 1140 Madeline Ave Lafayette, LA | 4.0 | 1.0 | 1225 | $850 | $0.69 | 44d | 1 | 1.41mi |
| 121 Oakcrest Dr Lafayette, LA | 3.0 | 2.0 | 1695 | $1,700 | $1.00 | 22d | 1 | 1.47mi |
| 104 Whittington Dr Unit C Lafayette, LA | 2.0 | 2.5 | 1265 | $1,695 | $1.34 | 44d | 1 | 1.49mi |
Listing history 20 events
-
2026-06-21days on market $95,000 Active 11 DOM
-
2026-06-18days on market $95,000 Active 8 DOM
-
2026-06-17days on market $95,000 Active 7 DOM
-
2026-06-16days on market $95,000 Active 6 DOM
-
2026-06-15days on market $95,000 Active 5 DOM
-
2026-06-14days on market $95,000 Active 3 DOM
-
2026-06-13remarks 468-char remark
-
2026-06-13pricedays on market $95,000 Active 2 DOM
-
2026-06-01days on market $110,000 Active 94 DOM
-
2026-05-31days on market $110,000 Active 93 DOM
-
2026-05-30days on market $110,000 Active 92 DOM
-
2026-04-29price $110,000 184-char remark
-
2026-04-07price $125,000 184-char remark
-
2026-03-18price $160,000 184-char remark
-
2026-02-27$180,000 Active 184-char remark
-
2009-01-30soldstatus $68,500
-
2008-05-19soldstatus $30,500 49-char remark
Show marketing remark (49 chars)
Sold in ''As is Condition/No Repairs by Seller''.
-
2008-03-31$29,000 49-char remark
Show marketing remark (49 chars)
Sold in ''As is Condition/No Repairs by Seller''.
-
2004-04-29soldstatus $57,000
-
2004-02-18$66,000
ⓘ Source: listings_history table (triggers on properties + properties_extension) + one-shot
backfill from property_details.listing_events for pre-trigger history.
Tax reassessment forecast LA · Resets to sale price
- Current annual tax
- $725 · $60/mo
- Projected year-2 tax
- $725 · $60/mo
- Expected delta
- $0/yr ($0/mo · 0.0%)
ⓘ Screening estimate from a state-policy table — verify with the county assessor before closing.
Climate risk First Street
- Flood 4/10 Moderate FEMA zone X (unshaded) · 22% chance over 30 yrs
- Wildfire 1/10 Low
- Heat 9/10 Extreme 7 d/yr ≥108°F today · 21 d/yr by 30 yrs out
- Wind 9/10 Extreme 99% chance of damaging wind over 30 yrs
- Air quality 2/10 Low 0 unhealthy d/yr today · 1 by 30 yrs out
Nearby sold comps map
Loading sold comps map…
Walkable amenities ~0.75 mi
Loading nearby amenities…
Taxation est. · year 1
- Rental income
- $17,409
- − Mortgage interest
- −$5,321
- − Property taxes
- −$725
- − Insurance
- −$475
- − Repairs & maintenance
- −$1,393
- − Management
- −$1,393
- − Depreciation
- −$2,764
- Taxable income
- $5,339
- Est. tax owed @ 24.0%
- −$1,281
- After-tax cash flow
- $5,294/yr
For passive investors: Depreciation is non-cash, so a rental often shows a tax loss while cash-flowing — sheltering income. Rental losses are passive: they offset passive income freely, and up to $25,000/yr can offset ordinary (W-2) income if you actively participate and your MAGI is under $100k (phasing out to $0 by $150k); unused losses carry forward. On sale, claimed depreciation is recaptured at up to 25%, and gains may owe capital-gains tax (a 1031 exchange can defer both). Figures are a year-1 estimate at your 24.0% rate — not tax advice; consult a CPA.
Schools (NCES district)
- District
- Lafayette Parish
- NCES district ID
- 2200870
- Math proficiency
- 38% ▼ -32.00%
- Reading proficiency
- 46% ▼ -24.00%
- Median HH income
- $50,238
- Composite
- 36.15/100
- National rank
- #4741
- State rank
- #19 of 98 in LA
Livability — Lafayette
- Score
- 70/100
- State rank
- #63
- US rank
- #8133
Category grades
Schools grade is shown separately in the Schools card above.
Census & demographics
- Census place
- Lafayette, LA
- County
- Lafayette Parish · 207,544 people
- City population
- 158,114
- Metro
- Lafayette, LA
- Population (ZIP)
- 26,465
- Household income
- $33,365
- Rent vs Own
- Severe rent burden
- 2089.0
Population outlook (Lafayette County) Hauer SSP2
- Today (2025)
- 280,930 people
- By 2030
- 301,092 · +7.2%
- By 2040
- 339,456 · +20.8%
- By 2050
- 375,156 · +33.5%
- By 2075
- 451,672 · +60.8%
- By 2100
- 497,203 · +77.0%
Race, ethnicity, and origin ACS 2023
- Neighborhood character
- Predominantly Black (73%)
- Race & ethnicity
- Black 73% White 18% Two or more races 6% Hispanic / Latino 4%
- Common ancestry
- Lithuanian 4%
- Foreign-born
- 2% · Canada
- Languages at home
- 95% English-only · Spanish 3% French/Haitian/Cajun 2%
Political lean MEDSL · Lafayette
- 2024 margin
- Solid R (+31.4) · D 33.5% · R 64.8% · Other 1.7%
- 2008→2024 swing
- -0.1pp no change · 2008: -31.3pp · 2024: -31.4pp
- All cycles
- 2024: R+31.4 2020: R+28.7 2016: R+33.6 2012: R+33.7 2008: R+31.3
Not yet ingested
- Civics
- —
Market trends
- HPI YoY
- ▼ -108.63%
- Current HPI
- 81.2963
- Rent YoY
- ▲ 7.35%
- Metro
- Lafayette, LA
- State GDP YoY
- ▲ 3.29%
- F500 in state
- 10
Industry mix (Fortune 500 HQ in LA)
| Industry | F500 HQs | Revenue |
|---|---|---|
| Telecommunications | 2 | $23B |
|
||
| Utilities | 1 | $12B |
|
||
| Wholesale / Distribution | 1 | $5B |
|
||
| Advertising | 1 | $2B |
|
||
Price history
+43.9% since first listed10 events — show timeline
- 2026-06-08 Listed $95,000 AcadianaMLS
- 2026-04-29 Price Changed $110,000 AcadianaMLS
- 2026-04-07 Price Changed $125,000 AcadianaMLS
- 2026-03-18 Price Changed $160,000 AcadianaMLS
- 2026-02-27 Listed $180,000 AcadianaMLS
- 2009-01-30 Sold (Public Records) $68,500 Public Records
- 2008-05-19 Sold (MLS) $30,500 AcadianaMLS
- 2008-03-31 Listed $29,000 AcadianaMLS
- 2004-04-29 Sold (MLS) $57,000 AcadianaMLS
- 2004-02-18 Listed $66,000 AcadianaMLS
Property tax history
+24.6%/yrLatest (2025): $725 · -1.1% YoY. Source: county tax records.
Cash-flow waterfall
monthlySold comps — $/sqft
last 12 mo · ≤1 miLoading sold comps…