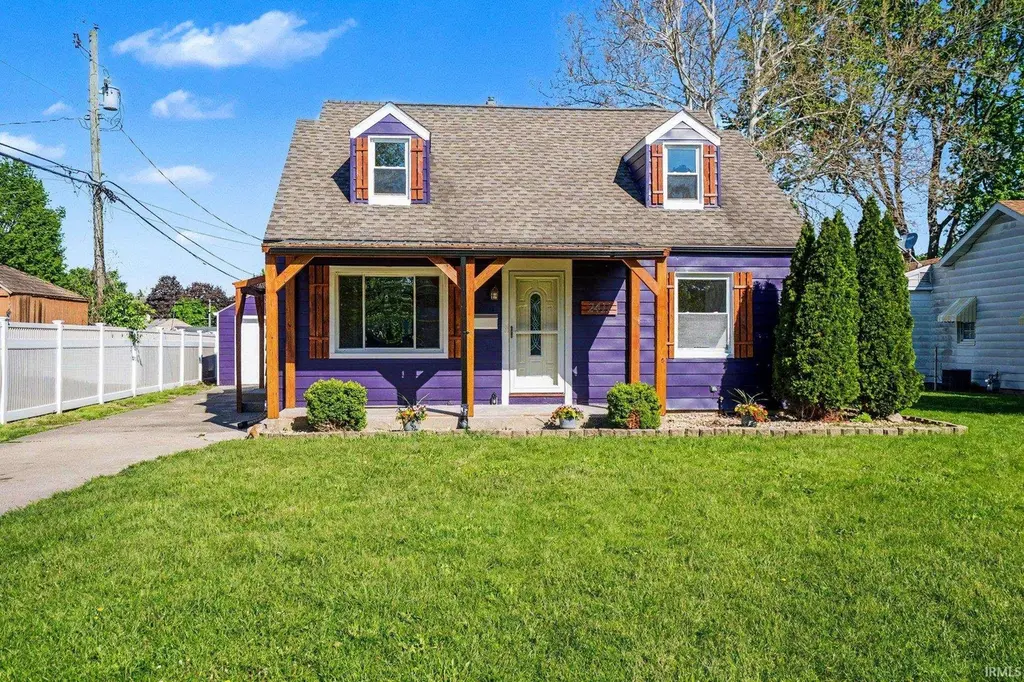
2411 Eisenhower Ave · South Bend, IN
Flood risk 4/10 · Minor
- FEMA flood zone
- X (unshaded)
- Chance of flooding over 30 yrs
- 0.2%
- Est. flood insurance / yr
- $473 – $860
Fire risk 1/10 · Minimal
- Est. fire insurance / yr
- $717 – $1,331
Heat risk 2/10 · Minimal
- Hot days now (above 99°F)
- 7 days/yr
- Hot days in 30 yrs
- 16 days/yr
Wind risk 2/10 · Minimal
- Chance of severe wind over 30 yrs
- —
Air-quality risk 3/10 · Minor
- Unhealthy air days now
- 2 days/yr
- Unhealthy air days in 30 yrs
- 3 days/yr
Risk factors via First Street. Map © Google.
Why this score? — see what drove the C grade
The composite is a weighted blend of 9 inputs, each scored 0–100. Each bar is that input's sub-score; the figure is the points it added to the 100-point composite (weight × sub-score).
- Cash flow +22.0/30.0
- ARV discount +9.8/15.0
- DSCR +7.0/10.0
- 1% rule +5.1/10.0
- Rent growth +4.1/5.0
- Livability +3.2/5.0
- Condition / age +2.5/5.0
- Schools +1.4/10.0
- Appreciation +0.0/10.0
$259,900
🖨 Deal sheet 📄 Offer letter ✓ Due diligence
Listing remarks
Multiple Offers Received - Highest and best offers due by 5:00pm on Sunday, May 10th. Bold on the outside, inviting on the inside! This updated 4-bedroom 2-full-bathroom bungalow with a finished basement in Edison Park is situated less than a mile from Notre Dame and a pitching wedge away from Morris Park Country Club. The backyard is massive and includes a patio with a pergola that will stay with the home. Upstairs is an expansive primary suite, the main floor has 3 bedrooms and the other full bathroom. Schedule your showing today!
Key facts
- Massive backyard
- Finished basement
- Edison park location
Tags
Property features AI
Finance
- Other: Lot is level; Lot dimensions approximately 55 x 206 (0.26 acre); Located in the McKinley Terrace subdivision
- HOA & community: No association amenities
Exterior
- Parking: Detached garage; Concrete driveway/parking; Off-street parking; 1 garage space
- Utilities: Public water; Public sewer
- Home design: Single-family residence (site-built); One story
- Construction: Aluminum siding; Asphalt shingle roof
- Exterior features: Patio; Fenced yard (full); Shed(s); Above-ground private pool
Interior
- Kitchen: Dishwasher; Microwave; Refrigerator; Gas range
- Bedrooms: Master bedroom on main level
- Flooring: Hardwood flooring; Carpet
- Bathrooms: 2 full bathrooms; 1 bathroom on the main level
- Heating & cooling: Central air; Ceiling fans for additional cooling; Natural gas forced-air heating
- Interior features: Breakfast bar; Ceiling fans; Eat-in kitchen; Laminate countertops; Master suite on main level; One fireplace (none specified as functional feature)
- Laundry & utility: Laundry in basement; Full, partially finished basement
Neighborhood map
What this means for you Summary
Snapshot
- This is a 3-bed/1.0-bath single-family listed at $260k.
Deal economics
- At list price, monthly cash flow is $413 ($5k/yr) — positive.
- The deal already cash-flows at list — no discount required.
- Meets the 1% rule at list price ($3k rent vs $260k).
- Cap rate 8.2% vs local median 4.4% in South Bend — top-decile yield for the area; either an underpriced asset or a hidden risk that comps aren't pricing in. Stress-test before assuming the spread holds.
Location & tenants
- Location reads 64/100 on livability (#365 in IN) — a middle-class / working-renter tenant base. Strengths: cost of living A+, housing A+, health & safety A+; Watch: amenities D, employment D, crime F.
- South Bend Community School Corporation (urban): math 12% / reading 21% proficiency, ranked #284 of 301 in IN (top 94%) — low school quality limits family demand, transient renter base, plan for 1-2y turnover; 66% free/reduced lunch — lower-income household profile, screen leases tightly.
- Zoned schools: Nuner Fine Arts Academy (math 8% / reading 12%, grade F, #921 of 994 statewide, top 94%, 479 students, 90% FRL); Jefferson Traditional School (math 12% / reading 22%, grade F, #284 of 330 statewide, top 87%, 516 students, 64% FRL); Adams High School (math 28% / reading 57%, grade F, #195 of 369 statewide, top 53%, 1,976 students, 56% FRL) — zoned schools at 70% FRL track the district average.
- Market conditions: Rents rising fast (+6.3%/yr); 73 active listings in the ZIP; 10 comparable units currently listed for rent nearby; rentals at typical pace (median 21d on market — plan ~3-4 weeks tenant-placement turnaround); 40% of comp listings sitting > 30 days — soft ceiling on asking rent; 754 units permitted in St. Joseph County in 2024 (460 in 5+ unit buildings).
- At $2,618/mo this rent would consume 50% of the median local household income ($63k/yr) (locally 420% of renters already pay >50% of income on rent) — very limited rent-growth headroom before tenants either downsize or default.
Forward outlook
- Local home prices are declining (-3.0%/yr); year-one equity from $2k of loan paydown is wiped out by about $8k of value loss. Plan a longer hold.
- At projected returns (-3.0% appreciation + 6.3% rent growth), your $73k cash investment doubles in ~10 years — after that, you're playing with house money.
Negotiation context
- Only 4 days on market — expect competitive offers; lowballing is unlikely to land.
Risks & watch-outs
- Watch-outs: built in 1948 — expect roof / HVAC / electrical / plumbing capex.
Questions for the listing agent
- Built in 1948 — when were the roof, HVAC, electrical panel, plumbing, and water heater last replaced?
- Is there a deadline driving the sale (1031 exchange, divorce, estate, relocation)? That informs how much negotiation room exists.
- Schools are F-rated, which usually means shorter tenancies and higher turnover. Who's the typical renter profile here, and what's been the actual vacancy rate?
- Crime grade is F in this area — have there been break-ins, vandalism, or insurance claims at this property in the last 3 years? What carrier currently insures it and at what premium?
- What's the average days-on-market for RENTAL listings here right now (not sales)? A rising rental-DOM trend means longer vacancies and softer asking-rent achievability than the comps imply.
- What's the recent tenant-quality profile in this submarket — average credit score on applications, eviction rate, late-payment / NSF rate, and stable-employment percentage? A property-management company in the area should have these aggregated.
- How much new for-sale + rental construction is in the pipeline within 1–3 miles? Heavy new supply typically softens prices + rents 12–24 months out; constrained supply supports both.
Investment metrics
- 1% rule
- 1.01% ✓
- Cap rate
- 8.20%
- Cash-on-cash
- 6.81%
- DSCR
- 1.30
- GRM
- 8.3
CMA / ARV
- ARV (on-the-fly)
- $273,600
- Comps found
- 12
Show comp detail 12 sales within ~0.75 mi
| Address | Dist | Beds/Ba | Sqft | Sold | Price | $/sf | Match |
|---|---|---|---|---|---|---|---|
| 2410 Eisenhower Ave | 0.03mi | 3/2.5 | 1,909 (+6%) | 2mo | $250,000 | $131 | 81 |
| 2403 Corby Blvd | 0.04mi | 4/2.0 (+1) | 1,644 (-9%) | 2mo | $249,000 | $151 | 73 |
| 1703 Corby Blvd | 0.49mi | 3/1.0 | 1,872 (+4%) | 2mo | $350,000 | $187 | 68 |
| 624 Cherry Tree Ln | 0.31mi | 3/3.0 | 1,899 (+6%) | 1mo | $505,500 | $266 | 68 |
| 2514 Edison Rd | 0.43mi | 3/1.5 | 1,640 (-9%) | 2mo | $239,000 | $146 | 62 |
| 2301 Union Ave | 0.29mi | 4/1.5 (+1) | 1,593 (-12%) | 2mo | $235,000 | $148 | 59 |
| 2716 Kettering Dr | 0.52mi | 3/1.0 | 1,578 (-12%) | 1mo | $259,000 | $164 | 54 |
| 1614 Cedar St | 0.67mi | 3/2.0 | 1,952 (+8%) | 1mo | $401,000 | $205 | 50 |
| 1706 Mckinley Ave | 0.72mi | 3/1.5 | 1,970 (+9%) | 1mo | $325,000 | $165 | 48 |
| 834 Woodcliff Dr | 0.48mi | 4/2.0 (+1) | 1,576 (-12%) | 1mo | $240,000 | $152 | 47 |
| 1518 Hass Dr | 0.71mi | 4/2.0 (+1) | 1,680 (-7%) | 2mo | $251,000 | $149 | 45 |
| 1512 Cedar St | 0.73mi | 3/2.0 | 2,044 (+14%) | 2mo | $292,000 | $143 | 38 |
Match score weights: distance 35% · size 25% · config 20% · recency 20%. Top-matched comps best support the ARV.
Projected returns pro-forma
-3.0% appreciation · 6.27% rent growth · sell at horizon
- IRR
- -2.5%
- Equity multiple
- 0.90×
- Total profit
- $-6,966
- Equity at exit
- $38,752
- IRR
- 10.3%
- Equity multiple
- 1.92×
- Total profit
- $66,651
- Equity at exit
- $22,471
Cash invested: $72,772 (down + closing). Projections, not guarantees.
Landlord ↔ Tenant lean methodology
- Overall (STATE)
- 90 Strongly Landlord-Friendly
- State Indiana
- 90 Strongly Landlord-Friendly · R+11
- County
- — inherits STATE
- City
- — inherits STATE
ZIP-level market 46615
- Home prices YoY
- -34.0%
- Rents YoY
- 6.3%
- Active inventory
- 73
- Price-to-rent
- 8.3×
Monthly cashflow live
- Estimated rent
- $2,618 high interval (Pro) →
- Mortgage (P&I)
- −$1,363
- Tax from tax record
- −$184 /mo · $2,208/yr
- Insurance
- −$108
- HOA
- −$0
- Vacancy / Maint / Mgmt
- −$550
- Net cashflow
- $413
Break-even live
UW: 25.0% down · 7.5% · 30yr · 1.5% tax · 5.0% vac · 8.0% maint · 8.0% mgmt
Financing live
Cash to close
- Down payment
- $64,975
- Closing costs
- $7,797
- Reserves months
- —
- Total cash needed
- —
Loan-product check · same deal, 3 products live
Conventional
25% down · 7.5% · 30yr
- Down + closing
- —
- Monthly P&I
- —
- Monthly cashflow
- —
- DSCR
- —
- Eligible?
- —
Personal DTI + credit; lowest rate.
DSCR
20% down · 8.5% · 30yr
- Down + closing
- —
- Monthly P&I
- —
- Monthly cashflow
- —
- DSCR
- —
- Eligible?
- —
No personal income docs; deal must DSCR.
Hard money
10% down · 12.0% · 12mo
- Down + closing
- —
- Monthly P&I
- —
- Monthly cashflow
- —
- DSCR
- —
- Eligible?
- —
Short-term bridge; refi at stabilization.
Rent comps 10 comps
| Address | Beds | Baths | Sqft | Rent | $/sqft | DOM | Units | Dist |
|---|---|---|---|---|---|---|---|---|
| 1824 Peachtree Ln South Bend, IN | 3.0 | 1.5 | 1852 | $2,700 | $1.46 | 21d | 1 | 0.41mi |
| 2121 E Madison St South Bend, IN | 3.0 | 3.0 | 2319 | $4,500 | $1.94 | 43d | 1 | 0.48mi |
| 724 Northwood Dr South Bend, IN | 4.0 | 2.0 | 1594 | $2,600 | $1.63 | 43d | 1 | 0.56mi |
| 1160 Helmen Dr South Bend, IN | 3.0 | 2.0 | 1528 | $2,300 | $1.51 | 13d | 1 | 0.76mi |
| 1752 Willis St South Bend, IN | 4.0 | 4.5 | 2065 | $4,800 | $2.32 | 21d | 1 | 0.86mi |
| 1018 S Bend Ave South Bend, IN | 2.0 | 1.0–2.0 | 836 | $2,950 | $3.53 | 13d | 27 | 1.07mi |
| 1145 N Eddy St South Bend, IN | 3.0 | 1.0–3.0 | 959 | $4,377 | $4.56 | 43d | 1 | 1.15mi |
| 913 E Washington St South Bend, IN | 4.0 | 1.5 | 1312 | $1,295 | $0.99 | 21d | 1 | 1.45mi |
| 819 S 24th St South Bend, IN | 3.0 | 2.0 | 1480 | $1,795 | $1.21 | 43d | 1 | 1.45mi |
| 116 N Notre Dame Ave South Bend, IN | 3.0 | 1.5 | 1524 | $1,295 | $0.85 | 13d | 1 | 1.46mi |
Listing history 2 events
-
2026-05-11status Pending
-
2026-05-07$259,900 Active
ⓘ Source: listings_history table (triggers on properties + properties_extension) + one-shot
backfill from property_details.listing_events for pre-trigger history.
Tax reassessment forecast IN · Partial reset (capped growth)
- Current annual tax
- $2,208 · $184/mo
- Projected year-2 tax
- $2,208 · $184/mo
- Expected delta
- +$1/yr ($0/mo · 0.0%)
ⓘ Screening estimate from a state-policy table — verify with the county assessor before closing.
Climate risk First Street
- Flood 4/10 Moderate FEMA zone X (unshaded) · 20% chance over 30 yrs
- Wildfire 1/10 Low
- Heat 2/10 Low 7 d/yr ≥99°F today · 16 d/yr by 30 yrs out
- Wind 2/10 Low
- Air quality 3/10 Moderate 2 unhealthy d/yr today · 3 by 30 yrs out
Nearby sold comps map
Loading sold comps map…
Walkable amenities ~0.75 mi
Loading nearby amenities…
Taxation est. · year 1
- Rental income
- $31,415
- − Mortgage interest
- −$14,558
- − Property taxes
- −$2,208
- − Insurance
- −$1,300
- − Repairs & maintenance
- −$2,513
- − Management
- −$2,513
- − Depreciation
- −$7,561
- Taxable income
- $762
- Est. tax owed @ 24.0%
- −$183
- After-tax cash flow
- $4,772/yr
For passive investors: Depreciation is non-cash, so a rental often shows a tax loss while cash-flowing — sheltering income. Rental losses are passive: they offset passive income freely, and up to $25,000/yr can offset ordinary (W-2) income if you actively participate and your MAGI is under $100k (phasing out to $0 by $150k); unused losses carry forward. On sale, claimed depreciation is recaptured at up to 25%, and gains may owe capital-gains tax (a 1031 exchange can defer both). Figures are a year-1 estimate at your 24.0% rate — not tax advice; consult a CPA.
Schools (NCES district)
- District
- South Bend Community School Corporation
- NCES district ID
- 1810290
- Math proficiency
- 12% ▼ -10.00%
- Reading proficiency
- 21% ▼ -6.00%
- Median HH income
- $41,935
- Composite
- 14.21/100
- National rank
- #9452
- State rank
- #284 of 301 in IN
Livability — South Bend
- Score
- 64/100
- State rank
- #365
- US rank
- #13730
Category grades
Schools grade is shown separately in the Schools card above.
Census & demographics
- Census place
- South Bend, IN
- County
- Saint Joseph County · 189,048 people
- City population
- 99,767
- Metro
- South Bend-Mishawaka, IN-MI
- Population (ZIP)
- 14,190
- Household income
- $62,964
- Rent vs Own
- Severe rent burden
- 420.0
Population outlook (St. Joseph County) Hauer SSP2
- Today (2025)
- 273,186 people
- By 2030
- 273,594 · +0.1%
- By 2040
- 271,641 · -0.6%
- By 2050
- 269,187 · -1.5%
- By 2075
- 263,136 · -3.7%
- By 2100
- 245,659 · -10.1%
Race, ethnicity, and origin ACS 2023
- Neighborhood character
- Predominantly White (65%)
- Race & ethnicity
- White 65% Black 14% Two or more races 11% Hispanic / Latino 10% Asian 3%
- Hispanic origin (detail)
- Mexican 8%
- Common ancestry
- Romanian 6% Italian 2% Serbian 2%
- Foreign-born
- 8% · Canada, Vietnam
- Languages at home
- 87% English-only · Spanish 7% Tagalog/Filipino 1% Other Indo-European 1%
Political lean MEDSL · St. Joseph
- 2024 margin
- Toss-up / Even · D 50.0% · R 48.5% · Other 1.5%
- 2008→2024 swing
- -15.6pp toward R · 2008: 17.1pp · 2024: 1.5pp
- All cycles
- 2024: D+1.5 2020: D+5.8 2016: D+0.2 2012: D+3.5 2008: D+17.1
Not yet ingested
- Civics
- —
Market trends
- HPI YoY
- ▼ -124.82%
- Current HPI
- 242.1938
- Rent YoY
- ▲ 6.27%
- Metro
- South Bend-Mishawaka, IN-MI
- State GDP YoY
- ▲ 2.90%
- F500 in state
- 18
Industry mix (Fortune 500 HQ in IN)
| Industry | F500 HQs | Revenue |
|---|---|---|
| Industrial Machinery | 2 | $37B |
|
||
| Healthcare | 1 | $177B |
|
||
| Pharmaceuticals | 1 | $45B |
|
||
| Metals / Steel | 1 | $18B |
|
||
| Agriculture | 1 | $17B |
|
||
| Packaging | 1 | $12B |
|
||
Price history
2 events — show timeline
- 2026-05-11 Pending — IRMLS
- 2026-05-07 Listed $259,900 IRMLS
Property tax history
+3.8%/yrLatest (2023): $2,208 · +13.0% YoY. Source: county tax records.
Cash-flow waterfall
monthlySold comps — $/sqft
last 12 mo · ≤1 miLoading sold comps…