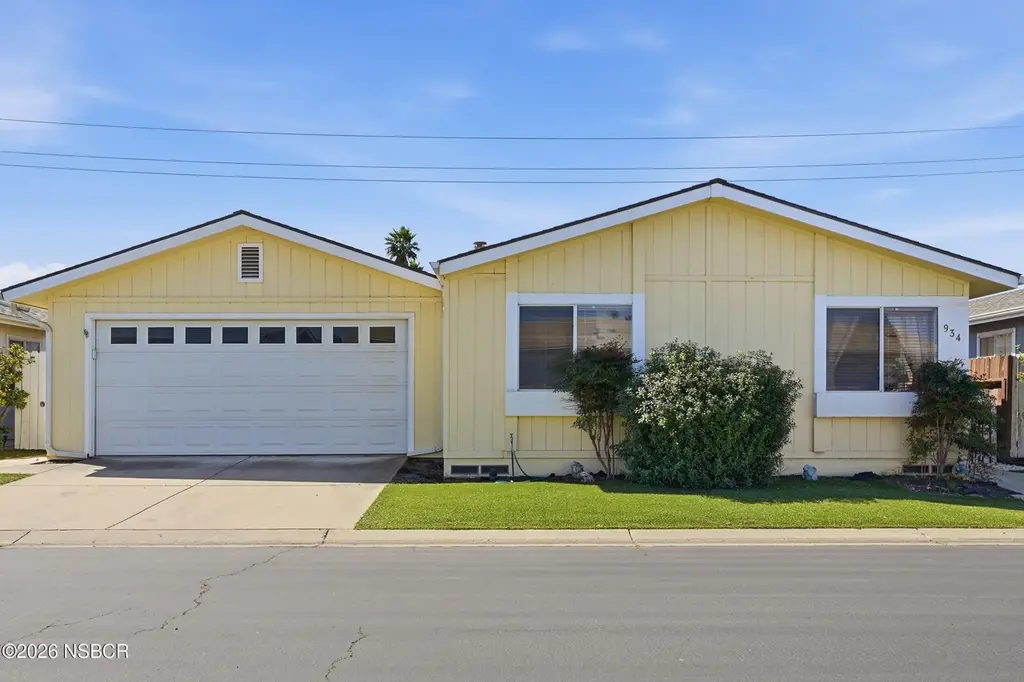
934 Vista Montana · Santa Maria, CA
Flood risk 5/10 · Moderate
- FEMA flood zone
- X (unshaded)
- Chance of flooding over 30 yrs
- 0.24%
- Est. flood insurance / yr
- $507 – $1,088
Fire risk 4/10 · Minor
- Est. fire insurance / yr
- $659 – $1,223
Heat risk 4/10 · Minor
- Hot days now (above 84°F)
- 7 days/yr
- Hot days in 30 yrs
- 17 days/yr
Wind risk 1/10 · Minimal
- Chance of severe wind over 30 yrs
- —
Air-quality risk 6/10 · Moderate
- Unhealthy air days now
- 11 days/yr
- Unhealthy air days in 30 yrs
- 12 days/yr
Risk factors via First Street. Map © Google.
Why this score? — see what drove the F grade
The composite is a weighted blend of 9 inputs, each scored 0–100. Each bar is that input's sub-score; the figure is the points it added to the 100-point composite (weight × sub-score).
- Cash flow +14.1/30.0
- DSCR +4.3/10.0
- Livability +3.6/5.0
- Rent growth +3.1/5.0
- Schools +2.9/10.0
- 1% rule +2.7/10.0
- Condition / age +2.5/5.0
- ARV discount +0.0/15.0
- Appreciation +0.0/10.0
$259,000
🖨 Deal sheet (PDF) 📄 Offer letter ✓ Due diligence
Listing remarks MLS
This beautiful home is in an active senior (55+)gated community. Move-in ready 3Bd/2Bth; master suite has walk-in closet; kitchen has lots of storage; back yard includes fountain in very tranquil setting. Come join the fun with an active clubhouse, swimming, golf, RV parking and much more.
Key facts
- Bonus room
- Ample cabinet space
- Ensuite bathroom
Tags
Property features AI
Finance
- Other: Property located at 934 Vista Montana, Santa Maria, CA; Directions: Railroad to Rancho Buena Vista entry
- HOA & community: Age-restricted community; Land lease approximately $1,160
Exterior
- Parking: Attached 2-car garage
- Utilities: Has heating; Has cooling
- Home design: Manufactured home; Model: Majestic; Make: Hallmark; Dimensions approximately 64' x 24'
- Construction: Manufactured construction
- Exterior features: Rolled composition roof; Pillar/post/pier foundation; Lot approximately 0.04 acres
Interior
- Kitchen: Gas oven/range; Refrigerator
- Bathrooms: 2 full bathrooms
- Heating & cooling: Forced air heating; Ceiling fans for cooling
- Interior features: Living room fireplace
- Laundry & utility: Washer; Dryer
Neighborhood map
What this means for you Summary
Snapshot
- This is a 2-bed/2.0-bath manufactured listed at $259k.
Deal economics
- At list price, monthly cash flow is $40 ($481/yr) — positive.
- The deal already cash-flows at list — no discount required.
- To meet the 1% rule (rent ≥ 1% of price), the offer needs to be $199k (23.2% below list).
- Recommended offer: $199k (23.2% below list) — sets the bar for 1% rule.
- Cap rate 6.5% vs local median 3.5% in Santa Maria — top-decile yield for the area; either an underpriced asset or a hidden risk that comps aren't pricing in. Stress-test before assuming the spread holds.
Location & tenants
- Location reads 71/100 on livability (#202 in CA) — a middle-class / working-renter tenant base. Strengths: amenities A+, commute A+, health & safety A; Watch: crime F, cost of living F.
- Santa Maria-Bonita (urban): math 26% / reading 34% proficiency, ranked #1,023 of 1,400 in CA (top 73%) — families likely to look elsewhere, expect single-tenant / working-renter base with shorter leases; 72% free/reduced lunch — lower-income household profile, screen leases tightly.
- Zoned schools: Ontiveros (Juan Pacifico) Elementary (834 students, 82% FRL); Kunst (Tommie) Junior High (1,030 students, 61% FRL); Pioneer Valley High (3,220 students, 74% FRL) — zoned schools at 72% FRL track the district average.
- Market conditions: Rents rising (+2.3%/yr); 56 active listings in the ZIP; 3 comparable units currently listed for rent nearby; rentals at typical pace (median 16d on market — plan ~3-4 weeks tenant-placement turnaround); solid renter incomes; 719 units permitted in Santa Barbara County in 2024 (217 in 5+ unit buildings).
- This rent runs 32% of the median local income ($75k/yr) — at the standard rent-burdened threshold; future hikes will face affordability resistance.
Forward outlook
- Local home prices are declining (-3.0%/yr); year-one equity from $2k of loan paydown is wiped out by about $8k of value loss. Plan a longer hold.
- Santa Barbara County population projected at +20% by 2050 — long-run rental-demand tailwind backs the buy-and-hold thesis.
Negotiation context
- It's been on market 34 days — a 3% lower offer ($251k) is reasonable based on typical stale-listing flexibility.
- 2 sale attempts since 20y ago with the ask held roughly flat each time — persistent listings suggest the price (not the market) is what's stuck; bring a comps-based counter.
- Current owner paid $155k; list at $259k implies a 67% gain — meaningful room to come down on a strong offer.
Risks & watch-outs
- Climate carrying-cost: moderate flood risk — expect insurance premiums to compound above CPI over the hold.
Questions for the listing agent
- It's been on market 34 days. Have you received any prior offers? Is the seller open to a 23% concession, seller financing, or rate buy-down credit?
- Is there a deadline driving the sale (1031 exchange, divorce, estate, relocation)? That informs how much negotiation room exists.
- Schools are F-rated, which usually means shorter tenancies and higher turnover. Who's the typical renter profile here, and what's been the actual vacancy rate?
- Crime grade is F in this area — have there been break-ins, vandalism, or insurance claims at this property in the last 3 years? What carrier currently insures it and at what premium?
- The area grade is low — what's the realistic commute time and amenity access for the typical tenant pool here? Any planned neighborhood developments (good or bad) we should know about?
- What's the average days-on-market for RENTAL listings here right now (not sales)? A rising rental-DOM trend means longer vacancies and softer asking-rent achievability than the comps imply.
- What's the recent tenant-quality profile in this submarket — average credit score on applications, eviction rate, late-payment / NSF rate, and stable-employment percentage? A property-management company in the area should have these aggregated.
- How much new for-sale + rental construction is in the pipeline within 1–3 miles? Heavy new supply typically softens prices + rents 12–24 months out; constrained supply supports both.
Investment metrics
- 1% rule
- 0.77% ✗
- Cap rate
- 6.48%
- Cash-on-cash
- 0.66%
- DSCR
- 1.03
- GRM
- 10.8
CMA / ARV
- ARV (on-the-fly)
- $212,784
- Comps found
- 12
Show comp detail 12 sales within ~0.75 mi
| Address | Dist | Beds/Ba | Sqft | Sold | Price | $/sf | Match |
|---|---|---|---|---|---|---|---|
| 934 Vista Montana | 0.00mi | 3/2.0 (+1) | 1,536 (+3%) | 1mo | $233,000 | $152 | 89 |
| 2121 NW Via Visalia St | 0.06mi | 3/2.0 (+1) | 1,536 (+3%) | 3mo | $315,000 | $205 | 85 |
| 2148 Avenida Redondo | 0.19mi | 3/2.0 (+1) | 1,536 (+3%) | 6mo | $275,000 | $179 | 76 |
| 820 Vista Del Rio | 0.25mi | 3/2.0 (+1) | 1,536 (+3%) | 4mo | $249,900 | $163 | 74 |
| 519 W Taylor #125 | 0.36mi | 2/2.0 | 1,440 (-3%) | 5mo | $172,000 | $119 | 74 |
| 519 W Taylor St #365 | 0.28mi | 2/2.0 | 1,440 (-3%) | 10mo | $120,000 | $83 | 73 |
| 519 W Taylor St #406 | 0.32mi | 3/2.0 (+1) | 1,416 (-5%) | 3mo | $315,000 | $222 | 70 |
| 519 W Taylor St #232 | 0.37mi | 2/2.0 | 1,440 (-3%) | 10mo | $140,000 | $97 | 69 |
| 519 W Taylor St #371 | 0.32mi | 2/2.0 | 1,620 (+9%) | 6mo | $130,000 | $80 | 66 |
| 519 W 519 W. Taylor St #141 | 0.37mi | 2/2.0 | 1,344 (-10%) | 7mo | $95,000 | $71 | 61 |
| 519 W Taylor St #374 | 0.28mi | 3/2.0 (+1) | 1,344 (-10%) | 7mo | $170,000 | $126 | 60 |
| 519 W Taylor St #26 | 0.41mi | 3/2.0 (+1) | 1,330 (-11%) | 3mo | $190,000 | $143 | 55 |
Match score weights: distance 35% · size 25% · config 20% · recency 20%. Top-matched comps best support the ARV.
Projected returns pro-forma
-3.0% appreciation · 2.31% rent growth · sell at horizon
- IRR
- -16.0%
- Equity multiple
- 0.44×
- Total profit
- $-40,917
- Equity at exit
- $38,618
- IRR
- -8.8%
- Equity multiple
- 0.47×
- Total profit
- $-38,416
- Equity at exit
- $22,394
Cash invested: $72,520 (down + closing). Projections, not guarantees.
Landlord ↔ Tenant lean methodology
- Overall (STATE)
- 18 Strongly Tenant-Friendly
- State California
- 18 Strongly Tenant-Friendly · D+13
- County
- — inherits STATE
- City
- — inherits STATE
ZIP-level market 93458
- Rents YoY
- 2.3%
- Active inventory
- 56
- Price-to-rent
- 10.8×
Monthly cashflow live
- Estimated rent
- $1,989 medium interval (Pro) →
- Mortgage (P&I)
- −$1,358
- Tax from tax record
- −$65 /mo · $784/yr
- Insurance
- −$108
- HOA
- −$0
- Lot rent leased land?
- −$0
- Vacancy / Maint / Mgmt
- −$418
- Net cashflow
- $40
Break-even live
Sensitivity live
| Price | -10% $187 | -5% $113 | +0% $40 | +5% $-33 | +10% $-107 |
|---|---|---|---|---|---|
| Rent | -10% $-117 | -5% $-38 | +0% $40 | +5% $119 | +10% $197 |
| Rate | -1.0pp $171 | -0.5pp $106 | base $40 | +0.5pp $-27 | +1.0pp $-95 |
UW: 25.0% down · 7.5% · 30yr · 1.5% tax · 5.0% vac · 8.0% maint · 8.0% mgmt
Financing live
Cash to close
- Down payment
- $64,750
- Closing costs
- $7,770
- Reserves months
- —
- Total cash needed
- —
Loan-product check · same deal, 3 products live
Conventional
25% down · 7.5% · 30yr
- Down + closing
- —
- Monthly P&I
- —
- Monthly cashflow
- —
- DSCR
- —
- Eligible?
- —
Personal DTI + credit; lowest rate.
DSCR
20% down · 8.5% · 30yr
- Down + closing
- —
- Monthly P&I
- —
- Monthly cashflow
- —
- DSCR
- —
- Eligible?
- —
No personal income docs; deal must DSCR.
Hard money
10% down · 12.0% · 12mo
- Down + closing
- —
- Monthly P&I
- —
- Monthly cashflow
- —
- DSCR
- —
- Eligible?
- —
Short-term bridge; refi at stabilization.
Rent comps 3 comps
| Address | Beds | Baths | Sqft | Rent | $/sqft | DOM | Units | Dist |
|---|---|---|---|---|---|---|---|---|
| 116 E Orchard St Santa Maria, CA | 2.0 | 1.0 | 1004 | $2,850 | $2.84 | 23d | 1 | 1.18mi |
| 715 W Alvin Ave Unit B Santa Maria, CA | 2.0 | 1.5 | 1000 | $2,495 | $2.50 | 16d | 1 | 1.27mi |
| Lynne Dr Santa Maria, CA | 3.0 | 2.5 | 1264 | $3,000 | $2.37 | 16d | 1 | 1.35mi |
Listing history 4 events
-
2026-05-12status Pending
-
2026-04-08$259,000 Active
-
2007-12-28soldstatus $155,000 290-char remark
Show marketing remark (290 chars)
This beautiful home is in an active senior (55+)gated community. Move-in ready 3Bd/2Bth; master suite has walk-in closet; kitchen has lots of storage; back yard includes fountain in very tranquil setting. Come join the fun with an active clubhouse, swimming, golf, RV parking and much more.
-
2006-06-28$168,500 290-char remark
Show marketing remark (290 chars)
This beautiful home is in an active senior (55+)gated community. Move-in ready 3Bd/2Bth; master suite has walk-in closet; kitchen has lots of storage; back yard includes fountain in very tranquil setting. Come join the fun with an active clubhouse, swimming, golf, RV parking and much more.
ⓘ Source: listings_history table (triggers on properties + properties_extension) + one-shot
backfill from property_details.listing_events for pre-trigger history.
Tax reassessment forecast CA · Resets to sale price
- Current annual tax
- $784 · $65/mo
- Projected year-2 tax
- $1,968 · $164/mo
- Expected delta
- +$1,184/yr (+$99/mo · 150.9%)
ⓘ Screening estimate from a state-policy table — verify with the county assessor before closing.
Climate risk First Street
- Flood 5/10 Major FEMA zone X (unshaded) · 24% chance over 30 yrs
- Wildfire 4/10 Moderate
- Heat 4/10 Moderate 7 d/yr ≥84°F today · 17 d/yr by 30 yrs out
- Wind 1/10 Low
- Air quality 6/10 Major 11 unhealthy d/yr today · 12 by 30 yrs out
Nearby sold comps map
Loading sold comps map…
Walkable amenities ~0.75 mi
Loading nearby amenities…
Taxation est. · year 1
- Rental income
- $23,872
- − Mortgage interest
- −$14,508
- − Property taxes
- −$784
- − Insurance
- −$1,295
- − Repairs & maintenance
- −$1,910
- − Management
- −$1,910
- − Depreciation
- −$7,535
- Taxable loss
- −$4,069
- Est. tax savings @ 24.0%
- +$977
- After-tax cash flow
- $1,458/yr
For passive investors: Depreciation is non-cash, so a rental often shows a tax loss while cash-flowing — sheltering income. Rental losses are passive: they offset passive income freely, and up to $25,000/yr can offset ordinary (W-2) income if you actively participate and your MAGI is under $100k (phasing out to $0 by $150k); unused losses carry forward. On sale, claimed depreciation is recaptured at up to 25%, and gains may owe capital-gains tax (a 1031 exchange can defer both). Figures are a year-1 estimate at your 24.0% rate — not tax advice; consult a CPA.
Schools (NCES district)
- District
- Santa Maria-Bonita
- NCES district ID
- 0605580
- Math proficiency
- 26% ▲ 3.00%
- Reading proficiency
- 34% ▲ 3.00%
- Median HH income
- $50,959
- Composite
- 29.11/100
- National rank
- #11891
- State rank
- #1023 of 1400 in CA
Livability — Santa Maria
- Score
- 71/100
- State rank
- #202
- US rank
- #6519
Category grades
Schools grade is shown separately in the Schools card above.
Census & demographics
- Census place
- Santa Maria, CA
- County
- Santa Barbara County · 410,380 people
- City population
- 145,655
- Metro
- Santa Maria-Santa Barbara, CA
- Population (ZIP)
- 59,148
- Household income
- $75,257
- Rent vs Own
- Severe rent burden
- 2583.0
Population outlook (Santa Barbara County) Hauer SSP2
- Today (2025)
- 484,679 people
- By 2030
- 505,323 · +4.3%
- By 2040
- 545,783 · +12.6%
- By 2050
- 584,263 · +20.5%
- By 2075
- 682,586 · +40.8%
- By 2100
- 723,188 · +49.2%
Race, ethnicity, and origin ACS 2023
- Neighborhood character
- Predominantly Hispanic (87%)
- Race & ethnicity
- Hispanic / Latino 87% Two or more races 41% White 8% Asian 4% Native American 4%
- Hispanic origin (detail)
- Mexican 83%
- Common ancestry
- Lithuanian 1%
- Foreign-born
- 40% · Canada, Jamaica
- Languages at home
- 21% English-only · Spanish 72% Tagalog/Filipino 2% Other Asian/Pacific 1%
Political lean MEDSL · Santa Barbara
- 2024 margin
- Strong D (+26.7) · D 61.8% · R 35.1% · Other 3.1%
- 2008→2024 swing
- +3.8pp toward D · 2008: 22.9pp · 2024: 26.7pp
- All cycles
- 2024: D+26.7 2020: D+32.1 2016: D+28.2 2012: D+17.1 2008: D+22.9
Not yet ingested
- Civics
- —
Market trends
- HPI YoY
- ▼ -422.91%
- Current HPI
- 347.9281
- Rent YoY
- ▲ 2.31%
- Metro
- Santa Maria-Santa Barbara, CA
- State GDP YoY
- ▲ 3.21%
- F500 in state
- 116
Industry mix (Fortune 500 HQ in CA)
| Industry | F500 HQs | Revenue |
|---|---|---|
| Technology | 27 | $1,492B |
|
||
| Financial Services | 3 | $174B |
|
||
| Retail | 3 | $44B |
|
||
| Insurance | 3 | $26B |
|
||
| Media / Entertainment | 2 | $115B |
|
||
| Pharmaceuticals / Biotech | 2 | $62B |
|
||
Price history
+53.7% since first listed4 events — show timeline
- 2026-05-12 Pending — NSBCRMLS
- 2026-04-08 Listed $259,000 NSBCRMLS
- 2007-12-28 Sold (MLS) $155,000 NSBCRMLS
- 2006-06-28 Listed $168,500 NSBCRMLS
Property tax history
+2.3%/yrLatest (2025): $784 · +4.7% YoY. Source: county tax records.
Cash-flow waterfall
monthlySold comps — $/sqft
last 12 mo · ≤1 miLoading sold comps…