 🔨 Auction
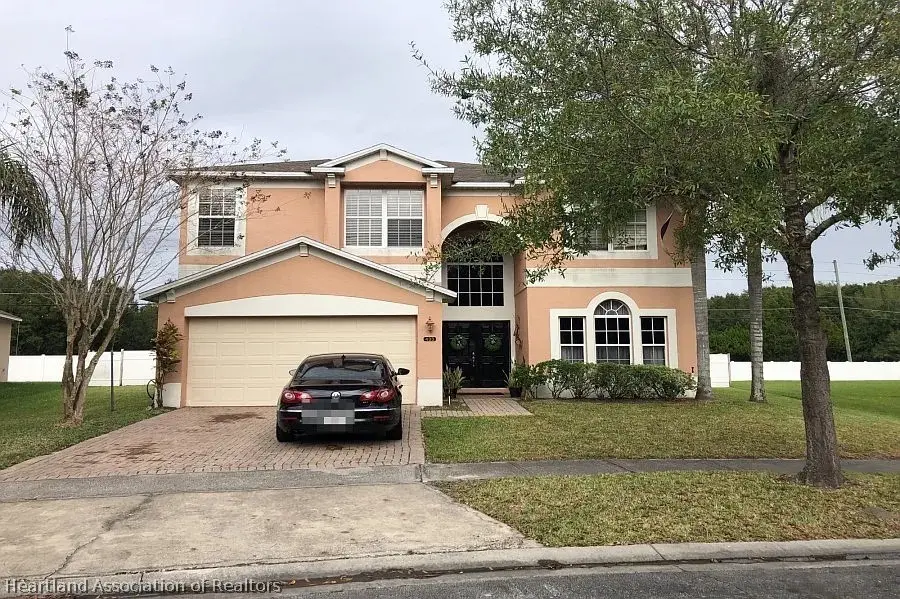
433 Cortona Dr · Alafaya, FL
Flood risk 1/10 · Minimal
- FEMA flood zone
- X (unshaded)
- Chance of flooding over 30 yrs
- 0.0%
- Est. flood insurance / yr
- $507 – $1,088
Fire risk 4/10 · Minor
- Est. fire insurance / yr
- $947 – $1,759
Heat risk 9/10 · Severe
- Hot days now (above 108°F)
- 7 days/yr
- Hot days in 30 yrs
- 23 days/yr
Wind risk 10/10 · Severe
- Chance of severe wind over 30 yrs
- 99.0%
Air-quality risk 2/10 · Minimal
- Unhealthy air days now
- 0 days/yr
- Unhealthy air days in 30 yrs
- 1 days/yr
Risk factors via First Street. Map © Google.
Why this score? — see what drove the F grade
The composite is a weighted blend of 9 inputs, each scored 0–100. Each bar is that input's sub-score; the figure is the points it added to the 100-point composite (weight × sub-score).
- ARV discount +7.5/15.0
- Appreciation +4.8/10.0
- Schools +4.1/10.0
- Livability +4.1/5.0
- Cash flow +3.4/30.0
- Rent growth +2.7/5.0
- Condition / age +2.5/5.0
- 1% rule +0.0/10.0
- DSCR +0.0/10.0
$5,000
🖨 Deal sheet (PDF) 📄 Offer letter ✓ Due diligence
Listing remarks
Foreclosure Auction Ends June 2, 2026 at 11:00 AM EST. Explore this charming 5-bedroom, 4-bath residence set in a peaceful and well-located Orlando community. The list price is the opening bid for the online auction. Sold As-is. Explore more details and submit your bid through Federa Home App.
Key facts
- 0.25 acre lot
- 2 garage spots
- Built 2006
Property features AI
Finance
- Other: Zoning: P-D
Exterior
- Parking: 2-car garage
- Utilities: Other water source; Other sewer
- Home design: Single-family residence; Two levels; Residential property
- Construction: Construction details: See remarks
- Exterior features: Front porch; Other roof
Interior
- Bedrooms: Total rooms: 1
- Flooring: Other
- Bathrooms: 4 full bathrooms
- Heating & cooling: No heating listed
- Interior features: Front porch; Other flooring
Neighborhood map
What this means for you Summary
Snapshot
- This is a 5-bed/4.0-bath single-family listed at $5k.
Deal economics
- At list price, monthly cash flow is $-2k ($-24k/yr) — negative.
- The deal already cash-flows at list — no discount required.
- Meets the 1% rule at list price ($3k rent vs $5k).
- Cap rate 2.6% vs local median 3.5% in Alafaya — below-typical yield; the buyer is paying a premium for something (appreciation thesis, condition, location) that the cap rate doesn't capture.
Location & tenants
- Location reads 82/100 on livability (#60 in FL, #1,076 nationally) — a professional / high-income tenant draw. Strengths: housing A+, health & safety A+, crime A; Watch: cost of living C-, schools D+.
- Orange (suburban): math 46% / reading 51% proficiency, ranked #43 of 73 in FL (top 59%) — families likely to look elsewhere, expect single-tenant / working-renter base with shorter leases.
- Market conditions: Rents flat; 328 active listings in the ZIP; 7 comparable units currently listed for rent nearby; rentals at typical pace (median 19d on market — plan ~3-4 weeks tenant-placement turnaround); solid renter incomes; 8,053 units permitted in Orange County in 2024 (3,133 in 5+ unit buildings).
- This rent runs 38% of the median local income ($102k/yr) — at the standard rent-burdened threshold; future hikes will face affordability resistance.
Forward outlook
- In year one you build about $2k of equity ($5k loan paydown + $-2k appreciation (-0.4% local appreciation)).
- Orange County population projected at +52% by 2050 — long-run rental-demand tailwind backs the buy-and-hold thesis.
- By year 9, paydown + projected appreciation supports a ~$40k cash-out refi (75% LTV) — recoverable capital for the next deal without selling this one.
Negotiation context
- Only 7 days on market — expect competitive offers; lowballing is unlikely to land.
- 8 sale attempts since 19y ago with the ask held roughly flat each time — persistent listings suggest the price (not the market) is what's stuck; bring a comps-based counter.
Risks & watch-outs
- Watch-outs: property tax is 198.9% of price.
- Climate carrying-cost: severe wind risk, 99% chance of damaging wind over 30y; extreme-heat days projected 7→23/yr by 2055 (HVAC capex compounding) — expect insurance premiums to compound above CPI over the hold.
Questions for the listing agent
- What do current leases actually rent for vs. the listed asking? Can we see a recent rent roll and the last 12 months of T-12 income?
- Property tax is high relative to price — has the assessment been appealed recently, and will the sale trigger a re-assessment?
- Is there a deadline driving the sale (1031 exchange, divorce, estate, relocation)? That informs how much negotiation room exists.
- Schools are D-rated, which usually means shorter tenancies and higher turnover. Who's the typical renter profile here, and what's been the actual vacancy rate?
- The area grade is low — what's the realistic commute time and amenity access for the typical tenant pool here? Any planned neighborhood developments (good or bad) we should know about?
- What's the average days-on-market for RENTAL listings here right now (not sales)? A rising rental-DOM trend means longer vacancies and softer asking-rent achievability than the comps imply.
- What's the recent tenant-quality profile in this submarket — average credit score on applications, eviction rate, late-payment / NSF rate, and stable-employment percentage? A property-management company in the area should have these aggregated.
- How much new for-sale + rental construction is in the pipeline within 1–3 miles? Heavy new supply typically softens prices + rents 12–24 months out; constrained supply supports both.
Investment metrics
- 1% rule
- 0.49% ✗
- Cap rate
- 2.63%
- Cash-on-cash
- -13.07%
- DSCR
- 0.42
- GRM
- 17.0
CMA / ARV
- ARV (on-the-fly)
- $662,872
- Comps found
- 1
Show comp detail 1 sale within ~0.75 mi
| Address | Dist | Beds/Ba | Sqft | Sold | Price | $/sf | Match |
|---|---|---|---|---|---|---|---|
| 1077 Fountain Coin Loop | 0.68mi | 4/2.5 (-1) | 2,906 (-14%) | 6mo | $570,000 | $196 | 29 |
Match score weights: distance 35% · size 25% · config 20% · recency 20%. Top-matched comps best support the ARV.
Projected returns pro-forma
-0.37% appreciation · 0.82% rent growth · sell at horizon
- IRR
- -20.3%
- Equity multiple
- 0.10×
- Total profit
- $-166,358
- Equity at exit
- $180,403
- IRR
- -15.0%
- Equity multiple
- -0.42×
- Total profit
- $-263,370
- Equity at exit
- $207,438
Cash invested: $185,604 (down + closing). Projections, not guarantees.
Landlord ↔ Tenant lean methodology
- Overall (STATE)
- 87 Strongly Landlord-Friendly
- State Florida
- 87 Strongly Landlord-Friendly · R+3
- County
- — inherits STATE
- City
- — inherits STATE
ZIP-level market 32828
- Home prices YoY
- -0.1%
- Rents YoY
- 0.8%
- Active inventory
- 328
- Price-to-rent
- 0.1×
Monthly cashflow live
- Estimated rent
- $3,241 high interval (Pro) →
- Mortgage (P&I)
- −$3,476
- Tax est. 1.5%
- −$829 /mo · $9,943/yr
- Insurance
- −$276
- HOA
- −$0
- Vacancy / Maint / Mgmt
- −$681
- Net cashflow
- $-2,021
Break-even live
Sensitivity live
| Price | -10% $-1,563 | -5% $-1,792 | +0% $-2,021 | +5% $-2,250 | +10% $-2,479 |
|---|---|---|---|---|---|
| Rent | -10% $-2,277 | -5% $-2,149 | +0% $-2,021 | +5% $-1,893 | +10% $-1,765 |
| Rate | -1.0pp $-1,687 | -0.5pp $-1,852 | base $-2,021 | +0.5pp $-2,193 | +1.0pp $-2,367 |
UW: 25.0% down · 7.5% · 30yr · 1.5% tax · 5.0% vac · 8.0% maint · 8.0% mgmt
Financing live
Cash to close
- Down payment
- $165,718
- Closing costs
- $19,886
- Reserves months
- —
- Total cash needed
- —
Loan-product check · same deal, 3 products live
Conventional
25% down · 7.5% · 30yr
- Down + closing
- —
- Monthly P&I
- —
- Monthly cashflow
- —
- DSCR
- —
- Eligible?
- —
Personal DTI + credit; lowest rate.
DSCR
20% down · 8.5% · 30yr
- Down + closing
- —
- Monthly P&I
- —
- Monthly cashflow
- —
- DSCR
- —
- Eligible?
- —
No personal income docs; deal must DSCR.
Hard money
10% down · 12.0% · 12mo
- Down + closing
- —
- Monthly P&I
- —
- Monthly cashflow
- —
- DSCR
- —
- Eligible?
- —
Short-term bridge; refi at stabilization.
Rent comps 7 comps
| Address | Beds | Baths | Sqft | Rent | $/sqft | DOM | Units | Dist |
|---|---|---|---|---|---|---|---|---|
| 337 Bella Vida Blvd Orlando, FL | 4.0 | 2.5 | 2528 | $2,895 | $1.15 | 5d | 1 | 0.14mi |
| 337 Bella Vida Blvd Orlando, FL | 4.0 | 3.0 | 2528 | $2,890 | $1.14 | 24d | 1 | 0.14mi |
| 930 Spring Oak Cir Orlando, FL | 4.0 | 3.5 | 2744 | $3,295 | $1.20 | 24d | 1 | 0.77mi |
| 1105 Toluke Pt Orlando, FL | 4.0 | 3.5 | 2543 | $2,800 | $1.10 | 5d | 1 | 0.96mi |
| 1434 Anna Catherine Dr Orlando, FL | 4.0 | 4.0 | 2922 | $3,700 | $1.27 | 18d | 1 | 1.16mi |
| 14912 Faberge Dr Orlando, FL | 5.0 | 4.0 | 3439 | $3,640 | $1.06 | 18d | 1 | 1.42mi |
| 14912 Faberge Dr Orlando, FL | 5.0 | 4.0 | 3439 | $3,640 | $1.06 | 13d | 1 | 1.42mi |
Listing history 23 events
-
2026-06-01days on market $5,000 Active 7 DOM
-
2026-05-31days on market $5,000 Active 6 DOM
-
2026-05-25$5,000 Active
-
2021-04-01status Pending
-
2020-01-08historical
-
2020-01-02$330,000 Active
-
2018-04-11status Pending
-
2018-03-24status Pending
-
2018-03-22status Pending
-
2017-08-17status Pending
-
2017-08-15historical
-
2017-07-14price $303,000
-
2017-07-14status Active
-
2017-02-23status Pending
-
2017-02-23$260,000 Active
-
2014-06-14status Pending
-
2014-06-10historical
-
2014-03-03historical
-
2014-02-11$260,000
-
2010-12-29$180,000
-
2010-12-22historical
-
2010-02-01$189,000
-
2007-07-26$357,000
ⓘ Source: listings_history table (triggers on properties + properties_extension) + one-shot
backfill from property_details.listing_events for pre-trigger history.
Climate risk First Street
- Flood 1/10 Low FEMA zone X (unshaded) · 0% chance over 30 yrs
- Wildfire 4/10 Moderate
- Heat 9/10 Extreme 7 d/yr ≥108°F today · 23 d/yr by 30 yrs out
- Wind 10/10 Extreme 99% chance of damaging wind over 30 yrs
- Air quality 2/10 Low 0 unhealthy d/yr today · 1 by 30 yrs out
Nearby sold comps map
Loading sold comps map…
Walkable amenities ~0.75 mi
Loading nearby amenities…
Taxation est. · year 1
- Rental income
- $38,888
- − Mortgage interest
- −$37,131
- − Property taxes
- −$9,943
- − Insurance
- −$3,314
- − Repairs & maintenance
- −$3,111
- − Management
- −$3,111
- − Depreciation
- −$19,284
- Taxable loss
- −$37,006
- Est. tax savings @ 24.0%
- +$8,882
- After-tax cash flow
- $-15,369/yr
For passive investors: Depreciation is non-cash, so a rental often shows a tax loss while cash-flowing — sheltering income. Rental losses are passive: they offset passive income freely, and up to $25,000/yr can offset ordinary (W-2) income if you actively participate and your MAGI is under $100k (phasing out to $0 by $150k); unused losses carry forward. On sale, claimed depreciation is recaptured at up to 25%, and gains may owe capital-gains tax (a 1031 exchange can defer both). Figures are a year-1 estimate at your 24.0% rate — not tax advice; consult a CPA.
Schools (NCES district)
- District
- Orange
- NCES district ID
- 1201440
- Math proficiency
- 46% ▼ -9.00%
- Reading proficiency
- 51% ▼ -2.00%
- Median HH income
- $49,350
- Composite
- 41.47/100
- National rank
- #3461
- State rank
- #43 of 73 in FL
Livability — Alafaya
- Score
- 82/100
- State rank
- #60
- US rank
- #1076
Category grades
Schools grade is shown separately in the Schools card above.
Census & demographics
- Census place
- Alafaya, FL
- County
- Orange County · 1,471,359 people
- City population
- 131,972
- Metro
- Orlando-Kissimmee-Sanford, FL
- Population (ZIP)
- 69,202
- Household income
- $101,767
- Rent vs Own
- Severe rent burden
- 2213.0
Population outlook (Orange County) Hauer SSP2
- Today (2025)
- 1,618,226 people
- By 2030
- 1,787,404 · +10.5%
- By 2040
- 2,125,621 · +31.4%
- By 2050
- 2,454,016 · +51.6%
- By 2075
- 3,173,711 · +96.1%
- By 2100
- 3,607,781 · +122.9%
Race, ethnicity, and origin ACS 2023
- Neighborhood character
- Diverse neighborhood (Simpson 0.67)
- Race & ethnicity
- White 42% Hispanic / Latino 37% Two or more races 23% Black 9% Asian 7%
- Hispanic origin (detail)
- Mexican 1% Puerto Rican 19% Cuban 4% Dominican 3%
- Common ancestry
- Slovak 2% Romanian 1% Lithuanian 1%
- Foreign-born
- 20% · Canada, Jamaica, Vietnam
- Languages at home
- 63% English-only · Spanish 27% Other Indo-European 3% Arabic 1%
Political lean MEDSL · Orange
- 2024 margin
- D (+13.6) · D 56.1% · R 42.5% · Other 1.3%
- 2008→2024 swing
- -5.0pp toward R · 2008: 18.6pp · 2024: 13.6pp
- All cycles
- 2024: D+13.6 2020: D+23.1 2016: D+24.6 2012: D+18.2 2008: D+18.6
Not yet ingested
- Civics
- —
Market trends
- HPI YoY
- ▼ -0.37%
- Current HPI
- 284.5182
- Rent YoY
- ▲ 0.82%
- Metro
- Orlando-Kissimmee-Sanford, FL
- State GDP YoY
- ▲ 3.28%
- F500 in state
- 36
Industry mix (Fortune 500 HQ in FL)
| Industry | F500 HQs | Revenue |
|---|---|---|
| Industrial Technology | 2 | $29B |
|
||
| Insurance | 2 | $17B |
|
||
| Retail | 1 | $60B |
|
||
| Technology Distribution | 1 | $58B |
|
||
| Homebuilding | 1 | $35B |
|
||
| Technology Manufacturing | 1 | $35B |
|
||
Price history
-98.6% since first listed21 events — show timeline
- 2026-05-25 Listed $5,000 HAOR as distributed by MLS GRID
- 2021-04-01 Pending — Stellar MLS as Distributed by MLS Grid
- 2020-01-08 Listing Removed — Stellar MLS as Distributed by MLS Grid
- 2020-01-02 Listed $330,000 Stellar MLS as Distributed by MLS Grid
- 2018-04-11 Pending — Stellar MLS as Distributed by MLS Grid
- 2018-03-24 Pending — Stellar MLS as Distributed by MLS Grid
- 2018-03-22 Pending — Stellar MLS as Distributed by MLS Grid
- 2017-08-17 Pending — Stellar MLS as Distributed by MLS Grid
- 2017-08-15 Listing Removed — Stellar MLS as Distributed by MLS Grid
- 2017-07-14 Price Changed $303,000 Stellar MLS as Distributed by MLS Grid
- 2017-07-14 Relisted — Stellar MLS as Distributed by MLS Grid
- 2017-02-23 Pending — Stellar MLS as Distributed by MLS Grid
- 2017-02-23 Listed $260,000 Stellar MLS as Distributed by MLS Grid
- 2014-06-14 Pending — Stellar MLS as Distributed by MLS Grid
- 2014-06-10 Listing Removed — Stellar MLS as Distributed by MLS Grid
- 2014-03-03 Listing Removed — Stellar MLS as Distributed by MLS Grid
- 2014-02-11 Listed $260,000 Stellar MLS as Distributed by MLS Grid
- 2010-12-29 Listed $180,000 Stellar MLS as Distributed by MLS Grid
- 2010-12-22 Listing Removed — Stellar MLS as Distributed by MLS Grid
- 2010-02-01 Listed $189,000 Stellar MLS as Distributed by MLS Grid
- 2007-07-26 Listed $357,000 Stellar MLS as Distributed by MLS Grid
Property tax history
+6.4%/yrLatest (2025): $9,525 · +6.3% YoY. Source: county tax records.
Cash-flow waterfall
monthlySold comps — $/sqft
last 12 mo · ≤1 miLoading sold comps…