306 W Cedar St · Bertrand, MO
Flood risk 1/10 · Minimal
- FEMA flood zone
- X (shaded)
- Chance of flooding over 30 yrs
- 0.0%
- Est. flood insurance / yr
- $507 – $1,088
Fire risk 1/10 · Minimal
- Est. fire insurance / yr
- $1,054 – $1,958
Heat risk 6/10 · Moderate
- Hot days now (above 109°F)
- 7 days/yr
- Hot days in 30 yrs
- 21 days/yr
Wind risk 3/10 · Minor
- Chance of severe wind over 30 yrs
- 6.0%
Air-quality risk 2/10 · Minimal
- Unhealthy air days now
- 0 days/yr
- Unhealthy air days in 30 yrs
- 1 days/yr
Risk factors via First Street. Map © Google.
Why this score? — see what drove the C grade
The composite is a weighted blend of 9 inputs, each scored 0–100. Each bar is that input's sub-score; the figure is the points it added to the 100-point composite (weight × sub-score).
- Cash flow +22.9/30.0
- ARV discount +7.5/15.0
- DSCR +7.3/10.0
- 1% rule +6.0/10.0
- Appreciation +5.8/10.0
- Livability +2.8/5.0
- Rent growth +2.5/5.0
- Schools +1.3/10.0
- Condition / age +1.0/5.0
$75,000
🖨 Deal sheet 📄 Offer letter ✓ Due diligence
Listing remarks MLS
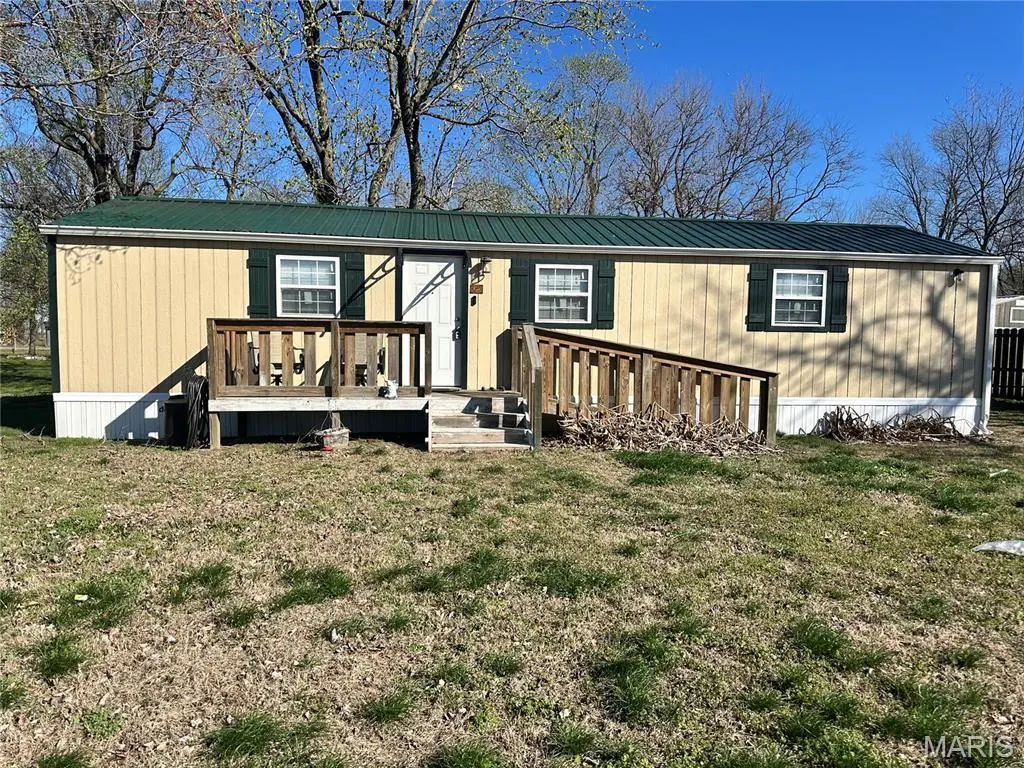
Welcome to this charming 2023 manufactured home located in the peaceful town of Bertrand, MO. This 1-bedroom, 1-bath home offers 768 square feet of efficient, low-maintenance living—perfect for a first-time buyer, downsizer, or investment opportunity.
Key facts
- 9,583 sq ft lot
- Built 2023
- Listed 91 days
Neighborhood map
What this means for you Summary
Snapshot
- This is a 1-bed/1.0-bath manufactured listed at $75k. Condition is rated poor.
Deal economics
- At list price, monthly cash flow is $131 ($2k/yr) — positive.
- The deal already cash-flows at list — no discount required.
- Meets the 1% rule at list price ($822 rent vs $75k).
- Recommended offer: $68k (9.0% below list) — sets the bar for market timing.
Location & tenants
- Location reads 55/100 on livability (#748 in MO) — a working-class tenant base; expect higher turnover. Strengths: cost of living A+, housing A+; Watch: employment D, schools F, crime F.
- Charleston R-I (town): math 11% / reading 23% proficiency, ranked #310 of 324 in MO (top 96%) — low school quality limits family demand, transient renter base, plan for 1-2y turnover; 78% free/reduced lunch — lower-income household profile, screen leases tightly.
- Market conditions: 11 active listings in the ZIP; 7 units permitted in Mississippi County in 2024 (0 in 5+ unit buildings).
Forward outlook
- In year one you build about $2k of equity ($519 loan paydown + $1k appreciation (1.7% local appreciation)).
- Mississippi County population projected to shrink 9% by 2050 — rents likely to lag national; underwrite the cash flow, not the appreciation.
- At projected returns (1.7% appreciation + 3.0% rent growth), your $21k cash investment doubles in ~6 years — after that, you're playing with house money.
Negotiation context
- It's been on market 92 days — a 9% lower offer ($68k) is reasonable based on typical stale-listing flexibility.
Risks & watch-outs
- Climate carrying-cost: extreme-heat days projected 7→21/yr by 2055 (HVAC capex compounding) — expect insurance premiums to compound above CPI over the hold.
Questions for the listing agent
- It's been on market 92 days. Have you received any prior offers? Is the seller open to a 9% concession, seller financing, or rate buy-down credit?
- Have any recent inspections been done? Can we get a copy of the seller's disclosures and any deferred-maintenance estimates?
- Why hasn't it sold? Are there any deal-killer items the seller is aware of (foundation, flood, title, zoning, code violations)?
- Is there a deadline driving the sale (1031 exchange, divorce, estate, relocation)? That informs how much negotiation room exists.
- Schools are F-rated, which usually means shorter tenancies and higher turnover. Who's the typical renter profile here, and what's been the actual vacancy rate?
- Crime grade is F in this area — have there been break-ins, vandalism, or insurance claims at this property in the last 3 years? What carrier currently insures it and at what premium?
- What's the average days-on-market for RENTAL listings here right now (not sales)? A rising rental-DOM trend means longer vacancies and softer asking-rent achievability than the comps imply.
- What's the recent tenant-quality profile in this submarket — average credit score on applications, eviction rate, late-payment / NSF rate, and stable-employment percentage? A property-management company in the area should have these aggregated.
- How much new for-sale + rental construction is in the pipeline within 1–3 miles? Heavy new supply typically softens prices + rents 12–24 months out; constrained supply supports both.
Investment metrics
- 1% rule
- 1.10% ✓
- Cap rate
- 8.39%
- Cash-on-cash
- 7.50%
- DSCR
- 1.33
- GRM
- 7.6
CMA / ARV
No comps found within radius.
Projected returns pro-forma
1.66% appreciation · 3.0% rent growth · sell at horizon
- IRR
- 11.0%
- Equity multiple
- 1.58×
- Total profit
- $12,226
- Equity at exit
- $28,207
- IRR
- 14.2%
- Equity multiple
- 2.84×
- Total profit
- $38,648
- Equity at exit
- $39,587
Cash invested: $21,000 (down + closing). Projections, not guarantees.
Landlord ↔ Tenant lean methodology
- Overall (STATE)
- 81 Strongly Landlord-Friendly
- State Missouri
- 81 Strongly Landlord-Friendly · R+10
- County
- — inherits STATE
- City
- — inherits STATE
ZIP-level market 63823
- Home prices YoY
- 1.8%
- Active inventory
- 11
- Price-to-rent
- 7.6×
Monthly cashflow live
- Estimated rent
- $822 medium interval (Pro) →
- Mortgage (P&I)
- −$393
- Tax est. 1.5%
- −$94 /mo · $1,125/yr
- Insurance
- −$31
- HOA
- −$0
- Vacancy / Maint / Mgmt
- −$173
- Net cashflow
- $131
Break-even live
UW: 25.0% down · 7.5% · 30yr · 1.5% tax · 5.0% vac · 8.0% maint · 8.0% mgmt
Financing live
Cash to close
- Down payment
- $18,750
- Closing costs
- $2,250
- Reserves months
- —
- Total cash needed
- —
Loan-product check · same deal, 3 products live
Conventional
25% down · 7.5% · 30yr
- Down + closing
- —
- Monthly P&I
- —
- Monthly cashflow
- —
- DSCR
- —
- Eligible?
- —
Personal DTI + credit; lowest rate.
DSCR
20% down · 8.5% · 30yr
- Down + closing
- —
- Monthly P&I
- —
- Monthly cashflow
- —
- DSCR
- —
- Eligible?
- —
No personal income docs; deal must DSCR.
Hard money
10% down · 12.0% · 12mo
- Down + closing
- —
- Monthly P&I
- —
- Monthly cashflow
- —
- DSCR
- —
- Eligible?
- —
Short-term bridge; refi at stabilization.
Listing history 16 events
-
2026-06-18days on market $75,000 Active 92 DOM
-
2026-06-17days on market $75,000 Active 91 DOM
-
2026-06-16days on market $75,000 Active 90 DOM
-
2026-06-15days on market $75,000 Active 89 DOM
-
2026-06-13days on market $75,000 Active 87 DOM
-
2026-06-12days on market $75,000 Active 86 DOM
-
2026-06-09days on market $75,000 Active 83 DOM
-
2026-06-08days on market $75,000 Active 82 DOM
-
2026-06-07days on market $75,000 Active 81 DOM
-
2026-06-05days on market $75,000 Active 79 DOM
-
2026-06-04days on market $75,000 Active 77 DOM
-
2026-06-02days on market $75,000 Active 76 DOM
-
2026-06-01days on market $75,000 Active 75 DOM
-
2026-05-31days on market $75,000 Active 74 DOM
-
2026-04-13price $75,000 257-char remark
Show marketing remark (257 chars)
Welcome to this charming 2023 manufactured home located in the peaceful town of Bertrand, MO. This 1-bedroom, 1-bath home offers 768 square feet of efficient, low-maintenance living—perfect for a first-time buyer, downsizer, or investment opportunity.
-
2026-03-18$90,000 Active 257-char remark
Show marketing remark (257 chars)
Welcome to this charming 2023 manufactured home located in the peaceful town of Bertrand, MO. This 1-bedroom, 1-bath home offers 768 square feet of efficient, low-maintenance living—perfect for a first-time buyer, downsizer, or investment opportunity.
ⓘ Source: listings_history table (triggers on properties + properties_extension) + one-shot
backfill from property_details.listing_events for pre-trigger history.
Climate risk First Street
- Flood 1/10 Low FEMA zone X (shaded) · 0% chance over 30 yrs
- Wildfire 1/10 Low
- Heat 6/10 Major 7 d/yr ≥109°F today · 21 d/yr by 30 yrs out
- Wind 3/10 Moderate 6% chance of damaging wind over 30 yrs
- Air quality 2/10 Low 0 unhealthy d/yr today · 1 by 30 yrs out
Nearby sold comps map
Loading sold comps map…
Walkable amenities ~0.75 mi
Loading nearby amenities…
Taxation est. · year 1
- Rental income
- $9,868
- − Mortgage interest
- −$4,201
- − Property taxes
- −$1,125
- − Insurance
- −$375
- − Repairs & maintenance
- −$789
- − Management
- −$789
- − Depreciation
- −$2,182
- Taxable income
- $406
- Est. tax owed @ 24.0%
- −$97
- After-tax cash flow
- $1,478/yr
For passive investors: Depreciation is non-cash, so a rental often shows a tax loss while cash-flowing — sheltering income. Rental losses are passive: they offset passive income freely, and up to $25,000/yr can offset ordinary (W-2) income if you actively participate and your MAGI is under $100k (phasing out to $0 by $150k); unused losses carry forward. On sale, claimed depreciation is recaptured at up to 25%, and gains may owe capital-gains tax (a 1031 exchange can defer both). Figures are a year-1 estimate at your 24.0% rate — not tax advice; consult a CPA.
Condition & rehab AI · 5 photos
This manufactured home requires extensive repairs and updates to improve its condition and value. Significant work is needed in the kitchen, bathroom, roof, exterior, flooring, paint, windows, foundation, HVAC, and landscaping.
Repairs flagged
- Major Kitchen appliances — Old and worn
- Major Bathroom fixtures — Outdated and possibly non-functional
- Major Roof — Old and weathered
- Major Exterior siding — Peeling and damaged
- Major Flooring — Worn and damaged
- Major Paint — Chipped and worn
- Major Windows — Old and possibly non-functional
- Major Foundation — Unstable
- Major HVAC unit — Old and possibly non-functional
Value-add opportunities
- Resale New kitchen appliances — Modern appliances will attract buyers
- Resale New bathroom fixtures — Up-to-date fixtures will appeal to buyers
- Resale New roof — A new roof will improve the home's curb appeal and value
- Resale New exterior siding — New siding will improve the home's curb appeal and value
- Resale New flooring — New flooring will improve the home's curb appeal and value
- Resale New paint — New paint will improve the home's curb appeal and value
- Resale New windows — New windows will improve the home's curb appeal and value
- Resale Stabilize foundation — A stable foundation will improve the home's value
- Resale New HVAC unit — A new HVAC unit will improve the home's comfort and value
- Resale Landscaping — Improved landscaping will enhance the home's curb appeal and value
Renovation cost estimate screening
| Repair item | Severity | Est. cost |
|---|---|---|
| Kitchen appliances · Old and worn | Major | $15,000–50,000 |
| Bathroom fixtures · Outdated and possibly non-functional | Major | $15,000–50,000 |
| Roof · Old and weathered | Major | $15,000–50,000 |
| Exterior siding · Peeling and damaged | Major | $15,000–50,000 |
| Flooring · Worn and damaged | Major | $15,000–50,000 |
| Paint · Chipped and worn | Major | $15,000–50,000 |
| Windows · Old and possibly non-functional | Major | $15,000–50,000 |
| Foundation · Unstable | Major | $15,000–50,000 |
| HVAC unit · Old and possibly non-functional | Major | $15,000–50,000 |
| Total estimated repair cost · 9 items | $135,000–450,000 |
Value-add ROI direction
- Resale New kitchen appliances — Modern appliances will attract buyers ↑
- Resale New bathroom fixtures — Up-to-date fixtures will appeal to buyers ↑
- Resale New roof — A new roof will improve the home's curb appeal and value ↑
- Resale New exterior siding — New siding will improve the home's curb appeal and value ↑
- Resale New flooring — New flooring will improve the home's curb appeal and value ↑
- Resale New paint — New paint will improve the home's curb appeal and value ↑
- Resale New windows — New windows will improve the home's curb appeal and value ↑
- Resale Stabilize foundation — A stable foundation will improve the home's value ↑
- Resale New HVAC unit — A new HVAC unit will improve the home's comfort and value ↑
- Resale Landscaping — Improved landscaping will enhance the home's curb appeal and value ↑
ⓘ Cost ranges are severity-bucket heuristics (US national rule-of-thumb). Get contractor quotes + a written scope before underwriting a rehab budget.
Schools (NCES district)
- District
- Charleston R-I
- NCES district ID
- 2908670
- Math proficiency
- 11% ▲ 2.00%
- Reading proficiency
- 23% ▼ -1.00%
- Median HH income
- $29,019
- Composite
- 13.37/100
- National rank
- #9531
- State rank
- #310 of 324 in MO
Livability — Bertrand
- Score
- 55/100
- State rank
- #748
- US rank
- #23403
Category grades
Schools grade is shown separately in the Schools card above.
Census & demographics
- Census place
- Bertrand, MO
- Population (ZIP)
- 1,431
Population outlook (Mississippi County) Hauer SSP2
- Today (2025)
- 13,403 people
- By 2030
- 13,101 · -2.3%
- By 2040
- 12,626 · -5.8%
- By 2050
- 12,233 · -8.7%
- By 2075
- 10,704 · -20.1%
- By 2100
- 8,345 · -37.7%
Race, ethnicity, and origin ACS 2023
- Neighborhood character
- Predominantly White (84%)
- Race & ethnicity
- White 84% Two or more races 10% Hispanic / Latino 5% Black 4%
- Common ancestry
- Iranian 2% Romanian 2% Serbian 1%
- Languages at home
- 99% English-only · French/Haitian/Cajun 1%
Political lean MEDSL · Mississippi
- 2024 margin
- Solid R (+53.7) · D 22.8% · R 76.5%
- 2008→2024 swing
- -39.0pp toward R · 2008: -14.7pp · 2024: -53.7pp
- All cycles
- 2024: R+53.7 2020: R+49.6 2016: R+41.5 2012: R+23.2 2008: R+14.7
Not yet ingested
- Civics
- —
Market trends
- HPI YoY
- ▲ 1.66%
- Current HPI
- 92.5943
- Rent YoY
- —
- Metro
- —
- State GDP YoY
- ▲ 1.84%
- F500 in state
- 20
Industry mix (Fortune 500 HQ in MO)
| Industry | F500 HQs | Revenue |
|---|---|---|
| Healthcare | 1 | $163B |
|
||
| Insurance | 1 | $21B |
|
||
| Industrial Technology | 1 | $17B |
|
||
| Retail | 1 | $16B |
|
||
| Industrial Distribution | 1 | $10B |
|
||
| Utilities | 1 | $9B |
|
||
Price history
-16.7% since first listed2 events — show timeline
- 2026-04-13 Price Changed $75,000 MARIS as Distributed by MLS Grid
- 2026-03-18 Listed $90,000 MARIS as Distributed by MLS Grid
Cash-flow waterfall
monthlySold comps — $/sqft
last 12 mo · ≤1 miLoading sold comps…