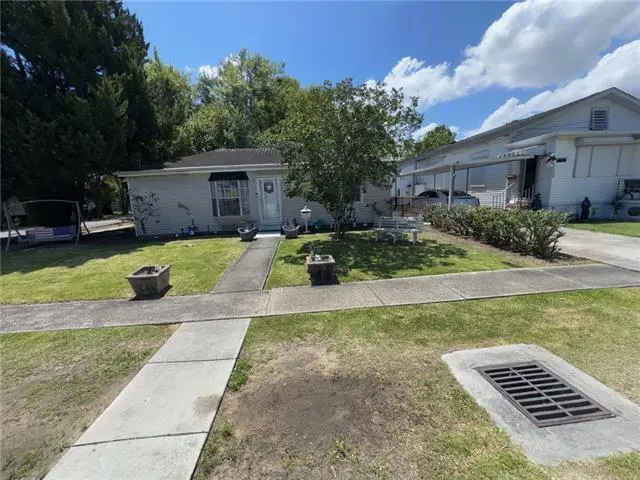
918 Perry St · Gretna, LA
Flood risk No data
- FEMA flood zone
- —
- Chance of flooding over 30 yrs
- —
- Est. flood insurance / yr
- —
Fire risk No data
- Est. fire insurance / yr
- —
Heat risk No data
- Hot days now (above threshold)
- —
- Hot days in 30 yrs
- —
Wind risk No data
- Chance of severe wind over 30 yrs
- —
Air-quality risk No data
- Unhealthy air days now
- —
- Unhealthy air days in 30 yrs
- —
Risk factors via First Street. Map © Google.
Why this score? — see what drove the B- grade
The composite is a weighted blend of 9 inputs, each scored 0–100. Each bar is that input's sub-score; the figure is the points it added to the 100-point composite (weight × sub-score).
- Cash flow +30.0/30.0
- 1% rule +10.0/10.0
- DSCR +10.0/10.0
- ARV discount +7.5/15.0
- Livability +3.5/5.0
- Rent growth +2.5/5.0
- Schools +2.5/10.0
- Condition / age +2.5/5.0
- Appreciation +0.0/10.0
$125,000
🖨 Deal sheet 📄 Offer letter ✓ Due diligence
Listing remarks MLS
FIXER UPPER - HANDYMAN SPECIAL LOCATED IN CITY OF GRETNA- CASH SALE ONLY NO FINANCING CONTINGENCIES. CORNER LOT HAS POTENTIAL BUT NEEDS LOTS OF EVERYTHING.
Key facts
- 9,374 sq ft lot
- Parking
- Built 1967
Property features AI
Exterior
- Parking: Carport with space for one vehicle
- Utilities: Public water; Public sewer
- Home design: Single-story; Frame construction with aluminum siding; Asphalt shingle roof; Slab foundation
- Exterior features: Fence; Shed(s); Corner lot; City lot; Rectangular lot; Lot dimensions approximately 50 x 120
Interior
- Bathrooms: 2 full bathrooms
- Heating & cooling: Central heating; Central air conditioning
- Interior features: Average condition; Total of 8 rooms
Neighborhood map
What this means for you Summary
Snapshot
- This is a 3-bed/2.0-bath single-family listed at $125k.
Deal economics
- At list price, monthly cash flow is $691 ($8k/yr) — positive.
- The deal already cash-flows at list — no discount required.
- Meets the 1% rule at list price ($2k rent vs $125k).
- Cap rate 12.9% vs local median 5.1% in Gretna — top-decile yield for the area; either an underpriced asset or a hidden risk that comps aren't pricing in. Stress-test before assuming the spread holds.
Location & tenants
- Location reads 70/100 on livability (#58 in LA) — a middle-class / working-renter tenant base. Strengths: cost of living A+, health & safety A+, schools B+; Watch: crime F, employment D-.
- Jefferson Parish (suburban): math 24% / reading 34% proficiency, ranked #44 of 98 in LA (top 45%) — low school quality limits family demand, transient renter base, plan for 1-2y turnover; 70% free/reduced lunch — lower-income household profile, screen leases tightly.
- Market conditions: 113 active listings in the ZIP; 40 comparable units currently listed for rent nearby; rentals at typical pace (median 24d on market — plan ~3-4 weeks tenant-placement turnaround); lower-income renter base — watch delinquency; 518 units permitted in Jefferson Parish in 2024 (43 in 5+ unit buildings).
- At $1,918/mo this rent would consume 58% of the median local household income ($40k/yr) (locally 1911% of renters already pay >50% of income on rent) — very limited rent-growth headroom before tenants either downsize or default.
Forward outlook
- Local home prices are declining (-3.0%/yr); year-one equity from $864 of loan paydown is wiped out by about $4k of value loss. Plan a longer hold.
- At projected returns (-3.0% appreciation + 3.0% rent growth), your $35k cash investment doubles in ~6 years — after that, you're playing with house money.
Negotiation context
- Only 1 days on market — expect competitive offers; lowballing is unlikely to land.
- 2 sale attempts with the ask held roughly flat each time — persistent listings suggest the price (not the market) is what's stuck; bring a comps-based counter.
Questions for the listing agent
- Built in 1967 — when were the roof, HVAC, electrical panel, plumbing, and water heater last replaced?
- Is there a deadline driving the sale (1031 exchange, divorce, estate, relocation)? That informs how much negotiation room exists.
- Schools are B-rated — typically a magnet for longer-tenancy family renters. What's the average tenant stay here, and is there a school-zone premium baked into asking?
- Crime grade is F in this area — have there been break-ins, vandalism, or insurance claims at this property in the last 3 years? What carrier currently insures it and at what premium?
- What's the average days-on-market for RENTAL listings here right now (not sales)? A rising rental-DOM trend means longer vacancies and softer asking-rent achievability than the comps imply.
- What's the recent tenant-quality profile in this submarket — average credit score on applications, eviction rate, late-payment / NSF rate, and stable-employment percentage? A property-management company in the area should have these aggregated.
- How much new for-sale + rental construction is in the pipeline within 1–3 miles? Heavy new supply typically softens prices + rents 12–24 months out; constrained supply supports both.
Investment metrics
- 1% rule
- 1.53% ✓
- Cap rate
- 12.93%
- Cash-on-cash
- 23.70%
- DSCR
- 2.05
- GRM
- 5.4
CMA / ARV
- ARV (on-the-fly)
- $263,872
- Comps found
- 11
Show comp detail 11 sales within ~0.75 mi
| Address | Dist | Beds/Ba | Sqft | Sold | Price | $/sf | Match |
|---|---|---|---|---|---|---|---|
| 918 Perry St | 0.00mi | 3/2.0 | 1,736 (0%) | 0mo | $80,000 | $46 | 100 |
| 441 Hancock St | 0.27mi | 3/2.0 | 1,730 (-0%) | 10mo | $380,000 | $220 | 78 |
| 800 Hancock St | 0.02mi | 3/1.0 | 1,873 (+8%) | 15mo | $190,000 | $101 | 70 |
| 1105 Jefferson St | 0.41mi | 3/2.0 | 1,656 (-5%) | 9mo | $399,000 | $241 | 65 |
| 1401 Jefferson St | 0.56mi | 3/2.0 | 1,700 (-2%) | 9mo | $309,500 | $182 | 63 |
| 1104 Monroe St | 0.28mi | 2/2.0 (-1) | 1,550 (-11%) | 10mo | $235,000 | $152 | 56 |
| 1600 Bodenger Blvd | 0.58mi | 3/2.5 | 1,558 (-10%) | 1mo | $102,000 | $65 | 53 |
| 714 Americus St | 0.21mi | 3/1.5 | 1,565 (-10%) | 22mo | $359,000 | $229 | 53 |
| 421 Hamilton St | 0.60mi | 3/2.0 | 1,642 (-5%) | 15mo | $369,835 | $225 | 50 |
| 2033 Evergreen Ave | 0.28mi | 4/1.0 (+1) | 1,860 (+7%) | 23mo | $70,000 | $38 | 47 |
| 1321 Pacific Ave | 0.72mi | 3/1.5 | 1,520 (-12%) | 8mo | $60,000 | $39 | 37 |
Match score weights: distance 35% · size 25% · config 20% · recency 20%. Top-matched comps best support the ARV.
Projected returns pro-forma
-3.0% appreciation · 3.0% rent growth · sell at horizon
- IRR
- 16.8%
- Equity multiple
- 1.68×
- Total profit
- $23,767
- Equity at exit
- $18,638
- IRR
- 25.4%
- Equity multiple
- 3.21×
- Total profit
- $77,395
- Equity at exit
- $10,808
Cash invested: $35,000 (down + closing). Projections, not guarantees.
Landlord ↔ Tenant lean methodology
- Overall (STATE)
- 90 Strongly Landlord-Friendly
- State Louisiana
- 90 Strongly Landlord-Friendly · R+12
- County
- — inherits STATE
- City
- — inherits STATE
ZIP-level market 70053
- Active inventory
- 113
- Price-to-rent
- 5.4×
Monthly cashflow live
- Estimated rent
- $1,918 high interval (Pro) →
- Mortgage (P&I)
- −$656
- Tax from tax record
- −$116 /mo · $1,398/yr
- Insurance
- −$52
- HOA
- −$0
- Vacancy / Maint / Mgmt
- −$403
- Net cashflow
- $691
Break-even live
UW: 25.0% down · 7.5% · 30yr · 1.5% tax · 5.0% vac · 8.0% maint · 8.0% mgmt
Financing live
Cash to close
- Down payment
- $31,250
- Closing costs
- $3,750
- Reserves months
- —
- Total cash needed
- —
Loan-product check · same deal, 3 products live
Conventional
25% down · 7.5% · 30yr
- Down + closing
- —
- Monthly P&I
- —
- Monthly cashflow
- —
- DSCR
- —
- Eligible?
- —
Personal DTI + credit; lowest rate.
DSCR
20% down · 8.5% · 30yr
- Down + closing
- —
- Monthly P&I
- —
- Monthly cashflow
- —
- DSCR
- —
- Eligible?
- —
No personal income docs; deal must DSCR.
Hard money
10% down · 12.0% · 12mo
- Down + closing
- —
- Monthly P&I
- —
- Monthly cashflow
- —
- DSCR
- —
- Eligible?
- —
Short-term bridge; refi at stabilization.
Rent comps 40 comps
| Address | Beds | Baths | Sqft | Rent | $/sqft | DOM | Units | Dist |
|---|---|---|---|---|---|---|---|---|
| 1010 Isbell St Gretna, LA | 3.0 | 1.0 | 1300 | $1,350 | $1.04 | 44d | 1 | 0.09mi |
| 1318 Monroe St Gretna, LA | 2.0 | 1.0 | 1200 | $1,595 | $1.33 | 3d | 1 | 0.41mi |
| 513 Park Blvd New Orleans, LA | 3.0 | 2.0 | 1600 | $2,300 | $1.44 | 3d | 1 | 0.60mi |
| 400 Park Blvd Unit A New Orleans, LA | 4.0 | 1.5 | 1275 | $2,200 | $1.73 | 24d | 1 | 0.65mi |
| 913 Milton St Gretna, LA | 3.0 | 1.0 | 1061 | $2,800 | $2.64 | 44d | 1 | 0.68mi |
| 718 Majestic Pl New Orleans, LA | 3.0 | 2.0 | 1164 | $1,785 | $1.53 | 21d | 1 | 0.69mi |
| 2320 Mardi Gras Blvd New Orleans, LA | 4.0 | 2.5 | 1600 | $2,500 | $1.56 | 2d | 1 | 0.79mi |
| 14 Gelbke Dr Gretna, LA | 3.0 | 2.0 | 1327 | $1,950 | $1.47 | 44d | 1 | 0.81mi |
| 14 Gelbke Dr Gretna, LA | 3.0 | 2.0 | 1327 | $1,800 | $1.36 | 24d | 1 | 0.81mi |
| 1414 Sumner St New Orleans, LA | 3.0 | 2.0 | 1800 | $1,450 | $0.81 | 16d | 1 | 0.89mi |
| 1140 Teche St Apt B New Orleans, LA | 3.0 | 1.0 | 1100 | $1,850 | $1.68 | 24d | 1 | 0.90mi |
| 606 Drum St New Orleans, LA | 3.0 | 2.0 | 1131 | $2,350 | $2.08 | 24d | 1 | 0.90mi |
| 1402 Behrman Ave New Orleans, LA | 2.0 | 1.0 | 1673 | $1,500 | $0.90 | 24d | 1 | 0.94mi |
| 507 Newton St New Orleans, LA | 2.0 | 2.0 | 1150 | $1,400 | $1.22 | 24d | 1 | 1.00mi |
| 1684 Lauradale Dr New Orleans, LA | 4.0 | 2.0 | 1571 | $2,000 | $1.27 | 24d | 1 | 1.00mi |
| 1108 Sumner St New Orleans, LA | 3.0 | 1.5 | 1197 | $1,500 | $1.25 | 12d | 1 | 1.07mi |
| 433 Homer St Unit 1 New Orleans, LA | 4.0 | 2.0 | 1570 | $1,850 | $1.18 | 24d | 1 | 1.07mi |
| 729 Elmira Ave New Orleans, LA | 4.0 | 2.0 | 2000 | $2,000 | $1.00 | 16d | 1 | 1.17mi |
| 612 Fried St Gretna, LA | 3.0 | 2.0 | 1250 | $1,600 | $1.28 | 44d | 1 | 1.17mi |
| 807 Whitney Ave Unit 1 New Orleans, LA | 3.0 | 2.0 | 1262 | $1,500 | $1.19 | 3d | 1 | 1.18mi |
| 1107 S Peters St #101 New Orleans, LA | 2.0 | 2.5 | 1454 | $3,700 | $2.54 | 16d | 1 | 1.22mi |
| 1719 Pace Blvd New Orleans, LA | 3.0 | 1.0 | 1178 | $2,000 | $1.70 | 12d | 1 | 1.23mi |
| 1774 Pace Blvd New Orleans, LA | 4.0 | 2.5 | 1574 | $2,000 | $1.27 | 24d | 1 | 1.25mi |
| 1107 S Peters St #101 New Orleans, LA | 2.0 | 2.5 | 1454 | $3,700 | $2.54 | 44d | 1 | 1.27mi |
| 1420 Annunciation St New Orleans, LA | 1.0–3.0 | 1.0–2.0 | 1019 | $2,390 | $2.35 | 2d | 78 | 1.30mi |
| 23 New England Ct Gretna, LA | 3.0 | 1.5 | 1200 | $1,600 | $1.33 | 24d | 1 | 1.30mi |
| 1555 Chippewa St New Orleans, LA | 2.0 | 1.5 | 1100 | $2,000 | $1.82 | 24d | 1 | 1.30mi |
| 543 Atlantic Ave New Orleans, LA | 2.0 | 2.5 | 1430 | $2,200 | $1.54 | 24d | 1 | 1.31mi |
| 527 Atlantic Ave New Orleans, LA | 3.0 | 2.0 | 1800 | $2,050 | $1.14 | 24d | 1 | 1.33mi |
| 241 Helen St Unit 3c Terrytown, LA | 2.0 | 1.5 | 1383 | $1,400 | $1.01 | 21d | 1 | 1.33mi |
| 241 Helen St Unit 4D Terrytown, LA | 2.0 | 1.5 | 1383 | $1,400 | $1.01 | 44d | 1 | 1.33mi |
| 500 Powder St Unit B New Orleans, LA | 2.0 | 1.0 | 1085 | $1,600 | $1.47 | 24d | 1 | 1.34mi |
| 1417 Annunciation St Unit 1417 New Orleans, LA | 3.0 | 2.0 | 1200 | $1,996 | $1.66 | 21d | 1 | 1.34mi |
| 701 Behrman Ave New Orleans, LA | 3.0 | 2.0 | 1368 | $2,300 | $1.68 | 3d | 1 | 1.35mi |
| 909 Race St New Orleans, LA | 2.0 | 1.5 | 1375 | $2,100 | $1.53 | 16d | 1 | 1.35mi |
| 721 Hinyub Ave Unit D Gretna, LA | 2.0 | 1.5 | 1200 | $1,250 | $1.04 | 44d | 1 | 1.36mi |
| 1050 Annunciation St Unit 1272355P New Orleans, LA | 2.0–5.0 | 2.0–4.0 | 1544 | $2,489 | $1.61 | 3d | 3 | 1.36mi |
| 921 Race St Unit C New Orleans, LA | 3.0 | 2.0 | 1570 | $3,000 | $1.91 | 10d | 1 | 1.36mi |
| 300 Terry Pkwy Unit C Terrytown, LA | 3.0 | 2.5 | 1532 | $1,800 | $1.17 | 24d | 1 | 1.36mi |
| 1325 Annunciation St New Orleans, LA | 1.0–2.0 | 1.0–2.0 | 933 | $2,655 | $2.84 | 2d | 13 | 1.37mi |
Listing history 6 events
-
2026-05-12status Pending 155-char remark
Show marketing remark (155 chars)
FIXER UPPER - HANDYMAN SPECIAL LOCATED IN CITY OF GRETNA- CASH SALE ONLY NO FINANCING CONTINGENCIES. CORNER LOT HAS POTENTIAL BUT NEEDS LOTS OF EVERYTHING.
-
2026-05-12status Pending
Show marketing remark (155 chars)
FIXER UPPER - HANDYMAN SPECIAL LOCATED IN CITY OF GRETNA- CASH SALE ONLY NO FINANCING CONTINGENCIES. CORNER LOT HAS POTENTIAL BUT NEEDS LOTS OF EVERYTHING.
-
2026-04-22$125,000 Active 155-char remark
Show marketing remark (155 chars)
FIXER UPPER - HANDYMAN SPECIAL LOCATED IN CITY OF GRETNA- CASH SALE ONLY NO FINANCING CONTINGENCIES. CORNER LOT HAS POTENTIAL BUT NEEDS LOTS OF EVERYTHING.
-
2026-04-22$125,000 Active
Show marketing remark (155 chars)
FIXER UPPER - HANDYMAN SPECIAL LOCATED IN CITY OF GRETNA- CASH SALE ONLY NO FINANCING CONTINGENCIES. CORNER LOT HAS POTENTIAL BUT NEEDS LOTS OF EVERYTHING.
-
2011-11-08soldstatus
-
1980-07-01soldstatus
ⓘ Source: listings_history table (triggers on properties + properties_extension) + one-shot
backfill from property_details.listing_events for pre-trigger history.
Tax reassessment forecast LA · Resets to sale price
- Current annual tax
- $1,398 · $116/mo
- Projected year-2 tax
- $1,398 · $116/mo
- Expected delta
- $0/yr ($0/mo · 0.0%)
ⓘ Screening estimate from a state-policy table — verify with the county assessor before closing.
Nearby sold comps map
Loading sold comps map…
Walkable amenities ~0.75 mi
Loading nearby amenities…
Taxation est. · year 1
- Rental income
- $23,016
- − Mortgage interest
- −$7,002
- − Property taxes
- −$1,398
- − Insurance
- −$625
- − Repairs & maintenance
- −$1,841
- − Management
- −$1,841
- − Depreciation
- −$3,636
- Taxable income
- $6,672
- Est. tax owed @ 24.0%
- −$1,601
- After-tax cash flow
- $6,692/yr
For passive investors: Depreciation is non-cash, so a rental often shows a tax loss while cash-flowing — sheltering income. Rental losses are passive: they offset passive income freely, and up to $25,000/yr can offset ordinary (W-2) income if you actively participate and your MAGI is under $100k (phasing out to $0 by $150k); unused losses carry forward. On sale, claimed depreciation is recaptured at up to 25%, and gains may owe capital-gains tax (a 1031 exchange can defer both). Figures are a year-1 estimate at your 24.0% rate — not tax advice; consult a CPA.
Schools (NCES district)
- District
- Jefferson Parish
- NCES district ID
- 2200840
- Math proficiency
- 24% ▼ -36.00%
- Reading proficiency
- 34% ▼ -30.00%
- Median HH income
- $48,421
- Composite
- 25.19/100
- National rank
- #7511
- State rank
- #44 of 98 in LA
Livability — Gretna
- Score
- 70/100
- State rank
- #58
- US rank
- #7679
Category grades
Schools grade is shown separately in the Schools card above.
Census & demographics
- Census place
- Gretna, LA
- County
- Jefferson Parish · 426,999 people
- City population
- 56,969
- Metro
- New Orleans-Metairie, LA
- Population (ZIP)
- 16,621
- Household income
- $39,950
- Rent vs Own
- Severe rent burden
- 1911.0
Population outlook (Jefferson County) Hauer SSP2
- Today (2025)
- 451,696 people
- By 2030
- 455,451 · +0.8%
- By 2040
- 458,308 · +1.5%
- By 2050
- 461,031 · +2.1%
- By 2075
- 476,351 · +5.5%
- By 2100
- 499,377 · +10.6%
Race, ethnicity, and origin ACS 2023
- Neighborhood character
- Diverse neighborhood (Simpson 0.70)
- Race & ethnicity
- White 36% Black 34% Hispanic / Latino 23% Two or more races 15% Asian 2%
- Hispanic origin (detail)
- Mexican 4% Cuban 2%
- Common ancestry
- Lithuanian 7% Iranian 1% Slovak 1%
- Foreign-born
- 19% · Canada, Vietnam, China
- Languages at home
- 76% English-only · Spanish 20% Vietnamese 1% German/W. Germanic 1%
Political lean MEDSL · Jefferson
- 2024 margin
- R (+12.9) · D 42.5% · R 55.5% · Other 2.1%
- 2008→2024 swing
- +13.6pp toward D · 2008: -26.6pp · 2024: -12.9pp
- All cycles
- 2024: R+12.9 2020: R+11.1 2016: R+14.8 2012: R+18.4 2008: R+26.6
Not yet ingested
- Civics
- —
Market trends
- HPI YoY
- ▼ -115.90%
- Current HPI
- 121.765
- Rent YoY
- —
- Metro
- New Orleans-Metairie, LA
- State GDP YoY
- ▲ 3.29%
- F500 in state
- 10
Industry mix (Fortune 500 HQ in LA)
| Industry | F500 HQs | Revenue |
|---|---|---|
| Telecommunications | 2 | $23B |
|
||
| Utilities | 1 | $12B |
|
||
| Wholesale / Distribution | 1 | $5B |
|
||
| Advertising | 1 | $2B |
|
||
Price history
+0.0% since first listed6 events — show timeline
- 2026-05-12 Pending — AcadianaMLS
- 2026-05-12 Pending — GSREIN
- 2026-04-22 Listed $125,000 GSREIN
- 2026-04-22 Listed $125,000 AcadianaMLS
- 2011-11-08 Sold (Public Records) — Public Records
- 1980-07-01 Sold (Public Records) — Public Records
Property tax history
+3.2%/yrLatest (2025): $1,398 · -0.2% YoY. Source: county tax records.
Cash-flow waterfall
monthlySold comps — $/sqft
last 12 mo · ≤1 miLoading sold comps…