 Multi-family
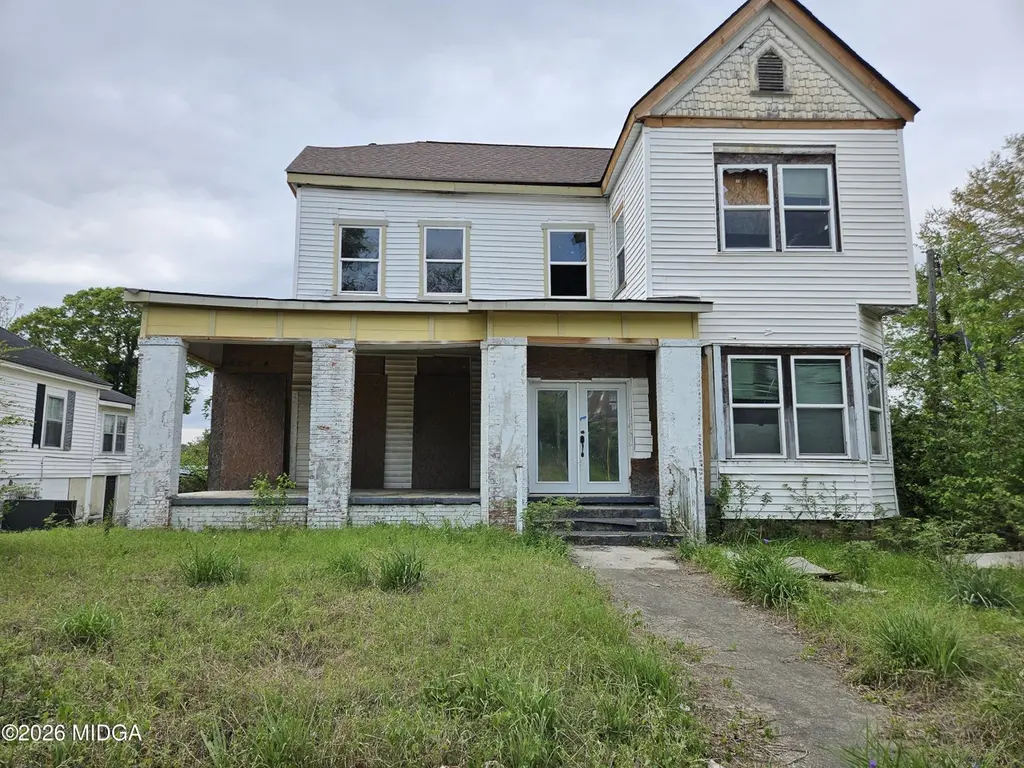
353 Madison St · Macon-Bibb County, GA
Flood risk 1/10 · Minimal
- FEMA flood zone
- X (unshaded)
- Chance of flooding over 30 yrs
- 0.0%
- Est. flood insurance / yr
- $507 – $1,088
Fire risk 1/10 · Minimal
- Est. fire insurance / yr
- $963 – $1,789
Heat risk 7/10 · Major
- Hot days now (above 108°F)
- 7 days/yr
- Hot days in 30 yrs
- 18 days/yr
Wind risk 6/10 · Moderate
- Chance of severe wind over 30 yrs
- 63.0%
Air-quality risk 4/10 · Minor
- Unhealthy air days now
- 5 days/yr
- Unhealthy air days in 30 yrs
- 5 days/yr
Risk factors via First Street. Map © Google.
Why this score? — see what drove the D grade
The composite is a weighted blend of 9 inputs, each scored 0–100. Each bar is that input's sub-score; the figure is the points it added to the 100-point composite (weight × sub-score).
- Cash flow +15.0/30.0
- ARV discount +7.5/15.0
- 1% rule +5.0/10.0
- DSCR +5.0/10.0
- Rent growth +3.3/5.0
- Livability +2.5/5.0
- Condition / age +2.5/5.0
- Schools +1.2/10.0
- Appreciation +0.0/10.0
$59,900
🖨 Deal sheet (PDF) 📄 Offer letter ✓ Due diligence
Multi-family units
County records classify this as Multi-Family (2-4 Unit). Listing-text estimate: 1 unit. estimate disagrees with records
Listing remarks
Great opportunity to revive a Triplex in Macon! This property is convenient to downtown and Mercer University. Turn this fixer upper into the cash flow maxing property that it can truly be. Sold As-Is
Key facts
- 6,969 sq ft lot
- Built 1890
- Listed 20 days
Property features AI
Exterior
- Parking: Other parking
- Utilities: Other water source
- Home design: Single-family residence; Two-story
- Construction: Built on an other-type foundation
- Exterior features: No listed exterior features; Lot approximately 0.16 acres (70 x 97)
Interior
- Bathrooms: 3 full bathrooms
- Heating & cooling: No heating; No cooling
- Interior features: Two total rooms
Neighborhood map
What this means for you Summary
Snapshot
- This is a 3-bed/3.0-bath multifamily listed at $60k.
Deal economics
- At list price, monthly cash flow is $2k ($28k/yr) — positive.
- The deal already cash-flows at list — no discount required.
- Meets the 1% rule at list price ($4k rent vs $60k).
- Recommended offer: $59k (1.5% below list) — sets the bar for market timing.
- Cap rate 53.1% vs local median 5.4% in Macon-Bibb County — top-decile yield for the area; either an underpriced asset or a hidden risk that comps aren't pricing in. Stress-test before assuming the spread holds.
Location & tenants
- Location reads: area grade D — affects rentability + tenant quality, not the cash-flow math above.
- Bibb County (urban): math 11% / reading 18% proficiency, ranked #161 of 174 in GA (top 92%) — low school quality limits family demand, transient renter base, plan for 1-2y turnover; 75% free/reduced lunch — lower-income household profile, screen leases tightly.
- Market conditions: Rents rising (+3.1%/yr); 74 active listings in the ZIP; 5 comparable units currently listed for rent nearby; rentals lingering (median 45d on market — plan ~5-8 weeks vacancy on turnover, expect pricing pressure); 60% of comp listings sitting > 30 days — soft ceiling on asking rent; lower-income renter base — watch delinquency; 154 units permitted in Bibb County in 2024 (0 in 5+ unit buildings).
- At $3,574/mo this rent would consume 146% of the median local household income ($29k/yr) (locally 1124% of renters already pay >50% of income on rent) — very limited rent-growth headroom before tenants either downsize or default.
Forward outlook
- Local home prices are declining (-3.0%/yr); year-one equity from $414 of loan paydown is wiped out by about $2k of value loss. Plan a longer hold.
- Bibb County population projected at -12% by 2050 — secular population decline; favor cash flow + early exit over multi-decade hold.
- At projected returns (-3.0% appreciation + 3.1% rent growth), your $17k cash investment doubles in ~1 year — after that, you're playing with house money.
Negotiation context
- It's been on market 21 days — a 2% lower offer ($59k) is reasonable based on typical stale-listing flexibility.
- 3 sale attempts with the ask held roughly flat each time — persistent listings suggest the price (not the market) is what's stuck; bring a comps-based counter.
- Current owner paid $37k; list at $60k implies a 62% gain — meaningful room to come down on a strong offer.
Risks & watch-outs
- Watch-outs: property tax is 3.0% of price; built in 1890 — expect roof / HVAC / electrical / plumbing capex.
- Climate carrying-cost: major wind risk, 63% chance of damaging wind over 30y; extreme-heat days projected 7→18/yr by 2055 (HVAC capex compounding) — expect insurance premiums to compound above CPI over the hold.
Questions for the listing agent
- Built in 1890 — when were the roof, HVAC, electrical panel, plumbing, and water heater last replaced?
- Property tax is high relative to price — has the assessment been appealed recently, and will the sale trigger a re-assessment?
- Is there a deadline driving the sale (1031 exchange, divorce, estate, relocation)? That informs how much negotiation room exists.
- The area grade is low — what's the realistic commute time and amenity access for the typical tenant pool here? Any planned neighborhood developments (good or bad) we should know about?
- What's the average days-on-market for RENTAL listings here right now (not sales)? A rising rental-DOM trend means longer vacancies and softer asking-rent achievability than the comps imply.
- What's the recent tenant-quality profile in this submarket — average credit score on applications, eviction rate, late-payment / NSF rate, and stable-employment percentage? A property-management company in the area should have these aggregated.
- How much new apartment / multifamily construction is in the pipeline within 1–3 miles? Heavy new supply (>2% of stock underway) typically softens rents 12–24 months out; light construction supports rent growth.
Investment metrics
- 1% rule
- 5.97% ✓
- Cap rate
- 53.07%
- Cash-on-cash
- 167.05%
- DSCR
- 8.43
- GRM
- 1.4
CMA / ARV
No comps found within radius.
Projected returns pro-forma
-3.0% appreciation · 3.11% rent growth · sell at horizon
- IRR
- —
- Equity multiple
- 9.32×
- Total profit
- $139,496
- Equity at exit
- $8,931
- IRR
- —
- Equity multiple
- 19.78×
- Total profit
- $314,987
- Equity at exit
- $5,179
Cash invested: $16,772 (down + closing). Projections, not guarantees.
Landlord ↔ Tenant lean methodology
- Overall (STATE)
- 90 Strongly Landlord-Friendly
- State Georgia
- 90 Strongly Landlord-Friendly · R+3
- County
- — inherits STATE
- City
- — inherits STATE
ZIP-level market 31201
- Rents YoY
- 3.1%
- Active inventory
- 74
- Price-to-rent
- 4.2×
Monthly cashflow live
- Estimated rent
- $3,574 high interval (Pro) →
- Mortgage (P&I)
- −$314
- Tax from tax record
- −$150 /mo · $1,795/yr
- Insurance
- −$25
- HOA
- −$0
- Vacancy / Maint / Mgmt
- −$751
- Net cashflow
- $2,335
Break-even live
Sensitivity live
| Price | -10% $2,369 | -5% $2,352 | +0% $2,335 | +5% $2,318 | +10% $2,301 |
|---|---|---|---|---|---|
| Rent | -10% $2,052 | -5% $2,194 | +0% $2,335 | +5% $2,476 | +10% $2,617 |
| Rate | -1.0pp $2,365 | -0.5pp $2,350 | base $2,335 | +0.5pp $2,319 | +1.0pp $2,304 |
3-unit breakdown (identical units grouped — click to expand)
| Units | Beds | Baths | Est. rent |
|---|---|---|---|
| 3× units | 3 | 3 | $3,573 |
| #1 | 3 | 3 | $1,191 |
| #2 | 3 | 3 | $1,191 |
| #3 | 3 | 3 | $1,191 |
| Total (3 units) | $3,574 | ||
UW: 25.0% down · 7.5% · 30yr · 1.5% tax · 5.0% vac · 8.0% maint · 8.0% mgmt
Financing live
Cash to close
- Down payment
- $14,975
- Closing costs
- $1,797
- Reserves months
- —
- Total cash needed
- —
Loan-product check · same deal, 3 products live
Conventional
25% down · 7.5% · 30yr
- Down + closing
- —
- Monthly P&I
- —
- Monthly cashflow
- —
- DSCR
- —
- Eligible?
- —
Personal DTI + credit; lowest rate.
DSCR
20% down · 8.5% · 30yr
- Down + closing
- —
- Monthly P&I
- —
- Monthly cashflow
- —
- DSCR
- —
- Eligible?
- —
No personal income docs; deal must DSCR.
Hard money
10% down · 12.0% · 12mo
- Down + closing
- —
- Monthly P&I
- —
- Monthly cashflow
- —
- DSCR
- —
- Eligible?
- —
Short-term bridge; refi at stabilization.
Rent comps 5 comps
| Address | Beds | Baths | Sqft | Rent | $/sqft | DOM | Units | Dist |
|---|---|---|---|---|---|---|---|---|
| 305 Orange St Macon, GA | 3.0 | 2.0 | 2791 | $2,950 | $1.06 | 45d | 1 | 0.21mi |
| 879 Nottingham Dr Macon, GA | 3.0 | 2.5 | 2147 | $1,700 | $0.79 | 14d | 1 | 1.04mi |
| 870 Laurel Ave Macon, GA | 3.0 | 2.0 | 2205 | $1,300 | $0.59 | 45d | 1 | 1.18mi |
| 2585 Napier Ave Unit A Macon, GA | 2.0 | 2.0 | 2007 | $950 | $0.47 | 45d | 1 | 1.37mi |
| 2663 Hillcrest Ave Macon, GA | 3.0 | 2.0 | 1931 | $1,395 | $0.72 | 22d | 1 | 1.44mi |
Listing history 16 events
-
2026-06-21days on market $59,900 Active 21 DOM
-
2026-06-19days on market $59,900 Active 19 DOM
-
2026-06-18days on market $59,900 Active 18 DOM
-
2026-06-17days on market $59,900 Active 17 DOM
-
2026-06-16days on market $59,900 Active 16 DOM
-
2026-06-15days on market $59,900 Active 15 DOM
-
2026-06-14days on market $59,900 Active 13 DOM
-
2026-06-13days on market $59,900 Active 12 DOM
-
2026-06-10days on market $59,900 Active 10 DOM
-
2026-06-09days on market $59,900 Active 9 DOM
-
2026-06-08days on market $59,900 Active 8 DOM
-
2026-06-07days on market $59,900 Active 7 DOM
-
2026-06-03days on market $59,900 Active 3 DOM
-
2026-06-02days on market $59,900 Active 2 DOM
-
2026-06-01remarks 200-char remark
-
2026-06-01$59,900 Active 1 DOM
ⓘ Source: listings_history table (triggers on properties + properties_extension) + one-shot
backfill from property_details.listing_events for pre-trigger history.
Tax reassessment forecast GA · Resets to sale price
- Current annual tax
- $1,795 · $150/mo
- Projected year-2 tax
- $1,795 · $150/mo
- Expected delta
- $0/yr ($0/mo · 0.0%)
ⓘ Screening estimate from a state-policy table — verify with the county assessor before closing.
Climate risk First Street
- Flood 1/10 Low FEMA zone X (unshaded) · 0% chance over 30 yrs
- Wildfire 1/10 Low
- Heat 7/10 Severe 7 d/yr ≥108°F today · 18 d/yr by 30 yrs out
- Wind 6/10 Major 63% chance of damaging wind over 30 yrs
- Air quality 4/10 Moderate 5 unhealthy d/yr today · 5 by 30 yrs out
Nearby sold comps map
Loading sold comps map…
Walkable amenities ~0.75 mi
Loading nearby amenities…
Taxation est. · year 1
- Rental income
- $42,888
- − Mortgage interest
- −$3,355
- − Property taxes
- −$1,795
- − Insurance
- −$300
- − Repairs & maintenance
- −$3,431
- − Management
- −$3,431
- − Depreciation
- −$1,743
- Taxable income
- $28,834
- Est. tax owed @ 24.0%
- −$6,920
- After-tax cash flow
- $21,098/yr
For passive investors: Depreciation is non-cash, so a rental often shows a tax loss while cash-flowing — sheltering income. Rental losses are passive: they offset passive income freely, and up to $25,000/yr can offset ordinary (W-2) income if you actively participate and your MAGI is under $100k (phasing out to $0 by $150k); unused losses carry forward. On sale, claimed depreciation is recaptured at up to 25%, and gains may owe capital-gains tax (a 1031 exchange can defer both). Figures are a year-1 estimate at your 24.0% rate — not tax advice; consult a CPA.
Schools (NCES district)
- District
- Bibb County
- NCES district ID
- 1300420
- Math proficiency
- 11% ▼ -14.00%
- Reading proficiency
- 18% ▼ -11.00%
- Median HH income
- $37,426
- Composite
- 12.13/100
- National rank
- #9654
- State rank
- #161 of 174 in GA
Livability — Macon-Bibb County
No livability data for this city. (Only ~50 U.S. cities are tracked.)
Census & demographics
- Census place
- Macon-Bibb County, GA
- County
- Bibb County · 164,332 people
- City population
- 143,186
- Metro
- Macon-Bibb County, GA
- Population (ZIP)
- 7,891
- Household income
- $29,420
- Rent vs Own
- Severe rent burden
- 1124.0
Population outlook (Bibb County) Hauer SSP2
- Today (2025)
- 148,772 people
- By 2030
- 145,904 · -1.9%
- By 2040
- 139,404 · -6.3%
- By 2050
- 131,603 · -11.5%
- By 2075
- 111,050 · -25.4%
- By 2100
- 83,346 · -44.0%
Race, ethnicity, and origin ACS 2023
- Neighborhood character
- Diverse neighborhood (Simpson 0.55)
- Race & ethnicity
- Black 59% White 31% Hispanic / Latino 6% Two or more races 5% Asian 2%
- Hispanic origin (detail)
- Mexican 3% Puerto Rican 1%
- Common ancestry
- Slovak 2% Italian 1% Lithuanian 1%
- Foreign-born
- 4% · Canada
- Languages at home
- 92% English-only · Spanish 5% Other Indo-European 2% Chinese 1%
Political lean MEDSL · Bibb
- 2024 margin
- Strong D (+22.4) · D 61.0% · R 38.5%
- 2008→2024 swing
- +4.4pp toward D · 2008: 18.0pp · 2024: 22.4pp
- All cycles
- 2024: D+22.4 2020: D+23.8 2016: D+20.2 2012: D+20.0 2008: D+18.0
Not yet ingested
- Civics
- —
Market trends
- HPI YoY
- ▼ -142.32%
- Current HPI
- 100.04
- Rent YoY
- ▲ 3.11%
- Metro
- Macon-Bibb County, GA
- State GDP YoY
- ▲ 2.66%
- F500 in state
- 28
Industry mix (Fortune 500 HQ in GA)
| Industry | F500 HQs | Revenue |
|---|---|---|
| Paper / Packaging | 2 | $29B |
|
||
| Retail | 1 | $160B |
|
||
| Transportation / Logistics | 1 | $91B |
|
||
| Airlines | 1 | $62B |
|
||
| Consumer Goods | 1 | $47B |
|
||
| Utilities | 1 | $25B |
|
||
Price history
+121.9% since first listed9 events — show timeline
- 2026-05-31 Listed $59,900 MGMLS
- 2025-05-09 Listing Removed — GAMLS
- 2025-05-01 Relisted — GAMLS
- 2025-04-30 Listing Removed — GAMLS
- 2025-04-21 Price Changed $70,000 GAMLS
- 2025-03-06 Listed $80,000 GAMLS
- 2022-01-28 Sold (Public Records) $37,000 Public Records
- 2021-07-16 Sold (Public Records) $37,000 Public Records
- 2021-07-16 Sold (Public Records) $27,000 Public Records
Property tax history
+13.4%/yrLatest (2025): $1,795 · -6.9% YoY. Source: county tax records.
Cash-flow waterfall
monthlySold comps — $/sqft
last 12 mo · ≤1 miLoading sold comps…