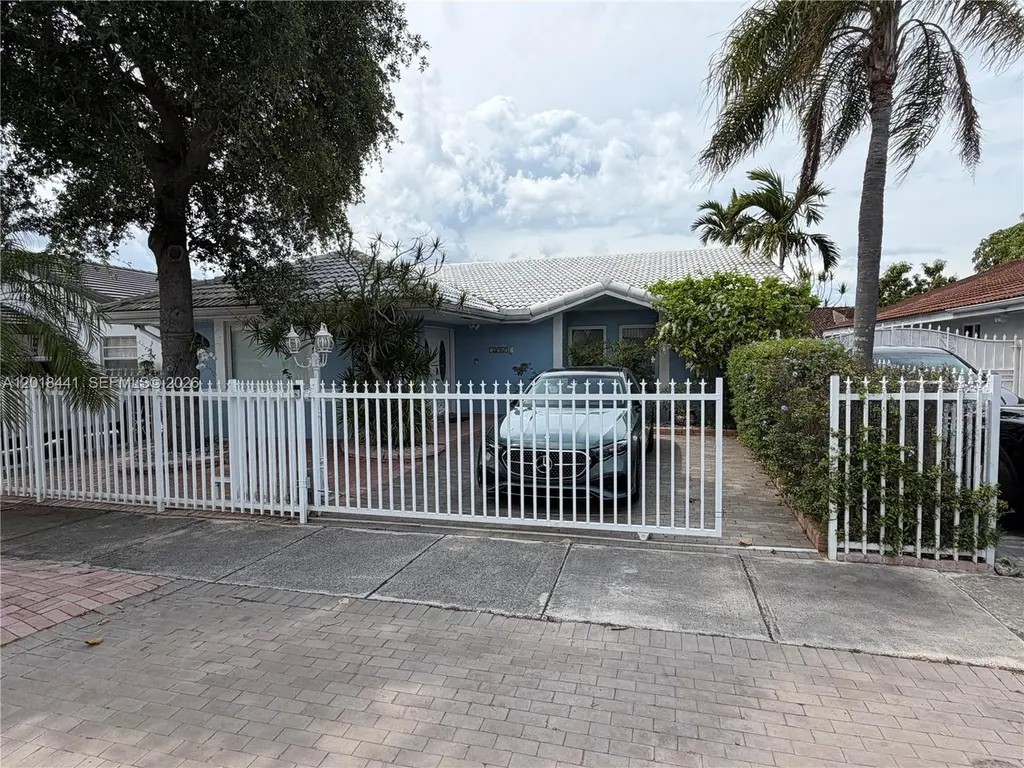
13965 SW 10th St · Tamiami, FL
Flood risk 1/10 · Minimal
- FEMA flood zone
- AH
- Chance of flooding over 30 yrs
- 0.0%
- Est. flood insurance / yr
- $1,142 – $2,507
Fire risk 8/10 · Major
- Est. fire insurance / yr
- $947 – $1,759
Heat risk 10/10 · Severe
- Hot days now (above 105°F)
- 7 days/yr
- Hot days in 30 yrs
- 29 days/yr
Wind risk 10/10 · Severe
- Chance of severe wind over 30 yrs
- 99.0%
Air-quality risk 2/10 · Minimal
- Unhealthy air days now
- 1 days/yr
- Unhealthy air days in 30 yrs
- 1 days/yr
Risk factors via First Street. Map © Google.
Why this score? — see what drove the C- grade
The composite is a weighted blend of 9 inputs, each scored 0–100. Each bar is that input's sub-score; the figure is the points it added to the 100-point composite (weight × sub-score).
- Cash flow +20.1/30.0
- ARV discount +7.5/15.0
- DSCR +6.4/10.0
- 1% rule +6.3/10.0
- Schools +4.2/10.0
- Livability +4.0/5.0
- Rent growth +2.5/5.0
- Condition / age +2.5/5.0
- Appreciation +0.0/10.0
$350,000
🖨 Deal sheet 📄 Offer letter ✓ Due diligence
Listing remarks
Shorts sale subject to lender approval
Key facts
- 4,489 sq ft lot
- Garage
- Built 1989
Property features AI
Exterior
- Parking: 1-car garage; Driveway; 1 covered parking space
- Utilities: Public water; Public sewer
- Home design: Single-story; Faces west; Resale
- Construction: Block construction; Barrel roof
- Exterior features: Fenced yard; Patio
Interior
- Kitchen: Microwave; Refrigerator
- Flooring: Tile
- Bathrooms: 2 full bathrooms
- Heating & cooling: Central heating; Central air conditioning
- Interior features: Bedroom on main level; First floor entry
- Laundry & utility: Washer hookup; Dryer hookup; Washer included
Neighborhood map
What this means for you Summary
Snapshot
- This is a 3-bed/2.0-bath single-family listed at $350k.
Deal economics
- At list price, monthly cash flow is $282 ($3k/yr) — positive.
- The deal already cash-flows at list — no discount required.
- Meets the 1% rule at list price ($4k rent vs $350k).
- Cap rate 7.8% vs local median 3.4% in Tamiami — top-decile yield for the area; either an underpriced asset or a hidden risk that comps aren't pricing in. Stress-test before assuming the spread holds.
Location & tenants
- Location reads 79/100 on livability (#146 in FL, #2,197 nationally) — a middle-class / working-renter tenant base. Strengths: housing A+, health & safety A+, crime A; Watch: cost of living D, amenities F.
- Miami-Dade (suburban): math 45% / reading 54% proficiency, ranked #40 of 73 in FL (top 55%) — families likely to look elsewhere, expect single-tenant / working-renter base with shorter leases; 64% free/reduced lunch — lower-income household profile, screen leases tightly.
- Market conditions: 80 active listings in the ZIP; 40 comparable units currently listed for rent nearby; rentals at typical pace (median 25d on market — plan ~3-4 weeks tenant-placement turnaround); solid renter incomes; 10,051 units permitted in Miami-Dade County in 2024 (7,758 in 5+ unit buildings).
- At $3,959/mo this rent would consume 60% of the median local household income ($80k/yr) (locally 1139% of renters already pay >50% of income on rent) — very limited rent-growth headroom before tenants either downsize or default.
Forward outlook
- Local home prices are declining (-3.0%/yr); year-one equity from $2k of loan paydown is wiped out by about $10k of value loss. Plan a longer hold.
- Miami-Dade County population projected at +28% by 2050 — long-run rental-demand tailwind backs the buy-and-hold thesis.
Negotiation context
- Only 1 days on market — expect competitive offers; lowballing is unlikely to land.
- Current owner paid $105k; list at $350k implies a 233% gain — meaningful room to come down on a strong offer.
Risks & watch-outs
- Watch-outs: flood insurance adds $152/mo.
- Climate carrying-cost: in FEMA flood zone AH (mandatory federal flood insurance); severe wind risk, 99% chance of damaging wind over 30y; severe wildfire risk; extreme-heat days projected 7→29/yr by 2055 (HVAC capex compounding) — expect insurance premiums to compound above CPI over the hold.
Questions for the listing agent
- What's the actual annual flood-insurance premium (NFIP or private), and is the property in a SFHA with mandatory coverage?
- Is there a deadline driving the sale (1031 exchange, divorce, estate, relocation)? That informs how much negotiation room exists.
- Schools are B-rated — typically a magnet for longer-tenancy family renters. What's the average tenant stay here, and is there a school-zone premium baked into asking?
- What's the average days-on-market for RENTAL listings here right now (not sales)? A rising rental-DOM trend means longer vacancies and softer asking-rent achievability than the comps imply.
- What's the recent tenant-quality profile in this submarket — average credit score on applications, eviction rate, late-payment / NSF rate, and stable-employment percentage? A property-management company in the area should have these aggregated.
- How much new for-sale + rental construction is in the pipeline within 1–3 miles? Heavy new supply typically softens prices + rents 12–24 months out; constrained supply supports both.
Investment metrics
- 1% rule
- 1.13% ✓
- Cap rate
- 7.78%
- Cash-on-cash
- 5.32%
- DSCR
- 1.24
- GRM
- 7.4
CMA / ARV
- ARV (on-the-fly)
- $703,311
- Comps found
- 2
Show comp detail 2 sales within ~0.75 mi
| Address | Dist | Beds/Ba | Sqft | Sold | Price | $/sf | Match |
|---|---|---|---|---|---|---|---|
| 13228 SW 10th Ln | 0.74mi | 3/2.5 | 2,331 (+4%) | 3mo | $730,000 | $313 | 54 |
| 1730 SW 138th Ct | 0.50mi | 4/2.0 (+1) | 2,130 (-5%) | 21mo | $665,000 | $312 | 45 |
Match score weights: distance 35% · size 25% · config 20% · recency 20%. Top-matched comps best support the ARV.
Projected returns pro-forma
-3.0% appreciation · 3.0% rent growth · sell at horizon
- IRR
- -10.8%
- Equity multiple
- 0.61×
- Total profit
- $-38,416
- Equity at exit
- $52,186
- IRR
- -1.3%
- Equity multiple
- 0.91×
- Total profit
- $-8,995
- Equity at exit
- $30,262
Cash invested: $98,000 (down + closing). Projections, not guarantees.
Landlord ↔ Tenant lean methodology
- Overall (STATE)
- 87 Strongly Landlord-Friendly
- State Florida
- 87 Strongly Landlord-Friendly · R+3
- County
- — inherits STATE
- City
- — inherits STATE
ZIP-level market 33184
- Home prices YoY
- -31.1%
- Active inventory
- 80
- Price-to-rent
- 7.4×
Monthly cashflow live
- Estimated rent
- $3,959 high interval (Pro) →
- Mortgage (P&I)
- −$1,835
- Tax from tax record
- −$712 /mo · $8,548/yr
- Insurance
- −$146
- Flood insurance flood zone
- −$152 /mo · $1,824/yr
- HOA
- −$0
- Vacancy / Maint / Mgmt
- −$831
- Net cashflow
- $282
Break-even live
UW: 25.0% down · 7.5% · 30yr · 1.5% tax · 5.0% vac · 8.0% maint · 8.0% mgmt
Financing live
Cash to close
- Down payment
- $87,500
- Closing costs
- $10,500
- Reserves months
- —
- Total cash needed
- —
Loan-product check · same deal, 3 products live
Conventional
25% down · 7.5% · 30yr
- Down + closing
- —
- Monthly P&I
- —
- Monthly cashflow
- —
- DSCR
- —
- Eligible?
- —
Personal DTI + credit; lowest rate.
DSCR
20% down · 8.5% · 30yr
- Down + closing
- —
- Monthly P&I
- —
- Monthly cashflow
- —
- DSCR
- —
- Eligible?
- —
No personal income docs; deal must DSCR.
Hard money
10% down · 12.0% · 12mo
- Down + closing
- —
- Monthly P&I
- —
- Monthly cashflow
- —
- DSCR
- —
- Eligible?
- —
Short-term bridge; refi at stabilization.
Rent comps 40 comps
| Address | Beds | Baths | Sqft | Rent | $/sqft | DOM | Units | Dist |
|---|---|---|---|---|---|---|---|---|
| 14325 SW 11th Ter Miami, FL | 4.0 | 2.0 | 1973 | $3,850 | $1.95 | 24d | 1 | 0.22mi |
| 1417 SW 139th Ave Unit 1417 Miami, FL | 4.0 | 2.0 | 2067 | $4,750 | $2.30 | 2d | 1 | 0.34mi |
| 14302 SW 15th St Miami, FL | 4.0 | 3.0 | 2784 | $5,500 | $1.98 | 24d | 1 | 0.39mi |
| 13812 SW 16th Ter Miami, FL | 3.0 | 2.0 | 1484 | $3,900 | $2.63 | 5d | 1 | 0.50mi |
| 13812 SW 16th Ter Miami, FL | 3.0 | 2.0 | 1484 | $3,900 | $2.63 | 24d | 1 | 0.50mi |
| 13812 SW 16th Ter Miami, FL | 3.0 | 2.0 | 1484 | $3,900 | $2.63 | 21d | 1 | 0.50mi |
| 13812 SW 16th Ter Miami, FL | 3.0 | 2.0 | 1484 | $3,900 | $2.63 | 19d | 1 | 0.50mi |
| 13812 SW 16th Ter Miami, FL | 3.0 | 2.0 | 1484 | $3,900 | $2.63 | 12d | 1 | 0.50mi |
| 13812 SW 16th Ter Miami, FL | 3.0 | 2.0 | 1484 | $3,900 | $2.63 | 4d | 1 | 0.50mi |
| 13770 SW 17th Ter Unit 13770 Miami, FL | 3.0 | 2.0 | 1488 | $3,300 | $2.22 | 24d | 1 | 0.58mi |
| 13496 SW 13th Ter Miami, FL | 3.0 | 2.5 | 1915 | $3,300 | $1.72 | 24d | 1 | 0.59mi |
| 1981 SW 139th Ct Miami, FL | 4.0 | 2.0 | 2130 | $4,750 | $2.23 | 24d | 1 | 0.62mi |
| 1727 SW 136th Pl Miami, FL | 4.0 | 2.0 | 1796 | $3,800 | $2.12 | 17d | 1 | 0.62mi |
| 14423 SW 18th St Miami, FL | 4.0 | 4.0 | 2543 | $5,800 | $2.28 | 18d | 1 | 0.63mi |
| 1991 SW 139th Ave Miami, FL | 4.0 | 3.0 | 2548 | $4,200 | $1.65 | 24d | 1 | 0.64mi |
| 13404 SW 14th Ter Miami, FL | 3.0 | 2.5 | 1755 | $2,850 | $1.62 | 4d | 1 | 0.66mi |
| 14773 SW 9th Ln Miami, FL | 3.0 | 2.0 | 1608 | $3,350 | $2.08 | 18d | 1 | 0.72mi |
| 14803 SW 9th Ln Miami, FL | 3.0 | 2.5 | 1608 | $3,100 | $1.93 | 4d | 1 | 0.74mi |
| 14803 SW 9th Ln Miami, FL | 3.0 | 2.5 | 1608 | $3,100 | $1.93 | 24d | 1 | 0.74mi |
| 1220 SW 131st Place Cir W Unit 1220 Miami, FL | 3.0 | 2.0 | 1458 | $2,900 | $1.99 | 24d | 1 | 0.79mi |
| 1220 SW 131st Place Cir W Unit W Miami, FL | 3.0 | 2.0 | 1458 | $2,800 | $1.92 | 3d | 1 | 0.79mi |
| 13198 SW 10th Terrace Dr Miami, FL | 3.0 | 2.0 | 1458 | $3,000 | $2.06 | 24d | 1 | 0.82mi |
| 330 SW 133rd Pl Unit 330 Miami, FL | 4.0 | 3.0 | 2720 | $6,200 | $2.28 | 24d | 1 | 0.83mi |
| 13147 SW 11th Lane Cir Miami, FL | 3.0 | 2.5 | 1754 | $3,200 | $1.82 | 19d | 1 | 0.89mi |
| 13147 SW 11th Lane Cir Unit 13147 Miami, FL | 3.0 | 2.5 | 1754 | $3,200 | $1.82 | 22d | 1 | 0.89mi |
| 14905 SW 8th Ter Unit N Miami, FL | 3.0 | 2.5 | 1812 | $3,250 | $1.79 | 24d | 1 | 0.90mi |
| 886 SW 149th Ct #886 Miami, FL | 4.0 | 2.5 | 1899 | $3,400 | $1.79 | 8d | 1 | 0.91mi |
| 1758 SW 131st Place Cir S Unit Na Miami, FL | 3.0 | 2.5 | 1754 | $4,900 | $2.79 | 24d | 1 | 0.94mi |
| 15030 SW 9th Ter Miami, FL | 4.0 | 3.0 | 1985 | $3,700 | $1.86 | 24d | 1 | 1.02mi |
| 13023 SW 6th St Miami, FL | 3.0 | 3.0 | 1798 | $5,000 | $2.78 | 24d | 1 | 1.03mi |
| 13023 SW 6th St Miami, FL | 3.0 | 3.0 | 1795 | $5,000 | $2.79 | 8d | 1 | 1.03mi |
| 2402 SW 145th Pl Miami, FL | 4.0 | 3.5 | 2313 | $4,000 | $1.73 | 3d | 1 | 1.04mi |
| 15059 SW 9th Ln Miami, FL | 4.0 | 3.0 | 1899 | $3,350 | $1.76 | 24d | 1 | 1.05mi |
| 2414 SW 145th Pl Unit 2414 Miami, FL | 4.0 | 3.0 | 1920 | $3,600 | $1.88 | 12d | 1 | 1.05mi |
| 2434 SW 145th Pl Miami, FL | 4.0 | 3.5 | 2313 | $3,950 | $1.71 | 24d | 1 | 1.08mi |
| 14382 SW 27th St Miami, FL | 3.0 | 2.0 | 2162 | $4,000 | $1.85 | 24d | 1 | 1.14mi |
| 2349 SW 148th Ct Miami, FL | 4.0 | 2.0 | 1833 | $3,900 | $2.13 | 24d | 1 | 1.14mi |
| 14968 SW 23rd Way Unit 14968 Miami, FL | 3.0 | 2.5 | 1812 | $3,200 | $1.77 | 24d | 1 | 1.15mi |
| 2657 SW 145th Ave Unit 1 Miami, FL | 4.0 | 3.5 | 2504 | $4,500 | $1.80 | 20d | 1 | 1.16mi |
| 14754 SW 25th St Unit 1 Miami, FL | 3.0 | 2.5 | 1816 | $3,100 | $1.71 | 24d | 1 | 1.17mi |
Listing history 4 events
-
2026-05-14status Pending
-
2026-05-13$350,000 Active
-
1991-12-13soldstatus $105,000
-
1988-03-01soldstatus $550,000
ⓘ Source: listings_history table (triggers on properties + properties_extension) + one-shot
backfill from property_details.listing_events for pre-trigger history.
Tax reassessment forecast FL · Resets to sale price
- Current annual tax
- $8,548 · $712/mo
- Projected year-2 tax
- $8,548 · $712/mo
- Expected delta
- $0/yr ($0/mo · 0.0%)
ⓘ Screening estimate from a state-policy table — verify with the county assessor before closing.
Climate risk First Street
- Flood 1/10 Low FEMA zone AH · 0% chance over 30 yrs
- Wildfire 8/10 Severe
- Heat 10/10 Extreme 7 d/yr ≥105°F today · 29 d/yr by 30 yrs out
- Wind 10/10 Extreme 99% chance of damaging wind over 30 yrs
- Air quality 2/10 Low 1 unhealthy d/yr today · 1 by 30 yrs out
Nearby sold comps map
Loading sold comps map…
Walkable amenities ~0.75 mi
Loading nearby amenities…
Taxation est. · year 1
- Rental income
- $47,512
- − Mortgage interest
- −$19,605
- − Property taxes
- −$8,548
- − Insurance
- −$3,574
- − Repairs & maintenance
- −$3,801
- − Management
- −$3,801
- − Depreciation
- −$10,182
- Taxable loss
- −$1,999
- Est. tax savings @ 24.0%
- +$480
- After-tax cash flow
- $3,867/yr
For passive investors: Depreciation is non-cash, so a rental often shows a tax loss while cash-flowing — sheltering income. Rental losses are passive: they offset passive income freely, and up to $25,000/yr can offset ordinary (W-2) income if you actively participate and your MAGI is under $100k (phasing out to $0 by $150k); unused losses carry forward. On sale, claimed depreciation is recaptured at up to 25%, and gains may owe capital-gains tax (a 1031 exchange can defer both). Figures are a year-1 estimate at your 24.0% rate — not tax advice; consult a CPA.
Schools (NCES district)
- District
- Miami-Dade
- NCES district ID
- 1200390
- Math proficiency
- 45% ▼ -16.00%
- Reading proficiency
- 54% ▼ -5.00%
- Median HH income
- $43,928
- Composite
- 41.76/100
- National rank
- #3397
- State rank
- #40 of 73 in FL
Livability — Tamiami
- Score
- 79/100
- State rank
- #146
- US rank
- #2197
Category grades
Schools grade is shown separately in the Schools card above.
Census & demographics
- County
- Miami-Dade County · 2,697,751 people
- City population
- 80,608
- Metro
- Miami-Fort Lauderdale-Pompano Beach, FL
- Population (ZIP)
- 19,859
- Household income
- $79,784
- Rent vs Own
- Severe rent burden
- 1139.0
Population outlook (Miami-Dade County) Hauer SSP2
- Today (2025)
- 3,126,439 people
- By 2030
- 3,325,765 · +6.4%
- By 2040
- 3,697,561 · +18.3%
- By 2050
- 4,012,134 · +28.3%
- By 2075
- 4,605,612 · +47.3%
- By 2100
- 4,866,598 · +55.7%
Race, ethnicity, and origin ACS 2023
- Neighborhood character
- Predominantly Hispanic (92%)
- Race & ethnicity
- Hispanic / Latino 92% Two or more races 55% White 6%
- Hispanic origin (detail)
- Mexican 2% Puerto Rican 2% Cuban 71%
- Common ancestry
- Estonian 1%
- Foreign-born
- 69% · Canada, Jamaica, Dominican Republic
- Languages at home
- 7% English-only · Spanish 91% Other Indo-European 1% Chinese 1%
Political lean MEDSL · Miami-Dade
- 2024 margin
- R (+11.4) · D 43.9% · R 55.4%
- 2008→2024 swing
- -27.6pp toward R · 2008: 16.1pp · 2024: -11.4pp
- All cycles
- 2024: R+11.4 2020: D+7.3 2016: D+29.6 2012: D+23.7 2008: D+16.1
Not yet ingested
- Civics
- —
Market trends
- HPI YoY
- ▼ -197.33%
- Current HPI
- 437.8467
- Rent YoY
- —
- Metro
- Miami-Fort Lauderdale-Pompano Beach, FL
- State GDP YoY
- ▲ 3.28%
- F500 in state
- 36
Industry mix (Fortune 500 HQ in FL)
| Industry | F500 HQs | Revenue |
|---|---|---|
| Industrial Technology | 2 | $29B |
|
||
| Insurance | 2 | $17B |
|
||
| Retail | 1 | $60B |
|
||
| Technology Distribution | 1 | $58B |
|
||
| Homebuilding | 1 | $35B |
|
||
| Technology Manufacturing | 1 | $35B |
|
||
Price history
-36.4% since first listed4 events — show timeline
- 2026-05-14 Pending — MARMLS
- 2026-05-13 Listed $350,000 MARMLS
- 1991-12-13 Sold (Public Records) $105,000 Public Records
- 1988-03-01 Sold (Public Records) $550,000 Public Records
Property tax history
+6.4%/yrLatest (2025): $8,548 · +6.8% YoY. Source: county tax records.
Cash-flow waterfall
monthlySold comps — $/sqft
last 12 mo · ≤1 miLoading sold comps…