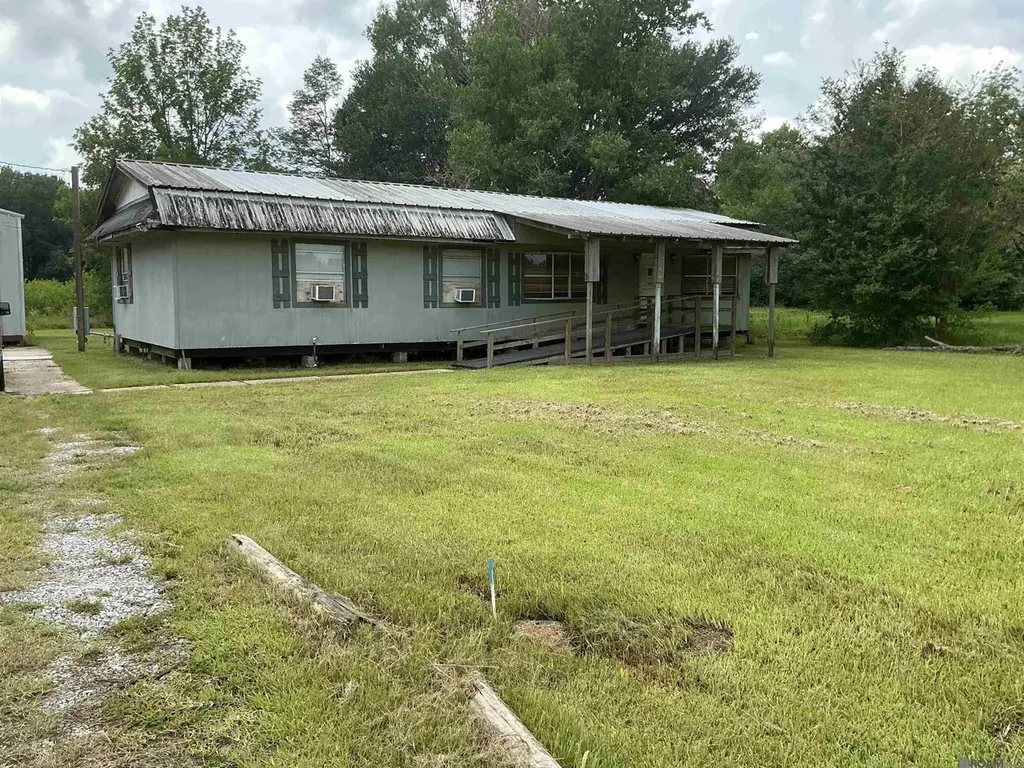
8276 Main St · Zachary, LA
Flood risk No data
- FEMA flood zone
- —
- Chance of flooding over 30 yrs
- —
- Est. flood insurance / yr
- —
Fire risk No data
- Est. fire insurance / yr
- —
Heat risk No data
- Hot days now (above threshold)
- —
- Hot days in 30 yrs
- —
Wind risk No data
- Chance of severe wind over 30 yrs
- —
Air-quality risk No data
- Unhealthy air days now
- —
- Unhealthy air days in 30 yrs
- —
Risk factors via First Street. Map © Google.
Why this score? — see what drove the F grade
The composite is a weighted blend of 9 inputs, each scored 0–100. Each bar is that input's sub-score; the figure is the points it added to the 100-point composite (weight × sub-score).
- Cash flow +9.4/30.0
- Schools +4.7/10.0
- Rent growth +3.5/5.0
- Livability +3.5/5.0
- DSCR +2.6/10.0
- Condition / age +2.5/5.0
- 1% rule +1.7/10.0
- ARV discount +0.0/15.0
- Appreciation +0.0/10.0
$200,000
🖨 Deal sheet (PDF) 📄 Offer letter ✓ Due diligence
Listing remarks MLS
16x65 modular home and a metal workshop on 123 feet of frontage on Main Street in Zachary. The property encompasses 2.36 acres. NOT IN A FLOOD ZONE, did not flood and is 834 feet deep. Great potential for commercial development .
Key facts
- Not in a flood zone
- Modular home
- 834 feet deep
Tags
Neighborhood map
What this means for you Summary
Snapshot
- This is a 3-bed/2.0-bath manufactured listed at $200k.
Deal economics
- At list price, monthly cash flow is $-143 ($-2k/yr) — negative.
- To cash-flow at today's rent, offer at most $175k (12.7% below list).
- To meet the 1% rule (rent ≥ 1% of price), the offer needs to be $133k (33.4% below list).
- Recommended offer: $133k (33.4% below list) — sets the bar for 1% rule.
- Cap rate 5.4% vs local median 4.5% in Zachary — meaningfully above typical; check what's discounted (condition, days-on-market, listing class) to confirm the premium yield is real.
Location & tenants
- Location reads 69/100 on livability (#64 in LA) — a middle-class / working-renter tenant base. Strengths: employment A+, housing A+, cost of living B+; Watch: crime C-, amenities F, commute F.
- Zachary Community School District (suburban): math 46% / reading 60% proficiency, ranked #8 of 98 in LA (top 8%) — acceptable for families but not a draw, mixed tenant base, ~2y average lease.
- Zoned schools: Rollins Place Elementary (847 students, 60% FRL); Northwestern Middle School (math 41% / reading 68%, grade B-, #17 of 218 statewide, top 8%, 912 students, 56% FRL); Zachary High School (math 56% / reading 68%, grade B-, #15 of 265 statewide, top 6%, 1,765 students, 53% FRL) — zoned schools average 56% FRL vs 38% district-wide (18 pts higher); higher-poverty schools than district average — tighter screening recommended.
- Market conditions: Rents rising fast (+4.2%/yr); 588 active listings in the ZIP; 1 comparable units currently listed for rent nearby; solid renter incomes; 2,252 units permitted in East Baton Rouge Parish in 2024 (440 in 5+ unit buildings).
Forward outlook
- Local home prices are declining (-3.0%/yr); year-one equity from $1k of loan paydown is wiped out by about $6k of value loss. Plan a longer hold.
- East Baton Rouge County population projected at +4% by 2050 — modest demand growth; plan on rents tracking national, not racing it.
Negotiation context
- It's been on market 325 days — a 12% lower offer ($176k) is reasonable based on typical stale-listing flexibility.
- 8 sale attempts since 19y ago with the ask held roughly flat each time — persistent listings suggest the price (not the market) is what's stuck; bring a comps-based counter.
- Current owner paid $75k; list at $200k implies a 167% gain — meaningful room to come down on a strong offer.
Questions for the listing agent
- What do current leases actually rent for vs. the listed asking? Can we see a recent rent roll and the last 12 months of T-12 income?
- It's been on market 325 days. Have you received any prior offers? Is the seller open to a 33% concession, seller financing, or rate buy-down credit?
- Why hasn't it sold? Are there any deal-killer items the seller is aware of (foundation, flood, title, zoning, code violations)?
- Is there a deadline driving the sale (1031 exchange, divorce, estate, relocation)? That informs how much negotiation room exists.
- Schools are A-rated — typically a magnet for longer-tenancy family renters. What's the average tenant stay here, and is there a school-zone premium baked into asking?
- The area grade is low — what's the realistic commute time and amenity access for the typical tenant pool here? Any planned neighborhood developments (good or bad) we should know about?
- What's the average days-on-market for RENTAL listings here right now (not sales)? A rising rental-DOM trend means longer vacancies and softer asking-rent achievability than the comps imply.
- What's the recent tenant-quality profile in this submarket — average credit score on applications, eviction rate, late-payment / NSF rate, and stable-employment percentage? A property-management company in the area should have these aggregated.
- How much new for-sale + rental construction is in the pipeline within 1–3 miles? Heavy new supply typically softens prices + rents 12–24 months out; constrained supply supports both.
Investment metrics
- 1% rule
- 0.67% ✗
- Cap rate
- 5.43%
- Cash-on-cash
- -3.07%
- DSCR
- 0.86
- GRM
- 12.5
CMA / ARV
- ARV (median comp)
- $140,000
- List price
- $200,000
- Delta
- 42.86%
- Verdict
- OVERPRICED
- Comps
- 1 within 2.0 mi
Projected returns pro-forma
-3.0% appreciation · 4.18% rent growth · sell at horizon
- IRR
- -20.4%
- Equity multiple
- 0.29×
- Total profit
- $-40,037
- Equity at exit
- $29,821
- IRR
- -11.6%
- Equity multiple
- 0.28×
- Total profit
- $-40,287
- Equity at exit
- $17,292
Cash invested: $56,000 (down + closing). Projections, not guarantees.
Landlord ↔ Tenant lean methodology
- Overall (STATE)
- 90 Strongly Landlord-Friendly
- State Louisiana
- 90 Strongly Landlord-Friendly · R+12
- County
- — inherits STATE
- City
- — inherits STATE
ZIP-level market 70791
- Home prices YoY
- -21.6%
- Rents YoY
- 4.2%
- Active inventory
- 588
- Price-to-rent
- 12.5×
Monthly cashflow live
- Estimated rent
- $1,331 medium interval (Pro) →
- Mortgage (P&I)
- −$1,049
- Tax from tax record
- −$63 /mo · $757/yr
- Insurance
- −$83
- HOA
- −$0
- Lot rent leased land?
- −$0
- Vacancy / Maint / Mgmt
- −$280
- Net cashflow
- $-143
Break-even live
Sensitivity live
| Price | -10% $-30 | -5% $-87 | +0% $-143 | +5% $-200 | +10% $-257 |
|---|---|---|---|---|---|
| Rent | -10% $-249 | -5% $-196 | +0% $-143 | +5% $-91 | +10% $-38 |
| Rate | -1.0pp $-43 | -0.5pp $-93 | base $-143 | +0.5pp $-195 | +1.0pp $-248 |
UW: 25.0% down · 7.5% · 30yr · 1.5% tax · 5.0% vac · 8.0% maint · 8.0% mgmt
Financing live
Cash to close
- Down payment
- $50,000
- Closing costs
- $6,000
- Reserves months
- —
- Total cash needed
- —
Loan-product check · same deal, 3 products live
Conventional
25% down · 7.5% · 30yr
- Down + closing
- —
- Monthly P&I
- —
- Monthly cashflow
- —
- DSCR
- —
- Eligible?
- —
Personal DTI + credit; lowest rate.
DSCR
20% down · 8.5% · 30yr
- Down + closing
- —
- Monthly P&I
- —
- Monthly cashflow
- —
- DSCR
- —
- Eligible?
- —
No personal income docs; deal must DSCR.
Hard money
10% down · 12.0% · 12mo
- Down + closing
- —
- Monthly P&I
- —
- Monthly cashflow
- —
- DSCR
- —
- Eligible?
- —
Short-term bridge; refi at stabilization.
Rent comps 1 comps
| Address | Beds | Baths | Sqft | Rent | $/sqft | DOM | Units | Dist |
|---|---|---|---|---|---|---|---|---|
| 4150 McHugh Rd Zachary, LA | 1.0–3.0 | 1.0–2.0 | 993 | $1,690 | $1.70 | 16d | 8 | 1.20mi |
Listing history 22 events
-
2026-06-10days on market $200,000 Active 325 DOM
-
2026-06-09days on market $200,000 Active 324 DOM
-
2026-06-08days on market $200,000 Active 323 DOM
-
2026-06-07days on market $200,000 Active 322 DOM
-
2026-06-03days on market $200,000 Active 318 DOM
-
2026-06-02days on market $200,000 Active 317 DOM
-
2026-06-01days on market $200,000 Active 316 DOM
-
2026-05-31days on market $200,000 Active 315 DOM
-
2026-05-31days on market $200,000 Active 314 DOM
-
2025-07-20$200,000 Active 230-char remark
Show marketing remark (229 chars)
16x65 modular home and a metal workshop on 123 feet of frontage on Main Street in Zachary. The property encompasses 2.36 acres. NOT IN A FLOOD ZONE, did not flood and is 834 feet deep. Great potential for commercial development .
-
2025-07-20$200,000 Active 229-char remark
Show marketing remark (229 chars)
16x65 modular home and a metal workshop on 123 feet of frontage on Main Street in Zachary. The property encompasses 2.36 acres. NOT IN A FLOOD ZONE, did not flood and is 834 feet deep. Great potential for commercial development .
-
2025-05-23soldstatus $75,000
-
2019-01-23historical
-
2018-10-25$125,000 Active
-
2018-10-25$125,000
-
2018-03-02historical
-
2017-08-28price $99,500
-
2017-03-01$122,500 Active
-
2017-03-01$99,500
-
2007-02-20$300,000
-
2007-02-20$300,000
-
1984-01-12soldstatus
ⓘ Source: listings_history table (triggers on properties + properties_extension) + one-shot
backfill from property_details.listing_events for pre-trigger history.
Tax reassessment forecast LA · Resets to sale price
- Current annual tax
- $757 · $63/mo
- Projected year-2 tax
- $1,100 · $92/mo
- Expected delta
- +$343/yr (+$29/mo · 45.3%)
ⓘ Screening estimate from a state-policy table — verify with the county assessor before closing.
Nearby sold comps map
Loading sold comps map…
Walkable amenities ~0.75 mi
Loading nearby amenities…
Taxation est. · year 1
- Rental income
- $15,977
- − Mortgage interest
- −$11,203
- − Property taxes
- −$757
- − Insurance
- −$1,000
- − Repairs & maintenance
- −$1,278
- − Management
- −$1,278
- − Depreciation
- −$5,818
- Taxable loss
- −$5,357
- Est. tax savings @ 24.0%
- +$1,286
- After-tax cash flow
- $-435/yr
For passive investors: Depreciation is non-cash, so a rental often shows a tax loss while cash-flowing — sheltering income. Rental losses are passive: they offset passive income freely, and up to $25,000/yr can offset ordinary (W-2) income if you actively participate and your MAGI is under $100k (phasing out to $0 by $150k); unused losses carry forward. On sale, claimed depreciation is recaptured at up to 25%, and gains may owe capital-gains tax (a 1031 exchange can defer both). Figures are a year-1 estimate at your 24.0% rate — not tax advice; consult a CPA.
Schools (NCES district)
- District
- Zachary Community School District
- NCES district ID
- 2200039
- Math proficiency
- 46% ▼ -38.00%
- Reading proficiency
- 60% ▼ -28.00%
- Median HH income
- $68,531
- Composite
- 46.99/100
- National rank
- #2349
- State rank
- #8 of 98 in LA
Livability — Zachary
- Score
- 69/100
- State rank
- #64
- US rank
- #8274
Category grades
Schools grade is shown separately in the Schools card above.
Census & demographics
- Census place
- Zachary, LA
- County
- East Baton Rouge Parish · 399,686 people
- City population
- 30,385
- Metro
- Baton Rouge, LA
- Population (ZIP)
- 30,385
- Household income
- $78,263
- Rent vs Own
- Severe rent burden
- 718.0
Population outlook (East Baton Rouge County) Hauer SSP2
- Today (2025)
- 464,810 people
- By 2030
- 472,137 · +1.6%
- By 2040
- 480,243 · +3.3%
- By 2050
- 484,422 · +4.2%
- By 2075
- 492,069 · +5.9%
- By 2100
- 476,347 · +2.5%
Race, ethnicity, and origin ACS 2023
- Neighborhood character
- Diverse neighborhood (Simpson 0.55)
- Race & ethnicity
- White 53% Black 41% Two or more races 4% Hispanic / Latino 2% Asian 2%
- Common ancestry
- Lithuanian 6% Italian 2% Slovak 1%
- Foreign-born
- 2% · Canada
- Languages at home
- 96% English-only · Spanish 1% German/W. Germanic 1% French/Haitian/Cajun 1%
Political lean MEDSL · East Baton Rouge
- 2024 margin
- D (+11.1) · D 54.5% · R 43.4% · Other 2.1%
- 2008→2024 swing
- +8.9pp toward D · 2008: 2.2pp · 2024: 11.1pp
- All cycles
- 2024: D+11.1 2020: D+13.1 2016: D+9.2 2012: D+5.2 2008: D+2.2
Not yet ingested
- Civics
- —
Market trends
- HPI YoY
- ▼ -47.01%
- Current HPI
- 170.2143
- Rent YoY
- ▲ 4.18%
- Metro
- Baton Rouge, LA
- State GDP YoY
- ▲ 3.29%
- F500 in state
- 10
Industry mix (Fortune 500 HQ in LA)
| Industry | F500 HQs | Revenue |
|---|---|---|
| Telecommunications | 2 | $23B |
|
||
| Utilities | 1 | $12B |
|
||
| Wholesale / Distribution | 1 | $5B |
|
||
| Advertising | 1 | $2B |
|
||
Price history
-33.3% since first listed13 events — show timeline
- 2025-07-20 Listed $200,000 GBRMLS
- 2025-07-20 Listed $200,000 AcadianaMLS
- 2025-05-23 Sold (Public Records) $75,000 Public Records
- 2019-01-23 Delisted — GBRMLS
- 2018-10-25 Listed $125,000 AcadianaMLS
- 2018-10-25 Listed $125,000 GBRMLS
- 2018-03-02 Delisted — GBRMLS
- 2017-08-28 Price Changed $99,500 GBRMLS
- 2017-03-01 Listed $122,500 GBRMLS
- 2017-03-01 Listed $99,500 AcadianaMLS
- 2007-02-20 Listed $300,000 AcadianaMLS
- 2007-02-20 Listed $300,000 GBRMLS
- 1984-01-12 Sold (Public Records) — Public Records
Property tax history
+30.2%/yrLatest (2025): $757 · -2.6% YoY. Source: county tax records.
Cash-flow waterfall
monthlySold comps — $/sqft
last 12 mo · ≤1 miLoading sold comps…