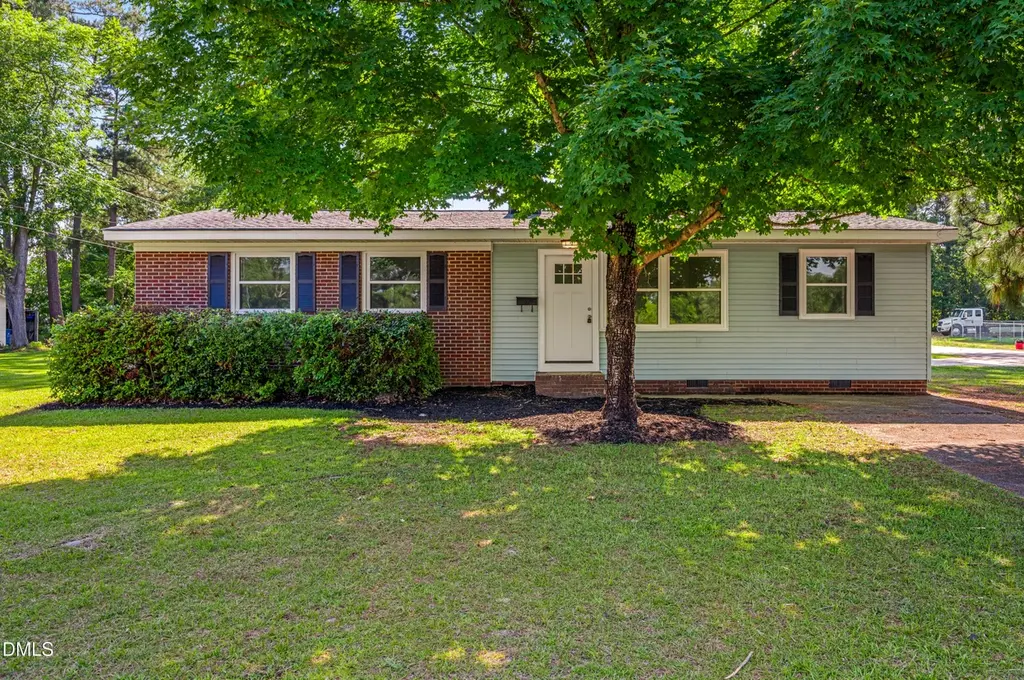
317 N Wright St · Raeford, NC
Flood risk 1/10 · Minimal
- FEMA flood zone
- X (unshaded)
- Chance of flooding over 30 yrs
- 0.0%
- Est. flood insurance / yr
- $507 – $1,088
Fire risk 6/10 · Moderate
- Est. fire insurance / yr
- $906 – $1,684
Heat risk 7/10 · Major
- Hot days now (above 106°F)
- 7 days/yr
- Hot days in 30 yrs
- 16 days/yr
Wind risk 7/10 · Major
- Chance of severe wind over 30 yrs
- 75.0%
Air-quality risk 1/10 · Minimal
- Unhealthy air days now
- 0 days/yr
- Unhealthy air days in 30 yrs
- 0 days/yr
Risk factors via First Street. Map © Google.
Why this score? — see what drove the F grade
The composite is a weighted blend of 9 inputs, each scored 0–100. Each bar is that input's sub-score; the figure is the points it added to the 100-point composite (weight × sub-score).
- Cash flow +14.9/30.0
- DSCR +4.5/10.0
- Livability +3.8/5.0
- Schools +3.2/10.0
- Rent growth +3.0/5.0
- 1% rule +2.9/10.0
- Condition / age +2.5/5.0
- ARV discount +0.0/15.0
- Appreciation +0.0/10.0
$209,900
🖨 Deal sheet (PDF) 📄 Offer letter ✓ Due diligence
Listing remarks MLS
Newly Renovated Beautiful Home location on a corner lot within walking distance to amenities in the area. Enjoy this 3-bedroom 1.5 bath home located in a quiet neighborhood. All new upgrades with new appliances give this home a clean fresh feeling! The home also has an attached two car carport with an attached screen porch to enjoy the quiet afternoons after a long day at work! Call today for your exclusive showing reservation.
Key facts
- Attached carport
- Corner lot
- 0.33 acre lot
Tags
Property features AI
Finance
- HOA & community: No association
Exterior
- Parking: Attached carport (2 spaces); Covered parking; Driveway; Garage present
- Utilities: Public water; Public sewer; Electricity connected; Natural gas connected
- Home design: Site-built single-story home; One level
- Construction: Frame construction with vinyl siding; Architectural shingle roof
- Exterior features: Covered front porch; Covered rear porch; Screened porch; Storage structure on property; Grassed yard
Interior
- Kitchen: Dishwasher; Free-standing electric range; Microwave; Water heater
- Bedrooms: 3 bedrooms (all on the main level)
- Flooring: Carpet; Luxury vinyl
- Bathrooms: 1 full bathroom; 1 half bathroom
- Heating & cooling: No heating system listed; Central electric air conditioning
- Interior features: Kitchen and dining room combination; Insulated windows; Updated/remodeled condition
- Laundry & utility: Laundry located in the carport
Neighborhood map
What this means for you Summary
Snapshot
- This is a 3-bed/1.5-bath single-family listed at $210k.
Deal economics
- At list price, monthly cash flow is $60 ($723/yr) — positive.
- The deal already cash-flows at list — no discount required.
- To meet the 1% rule (rent ≥ 1% of price), the offer needs to be $165k (21.3% below list).
- Recommended offer: $165k (21.3% below list) — sets the bar for 1% rule.
- Cap rate 6.6% vs local median 5.1% in Raeford — meaningfully above typical; check what's discounted (condition, days-on-market, listing class) to confirm the premium yield is real.
Location & tenants
- Location reads 76/100 on livability (#39 in NC, #3,562 nationally) — a middle-class / working-renter tenant base. Strengths: cost of living A+, housing A+, health & safety A+; Watch: amenities D, commute F, employment F.
- Hoke County Schools (suburban): math 35% / reading 40% proficiency, ranked #123 of 178 in NC (top 69%) — families likely to look elsewhere, expect single-tenant / working-renter base with shorter leases.
- Zoned schools: J W Mclauchlin Elementary (math 27% / reading 22%, grade F, #1,112 of 1,410 statewide, top 82%, 304 students, 99% FRL); West Hoke Middle (math 23% / reading 32%, grade F, #368 of 475 statewide, top 78%, 576 students, 100% FRL); Hoke County High (math 42% / reading 44%, grade F, #372 of 535 statewide, top 69%, 2,060 students, 100% FRL) — zoned schools average 99% FRL vs 57% district-wide (42 pts higher); higher-poverty schools than district average — tighter screening recommended.
- Market conditions: Rents rising (+1.9%/yr); 575 active listings in the ZIP; 5 comparable units currently listed for rent nearby; rentals at typical pace (median 25d on market — plan ~3-4 weeks tenant-placement turnaround); 685 units permitted in Hoke County in 2024 (0 in 5+ unit buildings).
Forward outlook
- Local home prices are declining (-3.0%/yr); year-one equity from $1k of loan paydown is wiped out by about $6k of value loss. Plan a longer hold.
- Hoke County population projected at +36% by 2050 — long-run rental-demand tailwind backs the buy-and-hold thesis.
Negotiation context
- Only 11 days on market — expect competitive offers; lowballing is unlikely to land.
- 2 sale attempts with the ask held roughly flat each time — persistent listings suggest the price (not the market) is what's stuck; bring a comps-based counter.
Risks & watch-outs
- Watch-outs: built in 1959 — expect roof / HVAC / electrical / plumbing capex.
- Climate carrying-cost: major wind risk, 75% chance of damaging wind over 30y; major wildfire risk; extreme-heat days projected 7→16/yr by 2055 (HVAC capex compounding) — expect insurance premiums to compound above CPI over the hold.
Questions for the listing agent
- Built in 1959 — when were the roof, HVAC, electrical panel, plumbing, and water heater last replaced?
- Is there a deadline driving the sale (1031 exchange, divorce, estate, relocation)? That informs how much negotiation room exists.
- Schools are D-rated, which usually means shorter tenancies and higher turnover. Who's the typical renter profile here, and what's been the actual vacancy rate?
- The area grade is low — what's the realistic commute time and amenity access for the typical tenant pool here? Any planned neighborhood developments (good or bad) we should know about?
- What's the average days-on-market for RENTAL listings here right now (not sales)? A rising rental-DOM trend means longer vacancies and softer asking-rent achievability than the comps imply.
- What's the recent tenant-quality profile in this submarket — average credit score on applications, eviction rate, late-payment / NSF rate, and stable-employment percentage? A property-management company in the area should have these aggregated.
- How much new for-sale + rental construction is in the pipeline within 1–3 miles? Heavy new supply typically softens prices + rents 12–24 months out; constrained supply supports both.
Investment metrics
- 1% rule
- 0.79% ✗
- Cap rate
- 6.64%
- Cash-on-cash
- 1.23%
- DSCR
- 1.05
- GRM
- 10.6
CMA / ARV
- ARV (on-the-fly)
- $168,192
- Comps found
- 6
Show comp detail 6 sales within ~0.75 mi
| Address | Dist | Beds/Ba | Sqft | Sold | Price | $/sf | Match |
|---|---|---|---|---|---|---|---|
| 211 N Dickson St | 0.17mi | 3/1.0 | 1,134 (-2%) | 3mo | $166,000 | $146 | 85 |
| 210 W Elwood Ave | 0.44mi | 2/1.0 (-1) | 1,124 (-2%) | 6mo | $175,000 | $156 | 64 |
| 419 N Wright St | 0.11mi | 3/1.0 | 1,024 (-11%) | 17mo | $150,000 | $146 | 60 |
| 226 N Dickson St | 0.14mi | 2/1.0 (-1) | 996 (-14%) | 16mo | $156,000 | $157 | 50 |
| 201 S Dickson St | 0.37mi | 3/1.0 | 1,025 (-11%) | 19mo | $79,000 | $77 | 46 |
| 414 W 6th Ave | 0.43mi | 2/1.0 (-1) | 1,026 (-11%) | 20mo | $139,000 | $135 | 38 |
Match score weights: distance 35% · size 25% · config 20% · recency 20%. Top-matched comps best support the ARV.
Projected returns pro-forma
-3.0% appreciation · 1.92% rent growth · sell at horizon
- IRR
- -15.5%
- Equity multiple
- 0.45×
- Total profit
- $-32,051
- Equity at exit
- $31,297
- IRR
- -8.7%
- Equity multiple
- 0.48×
- Total profit
- $-30,507
- Equity at exit
- $18,148
Cash invested: $58,772 (down + closing). Projections, not guarantees.
Landlord ↔ Tenant lean methodology
- Overall (STATE)
- 85 Strongly Landlord-Friendly
- State North Carolina
- 85 Strongly Landlord-Friendly · R+3
- County
- — inherits STATE
- City
- — inherits STATE
ZIP-level market 28376
- Home prices YoY
- -24.0%
- Rents YoY
- 1.9%
- Active inventory
- 575
- Price-to-rent
- 10.6×
Monthly cashflow live
- Estimated rent
- $1,651 high interval (Pro) →
- Mortgage (P&I)
- −$1,101
- Tax from tax record
- −$56 /mo · $672/yr
- Insurance
- −$87
- HOA
- −$0
- Vacancy / Maint / Mgmt
- −$347
- Net cashflow
- $60
Break-even live
Sensitivity live
| Price | -10% $179 | -5% $120 | +0% $60 | +5% $1 | +10% $-59 |
|---|---|---|---|---|---|
| Rent | -10% $-70 | -5% $-5 | +0% $60 | +5% $126 | +10% $191 |
| Rate | -1.0pp $166 | -0.5pp $114 | base $60 | +0.5pp $6 | +1.0pp $-49 |
UW: 25.0% down · 7.5% · 30yr · 1.5% tax · 5.0% vac · 8.0% maint · 8.0% mgmt
Financing live
Cash to close
- Down payment
- $52,475
- Closing costs
- $6,297
- Reserves months
- —
- Total cash needed
- —
Loan-product check · same deal, 3 products live
Conventional
25% down · 7.5% · 30yr
- Down + closing
- —
- Monthly P&I
- —
- Monthly cashflow
- —
- DSCR
- —
- Eligible?
- —
Personal DTI + credit; lowest rate.
DSCR
20% down · 8.5% · 30yr
- Down + closing
- —
- Monthly P&I
- —
- Monthly cashflow
- —
- DSCR
- —
- Eligible?
- —
No personal income docs; deal must DSCR.
Hard money
10% down · 12.0% · 12mo
- Down + closing
- —
- Monthly P&I
- —
- Monthly cashflow
- —
- DSCR
- —
- Eligible?
- —
Short-term bridge; refi at stabilization.
Rent comps 5 comps
| Address | Beds | Baths | Sqft | Rent | $/sqft | DOM | Units | Dist |
|---|---|---|---|---|---|---|---|---|
| 211 N Roberts St Raeford, NC | 2.0 | 1.0 | 965 | $1,475 | $1.53 | 25d | 1 | 0.22mi |
| 110 E 7th Ave Raeford, NC | 2.0 | 2.0 | 1064 | $1,200 | $1.13 | 15d | 1 | 0.76mi |
| 125 Burgess Ln Raeford, NC | 3.0 | 2.5 | 1460 | $1,600 | $1.10 | 25d | 1 | 0.96mi |
| 122 Sherman Ct Unit 122 Raeford, NC | 3.0 | 2.5 | 1400 | $1,600 | $1.14 | 25d | 1 | 0.98mi |
| 503 E 6th Ave Raeford, NC | 2.0 | 1.0 | 744 | $1,100 | $1.48 | 25d | 1 | 1.05mi |
Listing history 11 events
-
2026-06-18status $209,900 Pending 11 DOM
-
2026-06-17days on market $209,900 Active 11 DOM
-
2026-06-16days on market $209,900 Active 10 DOM
-
2026-06-15days on market $209,900 Active 9 DOM
-
2026-06-14days on market $209,900 Active 7 DOM
-
2026-06-13days on market $209,900 Active 6 DOM
-
2026-06-10days on market $209,900 Active 4 DOM
-
2026-06-09days on market $209,900 Active 3 DOM
-
2026-06-08days on market $209,900 Active 2 DOM
-
2026-06-07remarks 699-char remark
-
2026-06-07$209,900 Active 1 DOM
ⓘ Source: listings_history table (triggers on properties + properties_extension) + one-shot
backfill from property_details.listing_events for pre-trigger history.
Tax reassessment forecast NC · Resets to sale price
- Current annual tax
- $672 · $56/mo
- Projected year-2 tax
- $1,721 · $143/mo
- Expected delta
- +$1,049/yr (+$87/mo · 156.2%)
ⓘ Screening estimate from a state-policy table — verify with the county assessor before closing.
Climate risk First Street
- Flood 1/10 Low FEMA zone X (unshaded) · 0% chance over 30 yrs
- Wildfire 6/10 Major
- Heat 7/10 Severe 7 d/yr ≥106°F today · 16 d/yr by 30 yrs out
- Wind 7/10 Severe 75% chance of damaging wind over 30 yrs
- Air quality 1/10 Low 0 unhealthy d/yr today · 0 by 30 yrs out
Nearby sold comps map
Loading sold comps map…
Walkable amenities ~0.75 mi
Loading nearby amenities…
Taxation est. · year 1
- Rental income
- $19,815
- − Mortgage interest
- −$11,758
- − Property taxes
- −$672
- − Insurance
- −$1,050
- − Repairs & maintenance
- −$1,585
- − Management
- −$1,585
- − Depreciation
- −$6,106
- Taxable loss
- −$2,941
- Est. tax savings @ 24.0%
- +$706
- After-tax cash flow
- $1,429/yr
For passive investors: Depreciation is non-cash, so a rental often shows a tax loss while cash-flowing — sheltering income. Rental losses are passive: they offset passive income freely, and up to $25,000/yr can offset ordinary (W-2) income if you actively participate and your MAGI is under $100k (phasing out to $0 by $150k); unused losses carry forward. On sale, claimed depreciation is recaptured at up to 25%, and gains may owe capital-gains tax (a 1031 exchange can defer both). Figures are a year-1 estimate at your 24.0% rate — not tax advice; consult a CPA.
Schools (NCES district)
- District
- Hoke County Schools
- NCES district ID
- 3702250
- Math proficiency
- 35% ▼ -1.00%
- Reading proficiency
- 40% ▲ 1.00%
- Median HH income
- $43,896
- Composite
- 31.82/100
- National rank
- #5880
- State rank
- #123 of 178 in NC
Livability — Raeford
- Score
- 76/100
- State rank
- #39
- US rank
- #3562
Category grades
Schools grade is shown separately in the Schools card above.
Census & demographics
- Census place
- Raeford, NC
- County
- Hoke County · 44,880 people
- City population
- 44,880
- Metro
- Fayetteville, NC
- Population (ZIP)
- 44,880
- Household income
- $66,471
- Rent vs Own
- Severe rent burden
- 897.0
Population outlook (Hoke County) Hauer SSP2
- Today (2025)
- 63,354 people
- By 2030
- 68,361 · +7.9%
- By 2040
- 78,074 · +23.2%
- By 2050
- 86,384 · +36.4%
- By 2075
- 99,517 · +57.1%
- By 2100
- 98,939 · +56.2%
Race, ethnicity, and origin ACS 2023
- Neighborhood character
- Highly diverse neighborhood (Simpson 0.71)
- Race & ethnicity
- White 38% Black 35% Hispanic / Latino 15% Two or more races 9% Native American 3% Asian 1%
- Hispanic origin (detail)
- Mexican 7% Puerto Rican 4%
- Common ancestry
- Slovak 2% Romanian 1% Italian 1%
- Foreign-born
- 6% · Canada, Vietnam
- Languages at home
- 89% English-only · Spanish 8% French/Haitian/Cajun 1%
Political lean MEDSL · Hoke
- 2024 margin
- Lean D (+5.9) · D 52.4% · R 46.4% · Other 1.2%
- 2008→2024 swing
- -12.8pp toward R · 2008: 18.8pp · 2024: 5.9pp
- All cycles
- 2024: D+5.9 2020: D+10.9 2016: D+10.8 2012: D+19.0 2008: D+18.8
Not yet ingested
- Civics
- —
Market trends
- HPI YoY
- ▼ -53.30%
- Current HPI
- 169.1801
- Rent YoY
- ▲ 1.92%
- Metro
- Fayetteville, NC
- State GDP YoY
- ▲ 3.28%
- F500 in state
- 26
Industry mix (Fortune 500 HQ in NC)
| Industry | F500 HQs | Revenue |
|---|---|---|
| Financial Services | 2 | $213B |
|
||
| Retail | 2 | $95B |
|
||
| Industrial Conglomerate | 1 | $38B |
|
||
| Metals / Steel | 1 | $35B |
|
||
| Utilities | 1 | $30B |
|
||
| Industrial Machinery | 1 | $19B |
|
||
Price history
+0.0% since first listed2 events — show timeline
- 2026-06-05 Listed $209,900 TMLS
- 2026-06-05 Listed $209,900 Hive MLS
Property tax history
+2.1%/yrLatest (2025): $672 · +0.0% YoY. Source: county tax records.
Cash-flow waterfall
monthlySold comps — $/sqft
last 12 mo · ≤1 miLoading sold comps…