 Duplex
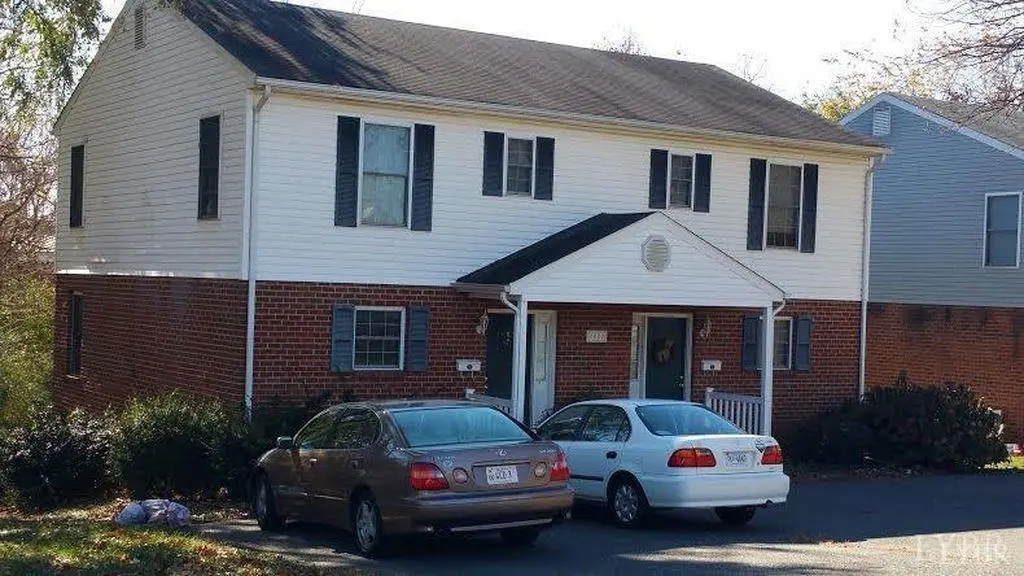
6000 Igloe Dr · Lynchburg, VA
Flood risk 1/10 · Minimal
- FEMA flood zone
- X (unshaded)
- Chance of flooding over 30 yrs
- 0.0%
- Est. flood insurance / yr
- $473 – $860
Fire risk 2/10 · Minimal
- Est. fire insurance / yr
- $666 – $1,236
Heat risk 6/10 · Moderate
- Hot days now (above 101°F)
- 7 days/yr
- Hot days in 30 yrs
- 18 days/yr
Wind risk 2/10 · Minimal
- Chance of severe wind over 30 yrs
- 3.0%
Air-quality risk 2/10 · Minimal
- Unhealthy air days now
- 0 days/yr
- Unhealthy air days in 30 yrs
- 1 days/yr
Risk factors via First Street. Map © Google.
Why this score? — see what drove the C grade
The composite is a weighted blend of 9 inputs, each scored 0–100. Each bar is that input's sub-score; the figure is the points it added to the 100-point composite (weight × sub-score).
- Cash flow +22.4/30.0
- ARV discount +7.5/15.0
- DSCR +7.2/10.0
- 1% rule +5.1/10.0
- Livability +4.5/5.0
- Schools +4.0/10.0
- Rent growth +3.8/5.0
- Condition / age +2.5/5.0
- Appreciation +0.0/10.0
$309,900
🖨 Deal sheet 📄 Offer letter ✓ Due diligence
Multi-family units
County records classify this as Multi-Family (2-4 Unit). Listing-text estimate: 2 units. confirmed
Listing remarks MLS
Great RETURN ON INVESTMENT!! Lots of updates, it's practically like buying new construction. Brick exterior and vinyl windows, large 2 bedroom, 1 1/2 bath units- this maintenance free duplex is very desirable. Each unit has a basement, in one side the basement has been finished and is currently used as an additional bedroom and the other side could be finished very easily. Both sides have their own electric meters however the current owner pays water. Each are currently rented ($756/mo side A, $735/mo side B. ) Please call to schedule your showing.
Key facts
- 8,146 sq ft lot
- Built 1996
- Listed 15 days
Property features AI
Finance
- Financial info: Annual property tax around $1,170
Exterior
- Home design: Multi-family residential income property
- Construction: Brick and vinyl siding exterior
- Exterior features: Approximately 0.187-acre lot; Directions: Fort Ave, left on Sandusky, immediate left on Igloe
Interior
- Bedrooms: Each unit has 2 bedrooms
- Interior features: Two 2-bedroom units
Neighborhood map
What this means for you Summary
Snapshot
- This is a 2 × 2-bed/1-bath units multifamily listed at $310k.
Deal economics
- At list price, monthly cash flow is $515 ($6k/yr) — positive. Per door: $258/mo.
- The deal already cash-flows at list — no discount required.
- Meets the 1% rule at list price ($3k rent vs $310k).
- Recommended offer: $305k (1.5% below list) — sets the bar for market timing.
- Cap rate 8.3% vs local median 4.0% in Lynchburg — top-decile yield for the area; either an underpriced asset or a hidden risk that comps aren't pricing in. Stress-test before assuming the spread holds.
Location & tenants
- Location reads 91/100 on livability (#1 in VA, #58 nationally) — a professional / high-income tenant draw. Strengths: amenities A+, commute A+, cost of living A+; Watch: crime C-, employment D+.
- Lynchburg City Public School District (urban): math 36% / reading 61% proficiency, ranked #104 of 131 in VA (top 79%) — families likely to look elsewhere, expect single-tenant / working-renter base with shorter leases; 61% free/reduced lunch — lower-income household profile, screen leases tightly.
- Zoned schools: Sandusky Elementary (math 47% / reading 67%, grade C+, #597 of 1,108 statewide, top 57%, 352 students, 91% FRL); Sandusky Middle (math 29% / reading 52%, grade F, #303 of 342 statewide, top 89%, 568 students, 96% FRL); Heritage High (math 32% / reading 77%, grade C-, #281 of 319 statewide, top 90%, 1,073 students, 94% FRL) — zoned schools average 94% FRL vs 61% district-wide (33 pts higher); higher-poverty schools than district average — tighter screening recommended.
- Market conditions: Rents rising fast (+5.1%/yr); 318 active listings in the ZIP; 8 comparable units currently listed for rent nearby; rentals lingering (median 44d on market — plan ~5-8 weeks vacancy on turnover, expect pricing pressure); 50% of comp listings sitting > 30 days — soft ceiling on asking rent; 472 units permitted in Lynchburg city in 2024 (240 in 5+ unit buildings).
- At $3,119/mo this rent would consume 54% of the median local household income ($69k/yr) (locally 1774% of renters already pay >50% of income on rent) — very limited rent-growth headroom before tenants either downsize or default.
Forward outlook
- Local home prices are declining (-3.0%/yr); year-one equity from $2k of loan paydown is wiped out by about $9k of value loss. Plan a longer hold.
- Lynchburg County population projected at +37% by 2050 — long-run rental-demand tailwind backs the buy-and-hold thesis.
Negotiation context
- It's been on market 16 days — a 2% lower offer ($305k) is reasonable based on typical stale-listing flexibility.
- 2 sale attempts since 10y ago with the ask held roughly flat each time — persistent listings suggest the price (not the market) is what's stuck; bring a comps-based counter.
- Current owner paid $165k; list at $310k implies a 88% gain — meaningful room to come down on a strong offer.
Risks & watch-outs
- Climate carrying-cost: extreme-heat days projected 7→18/yr by 2055 (HVAC capex compounding) — expect insurance premiums to compound above CPI over the hold.
Questions for the listing agent
- Can we see the unit-by-unit rent roll, current vacancy, and any below-market leases? What's the average tenancy length?
- What capital expenditures (roof, boiler, parking lot, exteriors) have been made in the last 5 years, and what's planned in the next 2?
- Is there a deadline driving the sale (1031 exchange, divorce, estate, relocation)? That informs how much negotiation room exists.
- Schools are A-rated — typically a magnet for longer-tenancy family renters. What's the average tenant stay here, and is there a school-zone premium baked into asking?
- What's the average days-on-market for RENTAL listings here right now (not sales)? A rising rental-DOM trend means longer vacancies and softer asking-rent achievability than the comps imply.
- What's the recent tenant-quality profile in this submarket — average credit score on applications, eviction rate, late-payment / NSF rate, and stable-employment percentage? A property-management company in the area should have these aggregated.
- How much new apartment / multifamily construction is in the pipeline within 1–3 miles? Heavy new supply (>2% of stock underway) typically softens rents 12–24 months out; light construction supports rent growth.
Investment metrics
- 1% rule
- 1.01% ✓
- Cap rate
- 8.29%
- Cash-on-cash
- 7.13%
- DSCR
- 1.32
- GRM
- 8.3
CMA / ARV
No comps found within radius.
Projected returns pro-forma
-3.0% appreciation · 5.11% rent growth · sell at horizon
- IRR
- -3.2%
- Equity multiple
- 0.88×
- Total profit
- $-10,701
- Equity at exit
- $46,207
- IRR
- 8.5%
- Equity multiple
- 1.71×
- Total profit
- $61,628
- Equity at exit
- $26,794
Cash invested: $86,772 (down + closing). Projections, not guarantees.
Landlord ↔ Tenant lean methodology
- Overall (STATE)
- 55 Moderately Landlord-Leaning
- State Virginia
- 55 Moderately Landlord-Leaning · D+2
- County
- — inherits STATE
- City
- — inherits STATE
ZIP-level market 24502
- Rents YoY
- 5.1%
- Active inventory
- 318
- Price-to-rent
- 16.6×
Monthly cashflow live
- Estimated rent
- $3,119 high interval (Pro) →
- Mortgage (P&I)
- −$1,625
- Tax from tax record
- −$194 /mo · $2,332/yr
- Insurance
- −$129
- HOA
- −$0
- Vacancy / Maint / Mgmt
- −$655
- Net cashflow
- $515
Break-even live
2-unit breakdown (identical units grouped — click to expand)
| Units | Beds | Baths | Est. rent |
|---|---|---|---|
| 2× units | 2 | 1 | $3,120 |
| #1 | 2 | 1 | $1,560 |
| #2 | 2 | 1 | $1,560 |
| Total (2 units) | $3,119 | ||
UW: 25.0% down · 7.5% · 30yr · 1.5% tax · 5.0% vac · 8.0% maint · 8.0% mgmt
Financing live
Cash to close
- Down payment
- $77,475
- Closing costs
- $9,297
- Reserves months
- —
- Total cash needed
- —
Loan-product check · same deal, 3 products live
Conventional
25% down · 7.5% · 30yr
- Down + closing
- —
- Monthly P&I
- —
- Monthly cashflow
- —
- DSCR
- —
- Eligible?
- —
Personal DTI + credit; lowest rate.
DSCR
20% down · 8.5% · 30yr
- Down + closing
- —
- Monthly P&I
- —
- Monthly cashflow
- —
- DSCR
- —
- Eligible?
- —
No personal income docs; deal must DSCR.
Hard money
10% down · 12.0% · 12mo
- Down + closing
- —
- Monthly P&I
- —
- Monthly cashflow
- —
- DSCR
- —
- Eligible?
- —
Short-term bridge; refi at stabilization.
Rent comps 8 comps
| Address | Beds | Baths | Sqft | Rent | $/sqft | DOM | Units | Dist |
|---|---|---|---|---|---|---|---|---|
| 913 Sandusky Dr Lynchburg, VA | 4.0 | 3.0 | 2200 | $2,200 | $1.00 | 13d | 1 | 0.26mi |
| 1116 Chestnut Hill Dr Lynchburg, VA | 4.0 | 2.0 | 1818 | $1,895 | $1.04 | 44d | 1 | 0.57mi |
| 1116 Chestnut Hill Dr Lynchburg, VA | 4.0 | 2.0 | 1818 | $2,095 | $1.15 | 13d | 1 | 0.57mi |
| 6048 Rhonda Rd Lynchburg, VA | 3.0 | 3.0 | 2932 | $2,450 | $0.84 | 13d | 1 | 1.07mi |
| 104 Tulane St Lynchburg, VA | 5.0 | 3.0 | 2764 | $2,400 | $0.87 | 13d | 1 | 1.19mi |
| 4624 Ferncliff Dr Lynchburg, VA | 3.0 | 2.0 | 2064 | $1,700 | $0.82 | 44d | 1 | 1.25mi |
| 1600 Wards Ferry Rd #907 Lynchburg, VA | 4.0 | 2.5 | 1782 | $1,895 | $1.06 | 44d | 1 | 1.39mi |
| 7222 Richland Dr Lynchburg, VA | 4.0 | 2.0 | 2164 | $1,950 | $0.90 | 44d | 1 | 1.48mi |
Listing history 13 events
-
2026-06-19days on market $309,900 Active 16 DOM
-
2026-06-18days on market $309,900 Active 15 DOM
-
2026-06-17days on market $309,900 Active 14 DOM
-
2026-06-16days on market $309,900 Active 13 DOM
-
2026-06-15days on market $309,900 Active 12 DOM
-
2026-06-14days on market $309,900 Active 10 DOM
-
2026-06-13days on market $309,900 Active 9 DOM
-
2026-06-10days on market $309,900 Active 7 DOM
-
2026-06-09days on market $309,900 Active 6 DOM
-
2026-06-08days on market $309,900 Active 5 DOM
-
2026-06-07days on market $309,900 Active 4 DOM
-
2026-06-03remarks 222-char remark
-
2026-06-03$309,900 Active 1 DOM
ⓘ Source: listings_history table (triggers on properties + properties_extension) + one-shot
backfill from property_details.listing_events for pre-trigger history.
Tax reassessment forecast VA · Resets to sale price
- Current annual tax
- $2,332 · $194/mo
- Projected year-2 tax
- $2,541 · $212/mo
- Expected delta
- +$209/yr (+$17/mo · 9.0%)
ⓘ Screening estimate from a state-policy table — verify with the county assessor before closing.
Climate risk First Street
- Flood 1/10 Low FEMA zone X (unshaded) · 0% chance over 30 yrs
- Wildfire 2/10 Low
- Heat 6/10 Major 7 d/yr ≥101°F today · 18 d/yr by 30 yrs out
- Wind 2/10 Low 3% chance of damaging wind over 30 yrs
- Air quality 2/10 Low 0 unhealthy d/yr today · 1 by 30 yrs out
Nearby sold comps map
Loading sold comps map…
Walkable amenities ~0.75 mi
Loading nearby amenities…
Taxation est. · year 1
- Rental income
- $37,428
- − Mortgage interest
- −$17,359
- − Property taxes
- −$2,332
- − Insurance
- −$1,550
- − Repairs & maintenance
- −$2,994
- − Management
- −$2,994
- − Depreciation
- −$9,015
- Taxable income
- $1,184
- Est. tax owed @ 24.0%
- −$284
- After-tax cash flow
- $5,901/yr
For passive investors: Depreciation is non-cash, so a rental often shows a tax loss while cash-flowing — sheltering income. Rental losses are passive: they offset passive income freely, and up to $25,000/yr can offset ordinary (W-2) income if you actively participate and your MAGI is under $100k (phasing out to $0 by $150k); unused losses carry forward. On sale, claimed depreciation is recaptured at up to 25%, and gains may owe capital-gains tax (a 1031 exchange can defer both). Figures are a year-1 estimate at your 24.0% rate — not tax advice; consult a CPA.
Schools (NCES district)
- District
- Lynchburg City Public School District
- NCES district ID
- 5102340
- Math proficiency
- 36% ▼ -38.00%
- Reading proficiency
- 61% ▼ -8.00%
- Median HH income
- $39,097
- Composite
- 40.4/100
- National rank
- #3730
- State rank
- #104 of 131 in VA
Livability — Lynchburg
- Score
- 91/100
- State rank
- #1
- US rank
- #58
Category grades
Schools grade is shown separately in the Schools card above.
Census & demographics
- Census place
- Lynchburg, VA
- County
- Lynchburg City · 97,036 people
- City population
- 97,036
- Metro
- Lynchburg, VA
- Population (ZIP)
- 41,979
- Household income
- $68,872
- Rent vs Own
- Severe rent burden
- 1774.0
Population outlook (Lynchburg County) Hauer SSP2
- Today (2025)
- 87,977 people
- By 2030
- 93,626 · +6.4%
- By 2040
- 106,145 · +20.7%
- By 2050
- 120,783 · +37.3%
- By 2075
- 162,249 · +84.4%
- By 2100
- 191,358 · +117.5%
Race, ethnicity, and origin ACS 2023
- Neighborhood character
- Predominantly White (68%)
- Race & ethnicity
- White 68% Black 19% Two or more races 6% Hispanic / Latino 6% Asian 2%
- Hispanic origin (detail)
- Mexican 2%
- Common ancestry
- Slovak 3% Italian 2% Lithuanian 2%
- Foreign-born
- 6% · Canada, South Korea, United Kingdom
- Languages at home
- 91% English-only · Spanish 4% Other Indo-European 1% Other Asian/Pacific 1%
Political lean MEDSL · Lynchburg
- 2024 margin
- Lean R (+7.9) · D 45.4% · R 53.3% · Other 1.3%
- 2008→2024 swing
- -3.9pp toward R · 2008: -4.0pp · 2024: -7.9pp
- All cycles
- 2024: R+7.9 2020: D+2.6 2016: R+9.0 2012: R+10.6 2008: R+4.0
Not yet ingested
- Civics
- —
Market trends
- HPI YoY
- ▼ -222.79%
- Current HPI
- 241.9041
- Rent YoY
- ▲ 5.11%
- Metro
- Lynchburg, VA
- State GDP YoY
- ▲ 2.40%
- F500 in state
- 50
Industry mix (Fortune 500 HQ in VA)
| Industry | F500 HQs | Revenue |
|---|---|---|
| Aerospace / Defense | 4 | $236B |
|
||
| Technology / Defense | 3 | $32B |
|
||
| Financial Services | 2 | $176B |
|
||
| Utilities | 2 | $27B |
|
||
| Insurance | 2 | $25B |
|
||
| Technology | 2 | $15B |
|
||
Price history
+153.0% since first listed6 events — show timeline
- 2026-06-03 Listed $309,900 LMLS
- 2017-03-01 Sold (MLS) $164,900 LMLS
- 2017-02-24 Sold (Public Records) $164,900 Public Records
- 2016-11-21 Listed $169,900 LMLS
- 2001-08-07 Sold (Public Records) $131,000 Public Records
- 2000-02-01 Sold (Public Records) $122,500 Public Records
Property tax history
+2.4%/yrLatest (2025): $2,332 · +8.6% YoY. Source: county tax records.
Cash-flow waterfall
monthlySold comps — $/sqft
last 12 mo · ≤1 miLoading sold comps…