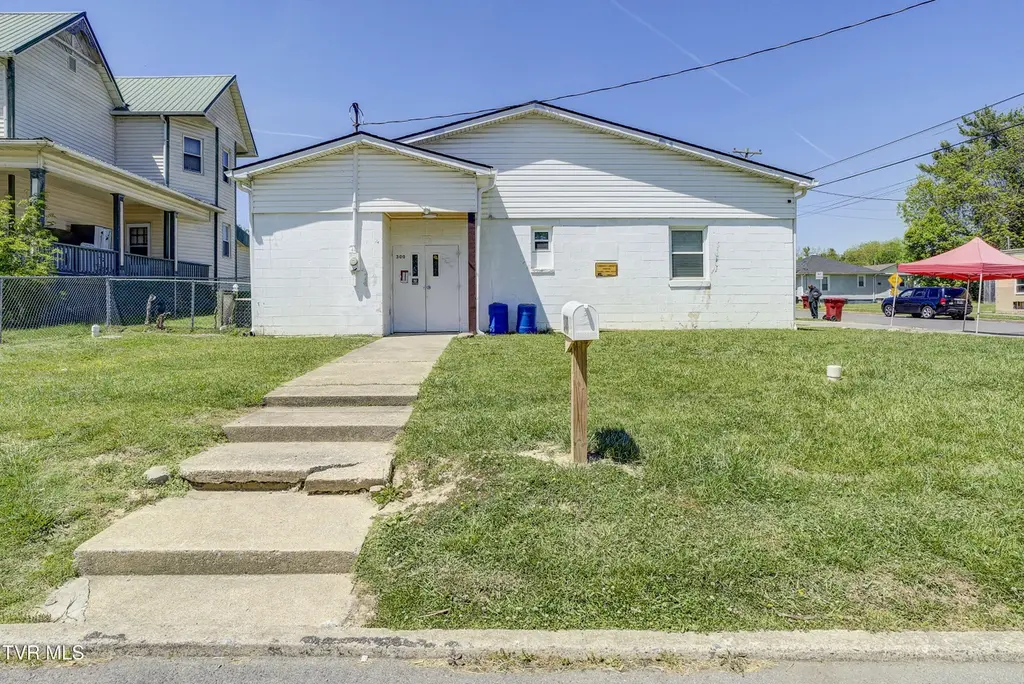
300 Chilhowie Ave · Johnson City, TN
Flood risk No data
- FEMA flood zone
- —
- Chance of flooding over 30 yrs
- —
- Est. flood insurance / yr
- —
Fire risk No data
- Est. fire insurance / yr
- —
Heat risk No data
- Hot days now (above threshold)
- —
- Hot days in 30 yrs
- —
Wind risk No data
- Chance of severe wind over 30 yrs
- —
Air-quality risk No data
- Unhealthy air days now
- —
- Unhealthy air days in 30 yrs
- —
Risk factors via First Street. Map © Google.
Why this score? — see what drove the B grade
The composite is a weighted blend of 9 inputs, each scored 0–100. Each bar is that input's sub-score; the figure is the points it added to the 100-point composite (weight × sub-score).
- Cash flow +27.7/30.0
- ARV discount +15.0/15.0
- DSCR +9.7/10.0
- 1% rule +7.6/10.0
- Schools +3.9/10.0
- Livability +3.8/5.0
- Rent growth +2.9/5.0
- Condition / age +2.2/5.0
- Appreciation +0.0/10.0
$199,000
🖨 Deal sheet (PDF) 📄 Offer letter ✓ Due diligence
Listing remarks
Unlock the potential of 300 West Chilhowie Avenue in Johnson City, TN--a versatile residential/commercial property in a highly convenient location. Currently operated by a nonprofit organization serving the community daily, this unique property is well-suited for a variety of future uses. Whether you're envisioning a continued nonprofit mission, a church, professional office space, or a conversion into a multi-family residence, the flexible layout provides the perfect foundation to bring your vision to life. Inside, you'll find a spacious kitchen complemented by a large pantry, along with expansive interior areas that can be adapted for multiple purposes. The generous square footage allows
Key facts
- Flexible layout
- Spacious kitchen
- Large pantry
Tags
Property features AI
Finance
- Other: Zoning: R2C; Lot roughly 0.24 acres (about 78 x 135)
Exterior
- Parking: Driveway; Parking pad
- Utilities: Public water; Public sewer; Electricity connected
- Home design: Mixed use structure; Single-family residential property; One level
- Construction: Block and vinyl siding construction; Other construction materials
- Exterior features: Shingle roof; Level topography
Interior
- Kitchen: Convection oven; Microwave; Refrigerator
- Bathrooms: 1 full bathroom; 1 half bathroom
- Heating & cooling: Central heating; Heat pump; Central air conditioning; Heat pump cooling
- Interior features: Convection oven; Microwave; Refrigerator; 7 total rooms
Neighborhood map
What this means for you Summary
Snapshot
- This is a 3-bed/1.5-bath single-family listed at $199k. Condition is rated fair.
Deal economics
- At list price, monthly cash flow is $599 ($7k/yr) — positive.
- The deal already cash-flows at list — no discount required.
- Meets the 1% rule at list price ($2k rent vs $199k).
- Recommended offer: $193k (3.0% below list) — sets the bar for market timing.
- Cap rate 9.9% vs local median 3.1% in Johnson City — top-decile yield for the area; either an underpriced asset or a hidden risk that comps aren't pricing in. Stress-test before assuming the spread holds.
Location & tenants
- Location reads 76/100 on livability (#8 in TN, #3,349 nationally) — a middle-class / working-renter tenant base. Strengths: amenities A+, cost of living A+, health & safety A; Watch: crime D, commute F, employment F.
- Johnson City (urban): math 46% / reading 47% proficiency, ranked #9 of 139 in TN (top 6%) — families likely to look elsewhere, expect single-tenant / working-renter base with shorter leases.
- Zoned schools: North Side Elementary (math 32% / reading 37%, grade F, #319 of 952 statewide, top 37%, 375 students, 0% FRL); Liberty Bell Middle School (math 43% / reading 38%, grade F, #42 of 333 statewide, top 13%, 898 students, 0% FRL); Science Hill High School (math 37% / reading 60%, grade D, #13 of 332 statewide, top 4%, 2,401 students, 0% FRL) — zoned schools average 0% FRL vs 44% district-wide (44 pts lower); this property's tenant base skews higher-income than the district average.
- Market conditions: Rents rising (+1.5%/yr); 208 active listings in the ZIP; 3 comparable units currently listed for rent nearby; rentals lingering (median 46d on market — plan ~5-8 weeks vacancy on turnover, expect pricing pressure); 67% of comp listings sitting > 30 days — soft ceiling on asking rent; 1,155 units permitted in Washington County in 2024 (437 in 5+ unit buildings).
- At $2,499/mo this rent would consume 57% of the median local household income ($52k/yr) (locally 2254% of renters already pay >50% of income on rent) — very limited rent-growth headroom before tenants either downsize or default.
Forward outlook
- Local home prices are declining (-3.0%/yr); year-one equity from $1k of loan paydown is wiped out by about $6k of value loss. Plan a longer hold.
- Washington County population projected at +9% by 2050 — modest demand growth; plan on rents tracking national, not racing it.
Negotiation context
- It's been on market 58 days — a 3% lower offer ($193k) is reasonable based on typical stale-listing flexibility.
Risks & watch-outs
- Watch-outs: built in 1956 — expect roof / HVAC / electrical / plumbing capex.
Questions for the listing agent
- It's been on market 58 days. Have you received any prior offers? Is the seller open to a 3% concession, seller financing, or rate buy-down credit?
- Have any recent inspections been done? Can we get a copy of the seller's disclosures and any deferred-maintenance estimates?
- Built in 1956 — when were the roof, HVAC, electrical panel, plumbing, and water heater last replaced?
- Is there a deadline driving the sale (1031 exchange, divorce, estate, relocation)? That informs how much negotiation room exists.
- Crime grade is D in this area — have there been break-ins, vandalism, or insurance claims at this property in the last 3 years? What carrier currently insures it and at what premium?
- What's the average days-on-market for RENTAL listings here right now (not sales)? A rising rental-DOM trend means longer vacancies and softer asking-rent achievability than the comps imply.
- What's the recent tenant-quality profile in this submarket — average credit score on applications, eviction rate, late-payment / NSF rate, and stable-employment percentage? A property-management company in the area should have these aggregated.
- How much new for-sale + rental construction is in the pipeline within 1–3 miles? Heavy new supply typically softens prices + rents 12–24 months out; constrained supply supports both.
Investment metrics
- 1% rule
- 1.26% ✓
- Cap rate
- 9.91%
- Cash-on-cash
- 12.91%
- DSCR
- 1.57
- GRM
- 6.6
CMA / ARV
- ARV (median comp)
- $354,088
- List price
- $199,000
- Delta
- -43.80%
- Verdict
- UNDERPRICED
- Comps
- 20 within 1.0 mi
Show comp detail 9 sales within ~0.75 mi
| Address | Dist | Beds/Ba | Sqft | Sold | Price | $/sf | Match |
|---|---|---|---|---|---|---|---|
| 219 Gilmer Park | 0.29mi | 4/3.0 (+1) | 2,469 (+1%) | 1mo | $375,000 | $152 | 73 |
| 119 W Holston Avenue Ave | 0.16mi | 3/2.0 | 2,352 (-4%) | 15mo | $343,500 | $146 | 71 |
| 106 11th Ave | 0.36mi | 3/2.5 | 2,556 (+4%) | 24mo | $405,000 | $158 | 52 |
| 320 Baron Dr | 0.60mi | 3/2.0 | 2,513 (+3%) | 22mo | $490,000 | $195 | 48 |
| 314 Lamont St | 0.53mi | 4/2.5 (+1) | 2,180 (-11%) | 2mo | $350,000 | $161 | 47 |
| 1005 Baxter St | 0.65mi | 4/1.5 (+1) | 2,519 (+3%) | 20mo | $185,000 | $73 | 44 |
| 118 Belmeade Cir | 0.57mi | 4/2.5 (+1) | 2,673 (+9%) | 14mo | $467,000 | $175 | 38 |
| 800 Baxter St | 0.67mi | 4/3.0 (+1) | 2,319 (-5%) | 15mo | $315,000 | $136 | 36 |
| 611 Hillcrest Dr | 0.49mi | 3/3.0 | 2,800 (+14%) | 23mo | $399,900 | $143 | 28 |
Match score weights: distance 35% · size 25% · config 20% · recency 20%. Top-matched comps best support the ARV.
Projected returns pro-forma
-3.0% appreciation · 1.51% rent growth · sell at horizon
- IRR
- 1.1%
- Equity multiple
- 1.04×
- Total profit
- $2,271
- Equity at exit
- $29,672
- IRR
- 9.2%
- Equity multiple
- 1.66×
- Total profit
- $36,579
- Equity at exit
- $17,206
Cash invested: $55,720 (down + closing). Projections, not guarantees.
Landlord ↔ Tenant lean methodology
- Overall (STATE)
- 87 Strongly Landlord-Friendly
- State Tennessee
- 87 Strongly Landlord-Friendly · R+13
- County
- — inherits STATE
- City
- — inherits STATE
ZIP-level market 37604
- Home prices YoY
- -26.1%
- Rents YoY
- 1.5%
- Active inventory
- 208
- Price-to-rent
- 6.6×
Monthly cashflow live
- Estimated rent
- $2,499 medium interval (Pro) →
- Mortgage (P&I)
- −$1,044
- Tax est. 1.5%
- −$249 /mo · $2,985/yr
- Insurance
- −$83
- HOA
- −$0
- Vacancy / Maint / Mgmt
- −$525
- Net cashflow
- $599
Break-even live
Sensitivity live
| Price | -10% $737 | -5% $668 | +0% $599 | +5% $531 | +10% $462 |
|---|---|---|---|---|---|
| Rent | -10% $402 | -5% $501 | +0% $599 | +5% $698 | +10% $797 |
| Rate | -1.0pp $700 | -0.5pp $650 | base $599 | +0.5pp $548 | +1.0pp $495 |
UW: 25.0% down · 7.5% · 30yr · 1.5% tax · 5.0% vac · 8.0% maint · 8.0% mgmt
Financing live
Cash to close
- Down payment
- $49,750
- Closing costs
- $5,970
- Reserves months
- —
- Total cash needed
- —
Loan-product check · same deal, 3 products live
Conventional
25% down · 7.5% · 30yr
- Down + closing
- —
- Monthly P&I
- —
- Monthly cashflow
- —
- DSCR
- —
- Eligible?
- —
Personal DTI + credit; lowest rate.
DSCR
20% down · 8.5% · 30yr
- Down + closing
- —
- Monthly P&I
- —
- Monthly cashflow
- —
- DSCR
- —
- Eligible?
- —
No personal income docs; deal must DSCR.
Hard money
10% down · 12.0% · 12mo
- Down + closing
- —
- Monthly P&I
- —
- Monthly cashflow
- —
- DSCR
- —
- Eligible?
- —
Short-term bridge; refi at stabilization.
Rent comps 3 comps
| Address | Beds | Baths | Sqft | Rent | $/sqft | DOM | Units | Dist |
|---|---|---|---|---|---|---|---|---|
| 200 E Main St Unit 500 Johnson City, TN | 4.0 | 3.5 | 3070 | $3,650 | $1.19 | 46d | 1 | 0.64mi |
| 901 Johnson Ave Johnson City, TN | 3.0 | 2.0 | 1670 | $1,850 | $1.11 | 23d | 1 | 0.81mi |
| 1509 Virginia St Johnson City, TN | 3.0 | 2.0 | 1702 | $2,200 | $1.29 | 46d | 1 | 1.45mi |
Listing history 18 events
-
2026-06-21days on market $199,000 Active 58 DOM
-
2026-06-19days on market $199,000 Active 56 DOM
-
2026-06-18days on market $199,000 Active 55 DOM
-
2026-06-17days on market $199,000 Active 54 DOM
-
2026-06-17price $199,000 Active 53 DOM
-
2026-06-16days on market $225,000 Active 53 DOM
-
2026-06-15days on market $225,000 Active 52 DOM
-
2026-06-14days on market $225,000 Active 50 DOM
-
2026-06-13days on market $225,000 Active 49 DOM
-
2026-06-10days on market $225,000 Active 47 DOM
-
2026-06-09days on market $225,000 Active 46 DOM
-
2026-06-08days on market $225,000 Active 45 DOM
-
2026-06-07days on market $225,000 Active 44 DOM
-
2026-06-02days on market $225,000 Active 39 DOM
-
2026-06-01days on market $225,000 Active 38 DOM
-
2026-05-31pricedays on market $225,000 Active 37 DOM
-
2026-05-30days on market $250,000 Active 36 DOM
-
2026-04-24$250,000 Active 1561-char remark
ⓘ Source: listings_history table (triggers on properties + properties_extension) + one-shot
backfill from property_details.listing_events for pre-trigger history.
Nearby sold comps map
Loading sold comps map…
Walkable amenities ~0.75 mi
Loading nearby amenities…
Taxation est. · year 1
- Rental income
- $29,994
- − Mortgage interest
- −$11,147
- − Property taxes
- −$2,985
- − Insurance
- −$995
- − Repairs & maintenance
- −$2,399
- − Management
- −$2,399
- − Depreciation
- −$5,789
- Taxable income
- $4,278
- Est. tax owed @ 24.0%
- −$1,027
- After-tax cash flow
- $6,165/yr
For passive investors: Depreciation is non-cash, so a rental often shows a tax loss while cash-flowing — sheltering income. Rental losses are passive: they offset passive income freely, and up to $25,000/yr can offset ordinary (W-2) income if you actively participate and your MAGI is under $100k (phasing out to $0 by $150k); unused losses carry forward. On sale, claimed depreciation is recaptured at up to 25%, and gains may owe capital-gains tax (a 1031 exchange can defer both). Figures are a year-1 estimate at your 24.0% rate — not tax advice; consult a CPA.
Condition & rehab AI · 12 photos
This property requires moderate rehabilitation to improve its condition and increase its value. Repairs to the exterior siding, driveway, and interior walls are necessary to bring it up to a fair condition.
Repairs flagged
- Major exterior siding — Significant wear and tear
- Major concrete driveway — Cracks and unevenness
- Major interior walls — Worn paint and potential structural issues
Value-add opportunities
- Both repair exterior siding — Enhances curb appeal and property value
- Both repair concrete driveway — Improves accessibility and property value
- Both paint interior walls — Enhances interior aesthetics and property value
Renovation cost estimate screening
| Repair item | Severity | Est. cost |
|---|---|---|
| exterior siding · Significant wear and tear | Major | $15,000–50,000 |
| concrete driveway · Cracks and unevenness | Major | $15,000–50,000 |
| interior walls · Worn paint and potential structural issues | Major | $15,000–50,000 |
| Total estimated repair cost · 3 items | $45,000–150,000 |
Value-add ROI direction
- Both repair exterior siding — Enhances curb appeal and property value ↑
- Both repair concrete driveway — Improves accessibility and property value ↑
- Both paint interior walls — Enhances interior aesthetics and property value ↑
ⓘ Cost ranges are severity-bucket heuristics (US national rule-of-thumb). Get contractor quotes + a written scope before underwriting a rehab budget.
Schools (NCES district)
- District
- Johnson City
- NCES district ID
- 4702130
- Math proficiency
- 46% ▼ -14.00%
- Reading proficiency
- 47% ▼ -2.00%
- Median HH income
- $37,514
- Composite
- 38.69/100
- National rank
- #4143
- State rank
- #9 of 139 in TN
Livability — Johnson City
- Score
- 76/100
- State rank
- #8
- US rank
- #3349
Category grades
Schools grade is shown separately in the Schools card above.
Census & demographics
- Census place
- Johnson City, TN
- County
- Washington County · 129,006 people
- City population
- 99,926
- Metro
- Johnson City, TN
- Population (ZIP)
- 39,097
- Household income
- $52,345
- Rent vs Own
- Severe rent burden
- 2254.0
Population outlook (Washington County) Hauer SSP2
- Today (2025)
- 132,816 people
- By 2030
- 135,823 · +2.3%
- By 2040
- 140,897 · +6.1%
- By 2050
- 145,073 · +9.2%
- By 2075
- 156,386 · +17.7%
- By 2100
- 159,893 · +20.4%
Race, ethnicity, and origin ACS 2023
- Neighborhood character
- Predominantly White (83%)
- Race & ethnicity
- White 83% Hispanic / Latino 6% Black 6% Two or more races 5% Asian 1%
- Hispanic origin (detail)
- Mexican 3%
- Common ancestry
- Slovak 3% Serbian 3% Italian 3%
- Foreign-born
- 4% · Canada
- Languages at home
- 94% English-only · Spanish 4% Other Indo-European 1%
Political lean MEDSL · Washington
- 2024 margin
- Solid R (+39.5) · D 29.6% · R 69.1% · Other 1.3%
- 2008→2024 swing
- -6.0pp toward R · 2008: -33.5pp · 2024: -39.5pp
- All cycles
- 2024: R+39.5 2020: R+36.2 2016: R+42.9 2012: R+38.5 2008: R+33.5
Not yet ingested
- Civics
- —
Market trends
- HPI YoY
- ▼ -97.73%
- Current HPI
- 277.1137
- Rent YoY
- ▲ 1.51%
- Metro
- Johnson City, TN
- State GDP YoY
- ▲ 2.78%
- F500 in state
- 22
Industry mix (Fortune 500 HQ in TN)
| Industry | F500 HQs | Revenue |
|---|---|---|
| Healthcare | 3 | $91B |
|
||
| Retail | 3 | $72B |
|
||
| Transportation / Logistics | 1 | $88B |
|
||
| Paper / Packaging | 1 | $19B |
|
||
| Insurance | 1 | $13B |
|
||
| Energy | 1 | $12B |
|
||
Price history
-20.4% since first listed3 events — show timeline
- 2026-06-16 Price Changed $199,000 TVRMLS
- 2026-05-31 Price Changed $225,000 TVRMLS
- 2026-04-24 Listed $250,000 TVRMLS
Cash-flow waterfall
monthlySold comps — $/sqft
last 12 mo · ≤1 miLoading sold comps…