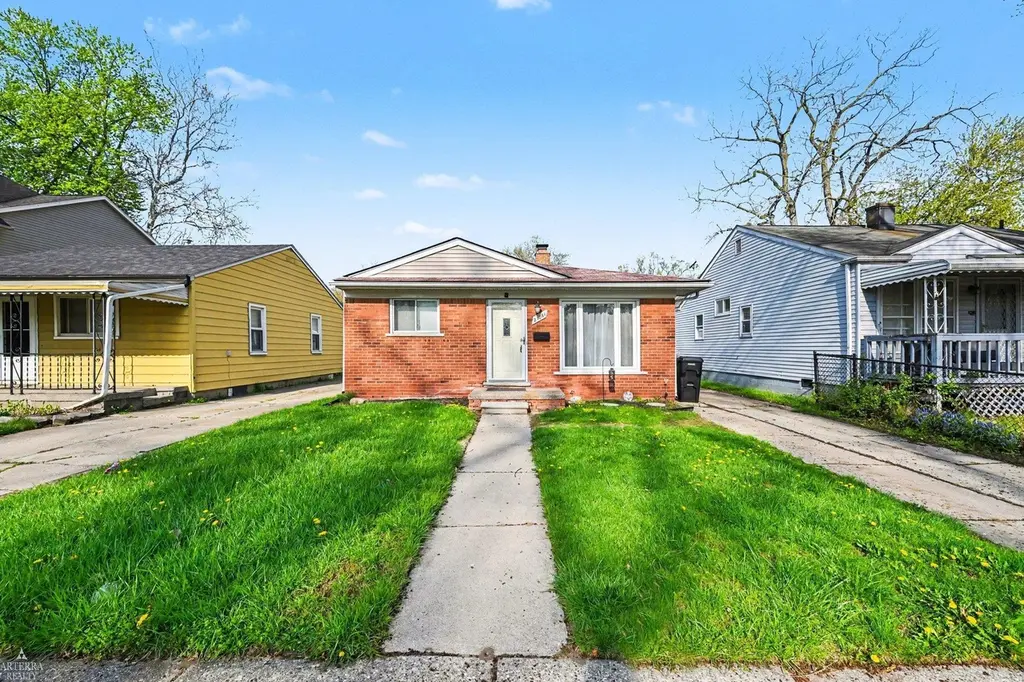
27081 Barrington St St · Madison Heights, MI
Flood risk 1/10 · Minimal
- FEMA flood zone
- X (unshaded)
- Chance of flooding over 30 yrs
- 0.0%
- Est. flood insurance / yr
- $473 – $860
Fire risk 1/10 · Minimal
- Est. fire insurance / yr
- $784 – $1,456
Heat risk 2/10 · Minimal
- Hot days now (above 98°F)
- 7 days/yr
- Hot days in 30 yrs
- 15 days/yr
Wind risk 2/10 · Minimal
- Chance of severe wind over 30 yrs
- —
Air-quality risk 3/10 · Minor
- Unhealthy air days now
- 3 days/yr
- Unhealthy air days in 30 yrs
- 5 days/yr
Risk factors via First Street. Map © Google.
Why this score? — see what drove the C- grade
The composite is a weighted blend of 9 inputs, each scored 0–100. Each bar is that input's sub-score; the figure is the points it added to the 100-point composite (weight × sub-score).
- Cash flow +20.8/30.0
- ARV discount +8.9/15.0
- DSCR +6.6/10.0
- 1% rule +5.2/10.0
- Livability +4.0/5.0
- Rent growth +3.2/5.0
- Condition / age +2.5/5.0
- Schools +1.3/10.0
- Appreciation +0.0/10.0
$173,000
🖨 Deal sheet (PDF) 📄 Offer letter ✓ Due diligence
Listing remarks MLS
Price reduced!!! Here is your chance to purchase this charming ranch that is in the heart of Madison Heights for under $180,000. Home offers 3 bedrooms, 2 car garage and fenced in yard. This home offers solid bones and a open floor plan. With some tlc and a vision. This blank canvas is packed with endless opportunity to create equity through renovations. Close to major freeways, shopping and restaurants. Less than one mile from Royal Oak. Perfect for first time buyer, investor or anyone looking to create value. Schedule your showing today!
Key facts
- 2 garage spots
- Built 1958
- Listed 53 days
Property features AI
Finance
- HOA & community: Homeowners association present
Exterior
- Parking: Detached 2-car garage
- Utilities: Public water; Public sewer / sewer available
- Home design: Single-family residence; One story
- Construction: Brick, vinyl siding and wood siding exterior
- Exterior features: Lot dimensions approximately 483
Interior
- Bathrooms: 1 full bathroom
- Heating & cooling: Central air conditioning; Forced air heating (natural gas)
- Interior features: Crawl space basement; Three total rooms
Neighborhood map
What this means for you Summary
Snapshot
- This is a 3-bed/1.0-bath single-family listed at $173k.
Deal economics
- At list price, monthly cash flow is $238 ($3k/yr) — positive.
- The deal already cash-flows at list — no discount required.
- Meets the 1% rule at list price ($2k rent vs $173k).
- Recommended offer: $168k (3.0% below list) — sets the bar for market timing.
- Cap rate 7.9% vs local median 5.7% in Madison Heights — top-decile yield for the area; either an underpriced asset or a hidden risk that comps aren't pricing in. Stress-test before assuming the spread holds.
Location & tenants
- Location reads 81/100 on livability (#62 in MI, #1,347 nationally) — a professional / high-income tenant draw. Strengths: commute A+, cost of living A+, housing A+; Watch: health & safety D.
- Madison District Public Schools (suburban): math 9% / reading 21% proficiency, ranked #502 of 540 in MI (top 93%) — low school quality limits family demand, transient renter base, plan for 1-2y turnover; 70% free/reduced lunch — lower-income household profile, screen leases tightly.
- Zoned schools: Madison Elementary School (math 12% / reading 17%, grade F, #1,185 of 1,397 statewide, top 86%, 337 students, 79% FRL); Wilkinson Middle School (math 8% / reading 17%, grade F, #466 of 493 statewide, top 95%, 189 students, 80% FRL); Madison High School (math 5% / reading 34%, grade F, #611 of 713 statewide, top 87%, 269 students, 78% FRL).
- Market conditions: Rents rising (+2.8%/yr); 141 active listings in the ZIP; 17 comparable units currently listed for rent nearby; rentals leasing fast (median 13d on market — plan ~1-2 weeks tenant-placement turnaround); 2,614 units permitted in Oakland County in 2024 (721 in 5+ unit buildings).
- This rent runs 30% of the median local income ($70k/yr) — at the standard rent-burdened threshold; future hikes will face affordability resistance.
Forward outlook
- Local home prices are declining (-3.0%/yr); year-one equity from $1k of loan paydown is wiped out by about $5k of value loss. Plan a longer hold.
- Oakland County population projected at +10% by 2050 — modest demand growth; plan on rents tracking national, not racing it.
Negotiation context
- It's been on market 53 days — a 3% lower offer ($168k) is reasonable based on typical stale-listing flexibility.
- 2 sale attempts; this cycle's ask has dropped $14k (8%) from the opening price — seller is motivated, your offer sets the floor, not the list.
- Current owner paid $50k; list at $173k implies a 248% gain — meaningful room to come down on a strong offer.
Risks & watch-outs
- Watch-outs: built in 1958 — expect roof / HVAC / electrical / plumbing capex.
Questions for the listing agent
- It's been on market 53 days. Have you received any prior offers? Is the seller open to a 3% concession, seller financing, or rate buy-down credit?
- Built in 1958 — when were the roof, HVAC, electrical panel, plumbing, and water heater last replaced?
- Is there a deadline driving the sale (1031 exchange, divorce, estate, relocation)? That informs how much negotiation room exists.
- Schools are D-rated, which usually means shorter tenancies and higher turnover. Who's the typical renter profile here, and what's been the actual vacancy rate?
- What's the average days-on-market for RENTAL listings here right now (not sales)? A rising rental-DOM trend means longer vacancies and softer asking-rent achievability than the comps imply.
- What's the recent tenant-quality profile in this submarket — average credit score on applications, eviction rate, late-payment / NSF rate, and stable-employment percentage? A property-management company in the area should have these aggregated.
- How much new for-sale + rental construction is in the pipeline within 1–3 miles? Heavy new supply typically softens prices + rents 12–24 months out; constrained supply supports both.
Investment metrics
- 1% rule
- 1.02% ✓
- Cap rate
- 7.94%
- Cash-on-cash
- 5.88%
- DSCR
- 1.26
- GRM
- 8.2
CMA / ARV
- ARV (median comp)
- $178,462
- List price
- $173,000
- Delta
- -3.06%
- Verdict
- FAIR
- Comps
- 20 within 1.0 mi
Show comp detail 12 sales within ~0.75 mi
| Address | Dist | Beds/Ba | Sqft | Sold | Price | $/sf | Match |
|---|---|---|---|---|---|---|---|
| 27042 Brettonwoods St | 0.10mi | 3/1.0 | 1,011 (+2%) | 0mo | $196,000 | $194 | 91 |
| 27359 Brettonwoods St | 0.17mi | 3/1.0 | 1,004 (+2%) | 0mo | $190,000 | $189 | 89 |
| 318 Royal Park Ln | 0.22mi | 3/1.0 | 1,026 (+4%) | 2mo | $161,000 | $157 | 82 |
| 27377 Palmer Blvd | 0.15mi | 3/1.0 | 910 (-8%) | 1mo | $189,900 | $209 | 79 |
| 27709 Dartmouth St | 0.29mi | 3/1.0 | 905 (-8%) | 2mo | $225,000 | $249 | 71 |
| 27423 Groveland St | 0.35mi | 3/1.0 | 1,066 (+8%) | 1mo | $200,000 | $188 | 69 |
| 2304 E 4th St | 0.48mi | 3/1.0 | 1,042 (+6%) | 1mo | $335,000 | $321 | 68 |
| 27463 Delton St | 0.47mi | 3/1.0 | 1,056 (+7%) | 0mo | $234,000 | $222 | 67 |
| 27096 Hampden St | 0.15mi | 2/1.0 (-1) | 840 (-15%) | 1mo | $150,000 | $179 | 62 |
| 525 Helene Ave | 0.55mi | 3/2.0 | 1,061 (+7%) | 0mo | $360,000 | $339 | 58 |
| 26536 Dartmouth St | 0.30mi | 2/1.0 (-1) | 854 (-14%) | 0mo | $138,900 | $163 | 58 |
| 510 N Campbell Rd | 0.73mi | 3/1.0 | 1,110 (+12%) | 1mo | $265,000 | $239 | 45 |
Match score weights: distance 35% · size 25% · config 20% · recency 20%. Top-matched comps best support the ARV.
Projected returns pro-forma
-3.0% appreciation · 2.81% rent growth · sell at horizon
- IRR
- -7.4%
- Equity multiple
- 0.73×
- Total profit
- $-13,239
- Equity at exit
- $25,795
- IRR
- 1.9%
- Equity multiple
- 1.14×
- Total profit
- $6,584
- Equity at exit
- $14,958
Cash invested: $48,440 (down + closing). Projections, not guarantees.
Landlord ↔ Tenant lean methodology
- Overall (STATE)
- 62 Landlord-Friendly
- State Michigan
- 62 Landlord-Friendly · EVEN
- County
- — inherits STATE
- City
- — inherits STATE
ZIP-level market 48071
- Rents YoY
- 2.8%
- Active inventory
- 141
- Price-to-rent
- 8.2×
Monthly cashflow live
- Estimated rent
- $1,763 high interval (Pro) →
- Mortgage (P&I)
- −$907
- Tax from tax record
- −$176 /mo · $2,109/yr
- Insurance
- −$72
- HOA
- −$0
- Vacancy / Maint / Mgmt
- −$370
- Net cashflow
- $238
Break-even live
Sensitivity live
| Price | -10% $335 | -5% $286 | +0% $238 | +5% $189 | +10% $140 |
|---|---|---|---|---|---|
| Rent | -10% $98 | -5% $168 | +0% $238 | +5% $307 | +10% $377 |
| Rate | -1.0pp $325 | -0.5pp $282 | base $238 | +0.5pp $193 | +1.0pp $147 |
UW: 25.0% down · 7.5% · 30yr · 1.5% tax · 5.0% vac · 8.0% maint · 8.0% mgmt
Financing live
Cash to close
- Down payment
- $43,250
- Closing costs
- $5,190
- Reserves months
- —
- Total cash needed
- —
Loan-product check · same deal, 3 products live
Conventional
25% down · 7.5% · 30yr
- Down + closing
- —
- Monthly P&I
- —
- Monthly cashflow
- —
- DSCR
- —
- Eligible?
- —
Personal DTI + credit; lowest rate.
DSCR
20% down · 8.5% · 30yr
- Down + closing
- —
- Monthly P&I
- —
- Monthly cashflow
- —
- DSCR
- —
- Eligible?
- —
No personal income docs; deal must DSCR.
Hard money
10% down · 12.0% · 12mo
- Down + closing
- —
- Monthly P&I
- —
- Monthly cashflow
- —
- DSCR
- —
- Eligible?
- —
Short-term bridge; refi at stabilization.
Rent comps 17 comps
| Address | Beds | Baths | Sqft | Rent | $/sqft | DOM | Units | Dist |
|---|---|---|---|---|---|---|---|---|
| 27865 Brettonwoods St Madison Heights, MI | 3.0 | 2.0 | 964 | $2,000 | $2.07 | 13d | 1 | 0.41mi |
| 27700 N Stephenson Hwy Madison Heights, MI | 1.0–2.0 | 1.0 | 747 | $1,450 | $1.94 | 1d | 8 | 0.42mi |
| 27392 Osmun St Madison Heights, MI | 2.0 | 1.0 | 696 | $1,250 | $1.80 | 26d | 1 | 0.50mi |
| 28218 Diesing Dr Madison Heights, MI | 3.0 | 1.5 | 1009 | $1,700 | $1.68 | 45d | 1 | 0.56mi |
| 1820 Taylor Ave Royal Oak, MI | 2.0 | 1.0 | 832 | $1,700 | $2.04 | 16d | 1 | 0.63mi |
| 617 S Edgeworth Ave Royal Oak, MI | 2.0 | 1.0 | 955 | $2,125 | $2.23 | 26d | 1 | 0.69mi |
| 328 W Kalama Ave Madison Heights, MI | 3.0 | 1.0 | 900 | $1,575 | $1.75 | 6d | 1 | 0.69mi |
| 1725 Gardenia Ave Royal Oak, MI | 2.0 | 1.0 | 900 | $1,350 | $1.50 | 26d | 1 | 0.83mi |
| 1132 N Campbell Rd Royal Oak, MI | 2.0–3.0 | 1.0–1.5 | 1125 | $2,085 | $1.85 | 1d | 8 | 0.85mi |
| 27385 Park Ct Unit 1364147P Madison Heights, MI | 3.0 | 1.0 | 904 | $1,618 | $1.79 | 1d | 1 | 0.94mi |
| 1816 Guthrie Ave Royal Oak, MI | 3.0 | 1.0 | 1100 | $1,800 | $1.64 | 6d | 1 | 1.20mi |
| 818 Etowah Ave Unit 1032341P Royal Oak, MI | 2.0 | 1.0 | 893 | $6,677 | $7.48 | 0d | 1 | 1.21mi |
| 1007 Gardenia Ave Unit 1009 Royal Oak, MI | 2.0 | 1.0 | 1000 | $1,400 | $1.40 | 26d | 1 | 1.23mi |
| 916 Cherokee Ave Royal Oak, MI | 2.0 | 1.5 | 944 | $2,250 | $2.38 | 4d | 1 | 1.29mi |
| 2181 Coy St Ferndale, MI | 3.0 | 1.0 | 1050 | $1,995 | $1.90 | 12d | 1 | 1.31mi |
| 609 E Eleven Mile Rd Royal Oak, MI | 1.0–2.0 | 1.0 | 925 | $1,375 | $1.49 | 26d | 1 | 1.41mi |
| 2215 Browning St Ferndale, MI | 2.0 | 1.0 | 739 | $1,350 | $1.83 | 6d | 1 | 1.48mi |
Listing history 20 events
-
2026-06-21days on market $173,000 Active 53 DOM
-
2026-06-18days on market $173,000 Active 50 DOM
-
2026-06-17days on market $173,000 Active 49 DOM
-
2026-06-16days on market $173,000 Active 48 DOM
-
2026-06-15days on market $173,000 Active 47 DOM
-
2026-06-13days on market $173,000 Active 45 DOM
-
2026-06-13days on market $173,000 Active 44 DOM
-
2026-06-10price $173,000 Active 41 DOM
Show marketing remark (546 chars)
Price reduced!!! Here is your chance to purchase this charming ranch that is in the heart of Madison Heights for under $180,000. Home offers 3 bedrooms, 2 car garage and fenced in yard. This home offers solid bones and a open floor plan. With some tlc and a vision. This blank canvas is packed with endless opportunity to create equity through renovations. Close to major freeways, shopping and restaurants. Less than one mile from Royal Oak. Perfect for first time buyer, investor or anyone looking to create value. Schedule your showing today!
-
2026-06-09days on market $179,500 Active 41 DOM
-
2026-06-08days on market $179,500 Active 40 DOM
-
2026-06-07days on market $179,500 Active 39 DOM
-
2026-06-04days on market $179,500 Active 36 DOM
-
2026-06-03days on market $179,500 Active 35 DOM
-
2026-06-02days on market $179,500 Active 34 DOM
-
2026-06-01days on market $179,500 Active 33 DOM
-
2026-05-31days on market $179,500 Active 32 DOM
-
2026-04-29$187,500 Active 358-char remark
Show marketing remark (546 chars)
Price reduced!!! Here is your chance to purchase this charming ranch that is in the heart of Madison Heights for under $180,000. Home offers 3 bedrooms, 2 car garage and fenced in yard. This home offers solid bones and a open floor plan. With some tlc and a vision. This blank canvas is packed with endless opportunity to create equity through renovations. Close to major freeways, shopping and restaurants. Less than one mile from Royal Oak. Perfect for first time buyer, investor or anyone looking to create value. Schedule your showing today!
-
2026-04-28historical $187,500 358-char remark
Show marketing remark (546 chars)
Price reduced!!! Here is your chance to purchase this charming ranch that is in the heart of Madison Heights for under $180,000. Home offers 3 bedrooms, 2 car garage and fenced in yard. This home offers solid bones and a open floor plan. With some tlc and a vision. This blank canvas is packed with endless opportunity to create equity through renovations. Close to major freeways, shopping and restaurants. Less than one mile from Royal Oak. Perfect for first time buyer, investor or anyone looking to create value. Schedule your showing today!
-
1993-09-27soldstatus $49,700
ⓘ Source: listings_history table (triggers on properties + properties_extension) + one-shot
backfill from property_details.listing_events for pre-trigger history.
Tax reassessment forecast MI · Partial reset (capped growth)
- Current annual tax
- $2,109 · $176/mo
- Projected year-2 tax
- $2,387 · $199/mo
- Expected delta
- +$278/yr (+$23/mo · 13.2%)
ⓘ Screening estimate from a state-policy table — verify with the county assessor before closing.
Climate risk First Street
- Flood 1/10 Low FEMA zone X (unshaded) · 0% chance over 30 yrs
- Wildfire 1/10 Low
- Heat 2/10 Low 7 d/yr ≥98°F today · 15 d/yr by 30 yrs out
- Wind 2/10 Low
- Air quality 3/10 Moderate 3 unhealthy d/yr today · 5 by 30 yrs out
Nearby sold comps map
Loading sold comps map…
Walkable amenities ~0.75 mi
Loading nearby amenities…
Taxation est. · year 1
- Rental income
- $21,154
- − Mortgage interest
- −$9,691
- − Property taxes
- −$2,109
- − Insurance
- −$865
- − Repairs & maintenance
- −$1,692
- − Management
- −$1,692
- − Depreciation
- −$5,033
- Taxable income
- $71
- Est. tax owed @ 24.0%
- −$17
- After-tax cash flow
- $2,833/yr
For passive investors: Depreciation is non-cash, so a rental often shows a tax loss while cash-flowing — sheltering income. Rental losses are passive: they offset passive income freely, and up to $25,000/yr can offset ordinary (W-2) income if you actively participate and your MAGI is under $100k (phasing out to $0 by $150k); unused losses carry forward. On sale, claimed depreciation is recaptured at up to 25%, and gains may owe capital-gains tax (a 1031 exchange can defer both). Figures are a year-1 estimate at your 24.0% rate — not tax advice; consult a CPA.
Schools (NCES district)
- District
- Madison District Public Schools
- NCES district ID
- 2622290
- Math proficiency
- 9% ▼ -11.00%
- Reading proficiency
- 21% ▼ -12.00%
- Median HH income
- $41,297
- Composite
- 12.89/100
- National rank
- #9586
- State rank
- #502 of 540 in MI
Livability — Madison Heights
- Score
- 81/100
- State rank
- #62
- US rank
- #1347
Category grades
Schools grade is shown separately in the Schools card above.
Census & demographics
- Census place
- Madison Heights, MI
- County
- Oakland County · 1,009,092 people
- City population
- 28,419
- Metro
- Detroit-Warren-Dearborn, MI
- Population (ZIP)
- 28,419
- Household income
- $69,503
- Rent vs Own
- Severe rent burden
- 786.0
Population outlook (Oakland County) Hauer SSP2
- Today (2025)
- 1,335,747 people
- By 2030
- 1,375,100 · +2.9%
- By 2040
- 1,435,385 · +7.5%
- By 2050
- 1,469,250 · +10.0%
- By 2075
- 1,531,946 · +14.7%
- By 2100
- 1,450,485 · +8.6%
Race, ethnicity, and origin ACS 2023
- Neighborhood character
- Predominantly White (79%)
- Race & ethnicity
- White 79% Black 7% Asian 7% Two or more races 4% Hispanic / Latino 2%
- Common ancestry
- Romanian 11% Lithuanian 3% Slovak 2%
- Foreign-born
- 14% · China, Canada, South Korea
- Languages at home
- 84% English-only · Chinese 3% Other Indo-European 3% Arabic 2%
Political lean MEDSL · Oakland
- 2024 margin
- D (+10.6) · D 54.4% · R 43.8% · Other 1.9%
- 2008→2024 swing
- -3.9pp toward R · 2008: 14.5pp · 2024: 10.6pp
- All cycles
- 2024: D+10.6 2020: D+14.1 2016: D+8.1 2012: D+8.1 2008: D+14.5
Not yet ingested
- Civics
- —
Market trends
- HPI YoY
- ▼ -275.69%
- Current HPI
- 243.4861
- Rent YoY
- ▲ 2.81%
- Metro
- Detroit-Warren-Dearborn, MI
- State GDP YoY
- ▲ 1.37%
- F500 in state
- 28
Industry mix (Fortune 500 HQ in MI)
| Industry | F500 HQs | Revenue |
|---|---|---|
| Automotive Parts | 3 | $48B |
|
||
| Automotive | 2 | $372B |
|
||
| Chemicals | 1 | $45B |
|
||
| Automotive Retail | 1 | $29B |
|
||
| Healthcare / Medical Devices | 1 | $23B |
|
||
| Automotive Technology | 1 | $20B |
|
||
Price history
+248.1% since first listed8 events — show timeline
- 2026-06-10 Price Changed $173,000 MiRealSource-MiMLS
- 2026-06-09 Price Changed $173,000 REALCOMP
- 2026-05-25 Price Changed $179,500 MiRealSource-MiMLS
- 2026-05-24 Price Changed $179,500 REALCOMP
- 2026-04-29 Listed $187,500 REALCOMP
- 2026-04-29 Listed $187,500 MiRealSource-MiMLS
- 2026-04-28 Coming Soon $187,500 MiRealSource-MiMLS
- 1993-09-27 Sold (Public Records) $49,700 Public Records
Property tax history
+5.6%/yrLatest (2025): $2,109 · +2.8% YoY. Source: county tax records.
Cash-flow waterfall
monthlySold comps — $/sqft
last 12 mo · ≤1 miLoading sold comps…