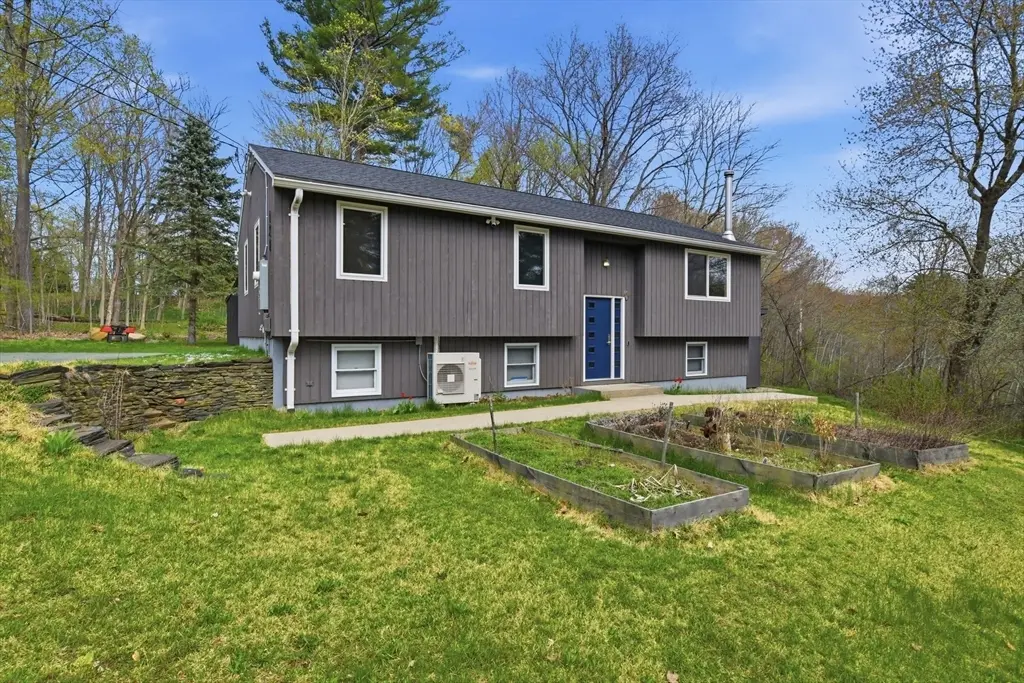
138 West St · Easthampton, MA
Flood risk 1/10 · Minimal
- FEMA flood zone
- X
- Chance of flooding over 30 yrs
- 0.0%
- Est. flood insurance / yr
- $507 – $1,088
Fire risk 2/10 · Minimal
- Est. fire insurance / yr
- $915 – $1,699
Heat risk 4/10 · Minor
- Hot days now (above 97°F)
- 7 days/yr
- Hot days in 30 yrs
- 16 days/yr
Wind risk 4/10 · Minor
- Chance of severe wind over 30 yrs
- 21.0%
Air-quality risk 2/10 · Minimal
- Unhealthy air days now
- 1 days/yr
- Unhealthy air days in 30 yrs
- 1 days/yr
Risk factors via First Street. Map © Google.
Why this score? — see what drove the F grade
The composite is a weighted blend of 9 inputs, each scored 0–100. Each bar is that input's sub-score; the figure is the points it added to the 100-point composite (weight × sub-score).
- Cash flow +11.4/30.0
- DSCR +3.3/10.0
- Schools +3.2/10.0
- ARV discount +2.7/15.0
- Rent growth +2.5/5.0
- Livability +2.5/5.0
- Condition / age +2.5/5.0
- 1% rule +2.4/10.0
- Appreciation +0.0/10.0
$489,000
🖨 Deal sheet (PDF) 📄 Offer letter ✓ Due diligence
Listing remarks MLS
Easthampton, 3 bedroom, 2 bath, raised ranch, built in 1992 in a quiet area, amidst wildlife on a .45 acre. This home has a rear deck, open floor plan, and an expandable w/o basement. In summer enjoy the above ground pool. Price right at $220,000
Key facts
- Low maintenance home
- Private wooded lot
- Raised ranch
Tags
Property features AI
Finance
- Other: Seller excludes personal steel firepit
Exterior
- Parking: Eight off-street parking spaces; Stone/gravel parking surface
- Security: Security system
- Utilities: Public water; Public sewer; 200+ amp electrical service; Gas connections available for range and oven; Electric dryer hookup
- Home design: Single family residence; Approximately 1,772 total building area (finished above and below grade split); Dark grey exterior color
- Construction: Frame construction; Shingle roof; Concrete perimeter foundation; Year built approximated from public records
- Exterior features: Wood deck and patio; Rain gutters; Exterior storage; Screens; Fruit trees and garden; Stone wall; Scenic views; Wooded, gently sloping lot with easements; Public road frontage
Interior
- Kitchen: Kitchen island; Open floorplan kitchen with stone/ceramic tile flooring; Range and cooktop; Oven; Range hood; Microwave; Dishwasher (ENERGY STAR qualified); Disposal; Refrigerator (ENERGY STAR qualified)
- Bedrooms: Master bedroom on the first floor with hardwood flooring and full bathroom; Second bedroom on the first floor with hardwood flooring; Third bedroom on the first floor with hardwood flooring; Fourth bedroom in the basement with stone/ceramic tile flooring
- Flooring: Hardwood flooring in main living areas and bedrooms (where noted); Tile/stone flooring in kitchen and bathrooms; Wall-to-wall carpet in basement office
- Bathrooms: Two full bathrooms; Primary bath present; First-floor bathroom tiled with shower stall, stone/ceramic tile flooring, upgraded countertops, remodeled; Second first-floor bathroom tiled with tub and shower, stone/ceramic tile flooring, stone/granite/solid countertops, remodeled
- Heating & cooling: Central heating; Baseboard heating; Heat pump; Electric and propane heating options; Wood stove; Ductless heating; Ductless cooling and whole-house fan
- Interior features: Office; Broadband internet available; Insulated doors; Insulated windows with screens; Partially finished walk-out basement with interior entry; Total of 8 rooms
- Laundry & utility: Laundry in basement; Electric dryer hookup; Washer and dryer included; Tankless water heater and water heater included
Neighborhood map
What this means for you Summary
Snapshot
- This is a 3-bed/2.5-bath single-family listed at $489k.
Deal economics
- At list price, monthly cash flow is $-170 ($-2k/yr) — negative.
- To cash-flow at today's rent, offer at most $459k (6.1% below list).
- To meet the 1% rule (rent ≥ 1% of price), the offer needs to be $362k (25.9% below list).
- Recommended offer: $362k (25.9% below list) — sets the bar for 1% rule.
Location & tenants
- Location reads: area grade F — affects rentability + tenant quality, not the cash-flow math above.
- Easthampton (suburban): math 27% / reading 47% proficiency, ranked #219 of 302 in MA (top 72%) — families likely to look elsewhere, expect single-tenant / working-renter base with shorter leases.
- Zoned schools: Mountain View School (1,043 students, 0% FRL); White Brook Middle School (math 24% / reading 39%); Easthampton High (math 52% / reading 62%, grade C, #147 of 343 statewide, top 44%, 370 students, 0% FRL) — zoned schools average 0% FRL vs 28% district-wide (28 pts lower); this property's tenant base skews higher-income than the district average.
- Market conditions: 27 active listings in the ZIP; 349 units permitted in Hampshire County in 2024 (185 in 5+ unit buildings).
Forward outlook
- Local home prices are declining (-3.0%/yr); year-one equity from $3k of loan paydown is wiped out by about $15k of value loss. Plan a longer hold.
- Hampshire County population projected at +5% by 2050 — modest demand growth; plan on rents tracking national, not racing it.
Negotiation context
- It's been on market 55 days — a 3% lower offer ($474k) is reasonable based on typical stale-listing flexibility.
- 2 sale attempts since 19y ago with the ask held roughly flat each time — persistent listings suggest the price (not the market) is what's stuck; bring a comps-based counter.
- Current owner paid $217k; list at $489k implies a 125% gain — meaningful room to come down on a strong offer.
Questions for the listing agent
- What do current leases actually rent for vs. the listed asking? Can we see a recent rent roll and the last 12 months of T-12 income?
- It's been on market 55 days. Have you received any prior offers? Is the seller open to a 26% concession, seller financing, or rate buy-down credit?
- Is there a deadline driving the sale (1031 exchange, divorce, estate, relocation)? That informs how much negotiation room exists.
- The area grade is low — what's the realistic commute time and amenity access for the typical tenant pool here? Any planned neighborhood developments (good or bad) we should know about?
- What's the average days-on-market for RENTAL listings here right now (not sales)? A rising rental-DOM trend means longer vacancies and softer asking-rent achievability than the comps imply.
- What's the recent tenant-quality profile in this submarket — average credit score on applications, eviction rate, late-payment / NSF rate, and stable-employment percentage? A property-management company in the area should have these aggregated.
- How much new for-sale + rental construction is in the pipeline within 1–3 miles? Heavy new supply typically softens prices + rents 12–24 months out; constrained supply supports both.
Investment metrics
- 1% rule
- 0.74% ✗
- Cap rate
- 5.88%
- Cash-on-cash
- -1.49%
- DSCR
- 0.93
- GRM
- 11.2
CMA / ARV
- ARV (median comp)
- $441,527
- List price
- $489,000
- Delta
- 10.75%
- Verdict
- OVERPRICED
- Comps
- 20 within 1.0 mi
Show comp detail 7 sales within ~0.75 mi
| Address | Dist | Beds/Ba | Sqft | Sold | Price | $/sf | Match |
|---|---|---|---|---|---|---|---|
| 16 Oliver St | 0.25mi | 3/1.0 | 1,118 (-2%) | 14mo | $391,000 | $350 | 68 |
| 15 Evans Ave | 0.34mi | 3/1.0 | 1,176 (+3%) | 10mo | $381,000 | $324 | 64 |
| 6 Oakridge Cir | 0.26mi | 3/1.0 | 1,072 (-6%) | 10mo | $465,000 | $434 | 64 |
| 10 Concord Dr | 0.27mi | 3/1.0 | 1,120 (-2%) | 20mo | $340,000 | $304 | 62 |
| 7 Evans Ave | 0.30mi | 3/1.0 | 1,192 (+5%) | 21mo | $385,000 | $323 | 55 |
| 6 Newell St | 0.50mi | 2/1.0 (-1) | 1,043 (-8%) | 6mo | $351,000 | $337 | 46 |
| 48 Oliver St | 0.46mi | 2/1.0 (-1) | 1,040 (-9%) | 16mo | $339,000 | $326 | 39 |
Match score weights: distance 35% · size 25% · config 20% · recency 20%. Top-matched comps best support the ARV.
Projected returns pro-forma
-3.0% appreciation · 3.0% rent growth · sell at horizon
- IRR
- -18.8%
- Equity multiple
- 0.34×
- Total profit
- $-90,240
- Equity at exit
- $72,911
- IRR
- -11.4%
- Equity multiple
- 0.32×
- Total profit
- $-93,186
- Equity at exit
- $42,280
Cash invested: $136,920 (down + closing). Projections, not guarantees.
Landlord ↔ Tenant lean methodology
- Overall (STATE)
- 20 Strongly Tenant-Friendly
- State Massachusetts
- 20 Strongly Tenant-Friendly · D+15
- County
- — inherits STATE
- City
- — inherits STATE
ZIP-level market 01027
- Active inventory
- 27
- Price-to-rent
- 11.2×
Monthly cashflow live
- Estimated rent
- $3,623 medium interval (Pro) →
- Mortgage (P&I)
- −$2,564
- Tax from tax record
- −$264 /mo · $3,169/yr
- Insurance
- −$204
- HOA
- −$0
- Vacancy / Maint / Mgmt
- −$761
- Net cashflow
- $-170
Break-even live
Sensitivity live
| Price | -10% $107 | -5% $-32 | +0% $-170 | +5% $-309 | +10% $-447 |
|---|---|---|---|---|---|
| Rent | -10% $-456 | -5% $-313 | +0% $-170 | +5% $-27 | +10% $116 |
| Rate | -1.0pp $76 | -0.5pp $-46 | base $-170 | +0.5pp $-297 | +1.0pp $-426 |
UW: 25.0% down · 7.5% · 30yr · 1.5% tax · 5.0% vac · 8.0% maint · 8.0% mgmt
Financing live
Cash to close
- Down payment
- $122,250
- Closing costs
- $14,670
- Reserves months
- —
- Total cash needed
- —
Loan-product check · same deal, 3 products live
Conventional
25% down · 7.5% · 30yr
- Down + closing
- —
- Monthly P&I
- —
- Monthly cashflow
- —
- DSCR
- —
- Eligible?
- —
Personal DTI + credit; lowest rate.
DSCR
20% down · 8.5% · 30yr
- Down + closing
- —
- Monthly P&I
- —
- Monthly cashflow
- —
- DSCR
- —
- Eligible?
- —
No personal income docs; deal must DSCR.
Hard money
10% down · 12.0% · 12mo
- Down + closing
- —
- Monthly P&I
- —
- Monthly cashflow
- —
- DSCR
- —
- Eligible?
- —
Short-term bridge; refi at stabilization.
Listing history 19 events
-
2026-06-22days on market $489,000 Active 55 DOM
-
2026-06-18days on market $489,000 Active 52 DOM
-
2026-06-17days on market $489,000 Active 51 DOM
-
2026-06-16days on market $489,000 Active 50 DOM
-
2026-06-15days on market $489,000 Active 49 DOM
-
2026-06-14days on market $489,000 Active 47 DOM
-
2026-06-10days on market $489,000 Active 44 DOM
-
2026-06-09days on market $489,000 Active 43 DOM
-
2026-06-08days on market $489,000 Active 42 DOM
-
2026-06-07days on market $489,000 Active 41 DOM
-
2026-06-03days on market $489,000 Active 37 DOM
-
2026-06-02days on market $489,000 Active 36 DOM
-
2026-06-01days on market $489,000 Active 35 DOM
-
2026-05-31days on market $489,000 Active 34 DOM
-
2026-05-30days on market $489,000 Active 33 DOM
-
2026-04-27$489,000 New 1008-char remark
-
2007-08-27soldstatus $217,000 248-char remark
Show marketing remark (248 chars)
Easthampton, 3 bedroom, 2 bath, raised ranch, built in 1992 in a quiet area, amidst wildlife on a .45 acre. This home has a rear deck, open floor plan, and an expandable w/o basement. In summer enjoy the above ground pool. Price right at $220,000
-
2007-08-27soldstatus $217,000
Show marketing remark (248 chars)
Easthampton, 3 bedroom, 2 bath, raised ranch, built in 1992 in a quiet area, amidst wildlife on a .45 acre. This home has a rear deck, open floor plan, and an expandable w/o basement. In summer enjoy the above ground pool. Price right at $220,000
-
2007-04-01$220,000 248-char remark
Show marketing remark (248 chars)
Easthampton, 3 bedroom, 2 bath, raised ranch, built in 1992 in a quiet area, amidst wildlife on a .45 acre. This home has a rear deck, open floor plan, and an expandable w/o basement. In summer enjoy the above ground pool. Price right at $220,000
ⓘ Source: listings_history table (triggers on properties + properties_extension) + one-shot
backfill from property_details.listing_events for pre-trigger history.
Tax reassessment forecast MA · Partial reset (capped growth)
- Current annual tax
- $3,169 · $264/mo
- Projected year-2 tax
- $4,592 · $383/mo
- Expected delta
- +$1,423/yr (+$119/mo · 44.9%)
ⓘ Screening estimate from a state-policy table — verify with the county assessor before closing.
Climate risk First Street
- Flood 1/10 Low FEMA zone X · 0% chance over 30 yrs
- Wildfire 2/10 Low
- Heat 4/10 Moderate 7 d/yr ≥97°F today · 16 d/yr by 30 yrs out
- Wind 4/10 Moderate 21% chance of damaging wind over 30 yrs
- Air quality 2/10 Low 1 unhealthy d/yr today · 1 by 30 yrs out
Nearby sold comps map
Loading sold comps map…
Walkable amenities ~0.75 mi
Loading nearby amenities…
Taxation est. · year 1
- Rental income
- $43,473
- − Mortgage interest
- −$27,392
- − Property taxes
- −$3,169
- − Insurance
- −$2,445
- − Repairs & maintenance
- −$3,478
- − Management
- −$3,478
- − Depreciation
- −$14,225
- Taxable loss
- −$10,714
- Est. tax savings @ 24.0%
- +$2,571
- After-tax cash flow
- $528/yr
For passive investors: Depreciation is non-cash, so a rental often shows a tax loss while cash-flowing — sheltering income. Rental losses are passive: they offset passive income freely, and up to $25,000/yr can offset ordinary (W-2) income if you actively participate and your MAGI is under $100k (phasing out to $0 by $150k); unused losses carry forward. On sale, claimed depreciation is recaptured at up to 25%, and gains may owe capital-gains tax (a 1031 exchange can defer both). Figures are a year-1 estimate at your 24.0% rate — not tax advice; consult a CPA.
Schools (NCES district)
- District
- Easthampton
- NCES district ID
- 2504590
- Math proficiency
- 27% ▼ -17.00%
- Reading proficiency
- 47% ▲ 3.00%
- Median HH income
- $55,625
- Composite
- 32.47/100
- National rank
- #5713
- State rank
- #219 of 302 in MA
Livability — Easthampton
No livability data for this city. (Only ~50 U.S. cities are tracked.)
Census & demographics
- Census place
- Easthampton Town, MA
- Population (ZIP)
- 17,678
Population outlook (Hampshire County) Hauer SSP2
- Today (2025)
- 166,577 people
- By 2030
- 168,928 · +1.4%
- By 2040
- 171,197 · +2.8%
- By 2050
- 175,542 · +5.4%
- By 2075
- 199,884 · +20.0%
- By 2100
- 211,819 · +27.2%
Race, ethnicity, and origin ACS 2023
- Neighborhood character
- Predominantly White (86%)
- Race & ethnicity
- White 86% Two or more races 9% Hispanic / Latino 8% Asian 1%
- Hispanic origin (detail)
- Puerto Rican 4% Dominican 1%
- Common ancestry
- Lithuanian 14% Romanian 13% Russian 2%
- Foreign-born
- 7% · Canada, Jamaica, China
- Languages at home
- 89% English-only · Spanish 5% Other Indo-European 2% German/W. Germanic 1%
Political lean MEDSL · Hampshire
- 2024 margin
- Solid D (+41.9) · D 69.5% · R 27.6% · Other 2.9%
- 2008→2024 swing
- -3.6pp toward R · 2008: 45.6pp · 2024: 41.9pp
- All cycles
- 2024: D+41.9 2020: D+46.8 2016: D+39.5 2012: D+43.8 2008: D+45.6
Not yet ingested
- Civics
- —
Market trends
- HPI YoY
- ▼ -260.63%
- Current HPI
- 277.0125
- Rent YoY
- —
- Metro
- —
- State GDP YoY
- ▲ 2.28%
- F500 in state
- 38
Industry mix (Fortune 500 HQ in MA)
| Industry | F500 HQs | Revenue |
|---|---|---|
| Technology | 3 | $17B |
|
||
| Insurance | 2 | $84B |
|
||
| Retail | 2 | $76B |
|
||
| Life Sciences | 1 | $43B |
|
||
| Energy Technology | 1 | $31B |
|
||
| Aerospace / Defense | 1 | $18B |
|
||
Price history
+122.3% since first listed4 events — show timeline
- 2026-04-27 Listed $489,000 MLS PIN
- 2007-08-27 Sold (Public Records) $217,000 Public Records
- 2007-08-27 Sold (MLS) $217,000 MLS PIN
- 2007-04-01 Listed $220,000 MLS PIN
Property tax history
+1.7%/yrLatest (2023): $3,169 · -11.4% YoY. Source: county tax records.
Cash-flow waterfall
monthlySold comps — $/sqft
last 12 mo · ≤1 miLoading sold comps…