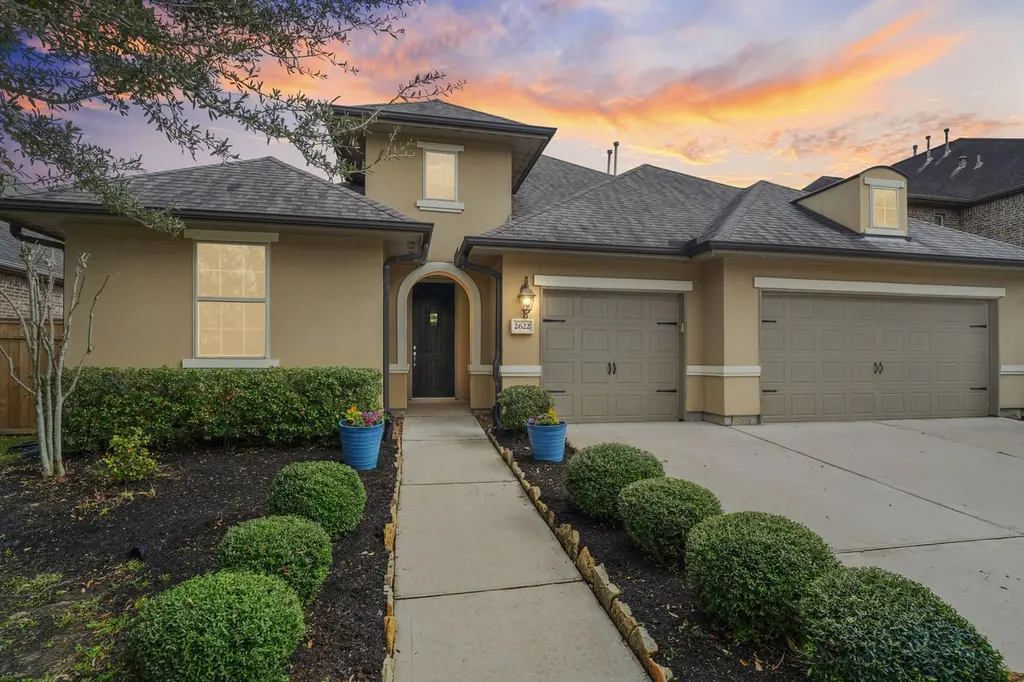
2622 Big Vine Ct · Sienna, TX
Flood risk 1/10 · Minimal
- FEMA flood zone
- X
- Chance of flooding over 30 yrs
- 0.0%
- Est. flood insurance / yr
- $507 – $1,088
Fire risk 4/10 · Minor
- Est. fire insurance / yr
- $1,222 – $2,270
Heat risk 9/10 · Severe
- Hot days now (above 111°F)
- 7 days/yr
- Hot days in 30 yrs
- 24 days/yr
Wind risk 9/10 · Severe
- Chance of severe wind over 30 yrs
- 99.0%
Air-quality risk 2/10 · Minimal
- Unhealthy air days now
- 2 days/yr
- Unhealthy air days in 30 yrs
- 2 days/yr
Risk factors via First Street. Map © Google.
Why this score? — see what drove the C- grade
The composite is a weighted blend of 9 inputs, each scored 0–100. Each bar is that input's sub-score; the figure is the points it added to the 100-point composite (weight × sub-score).
- ARV discount +15.0/15.0
- Cash flow +11.1/30.0
- 1% rule +5.5/10.0
- Schools +4.5/10.0
- Appreciation +4.2/10.0
- DSCR +3.2/10.0
- Rent growth +2.5/5.0
- Livability +2.5/5.0
- Condition / age +2.5/5.0
$505,000
🖨 Deal sheet 📄 Offer letter ✓ Due diligence
Listing remarks MLS
Exquisitely appointed one-story Shea Home featuring 4 bedrooms, 3.5 baths, private study, media room, and a 3-car garage. Thoughtfully designed with an exceptional layout and seamless flow, the open-concept living spaces transition effortlessly from the gourmet kitchen to the dining and family rooms — ideal for elevated entertaining and everyday living. The primary suite is a true retreat, highlighted by an expansive custom closet that connects directly to the oversized laundry room for added convenience. Enjoy added privacy with no back neighbors and a serene backyard setting. Recent updates include $4,600 in upgraded flooring, $2,000 in refreshed carpet, and a $1,600 fence enhancement. Luxury, function, and refined comfort beautifully combined. Zoned to highly regarded Ridge Point HS.
Key facts
- Custom closet
- Gourmet kitchen
- Private study
Tags
Neighborhood map
What this means for you Summary
Snapshot
- This is a 4-bed/4.0-bath single-family listed at $505k.
Deal economics
- At list price, monthly cash flow is $-200 ($-2k/yr) — negative.
- To cash-flow at today's rent, offer at most $470k (7.0% below list).
- Meets the 1% rule at list price ($5k rent vs $505k).
- Recommended offer: $470k (7.0% below list) — sets the bar for cash-flow.
- Cap rate 5.8% vs local median 3.3% in Sienna — top-decile yield for the area; either an underpriced asset or a hidden risk that comps aren't pricing in. Stress-test before assuming the spread holds.
Location & tenants
- Location reads: area grade C — affects rentability + tenant quality, not the cash-flow math above.
- Fort Bend ISD (suburban): math 44% / reading 53% proficiency, ranked #140 of 826 in TX (top 17%) — families likely to look elsewhere, expect single-tenant / working-renter base with shorter leases.
- Market conditions: Rents soft (-0.1%/yr); 1215 active listings in the ZIP; 4 comparable units currently listed for rent nearby; rentals leasing fast (median 10d on market — plan ~1-2 weeks tenant-placement turnaround); high-income renter base; 12,093 units permitted in Fort Bend County in 2024 (815 in 5+ unit buildings).
- At $5,289/mo this rent would consume 49% of the median local household income ($129k/yr) (locally 1004% of renters already pay >50% of income on rent) — very limited rent-growth headroom before tenants either downsize or default.
Forward outlook
- Local home prices are declining (-1.7%/yr); year-one equity from $3k of loan paydown is wiped out by about $8k of value loss. Plan a longer hold.
- Fort Bend County population projected at +75% by 2050 — long-run rental-demand tailwind backs the buy-and-hold thesis.
Negotiation context
- It's been on market 48 days — a 3% lower offer ($490k) is reasonable based on typical stale-listing flexibility.
- 7 sale attempts since 8y ago with the ask held roughly flat each time — persistent listings suggest the price (not the market) is what's stuck; bring a comps-based counter.
Risks & watch-outs
- Watch-outs: property tax is 3.3% of price.
- Climate carrying-cost: severe wind risk, 99% chance of damaging wind over 30y; extreme-heat days projected 7→24/yr by 2055 (HVAC capex compounding) — expect insurance premiums to compound above CPI over the hold.
Questions for the listing agent
- What do current leases actually rent for vs. the listed asking? Can we see a recent rent roll and the last 12 months of T-12 income?
- It's been on market 48 days. Have you received any prior offers? Is the seller open to a 7% concession, seller financing, or rate buy-down credit?
- Property tax is high relative to price — has the assessment been appealed recently, and will the sale trigger a re-assessment?
- What does the HOA fee cover, when was the last increase, and are there any pending special assessments or reserve-fund shortfalls?
- Is there a deadline driving the sale (1031 exchange, divorce, estate, relocation)? That informs how much negotiation room exists.
- What's the average days-on-market for RENTAL listings here right now (not sales)? A rising rental-DOM trend means longer vacancies and softer asking-rent achievability than the comps imply.
- What's the recent tenant-quality profile in this submarket — average credit score on applications, eviction rate, late-payment / NSF rate, and stable-employment percentage? A property-management company in the area should have these aggregated.
- How much new for-sale + rental construction is in the pipeline within 1–3 miles? Heavy new supply typically softens prices + rents 12–24 months out; constrained supply supports both.
Investment metrics
- 1% rule
- 1.05% ✓
- Cap rate
- 5.82%
- Cash-on-cash
- -1.70%
- DSCR
- 0.92
- GRM
- 8.0
CMA / ARV
- ARV (median comp)
- $612,183
- List price
- $505,000
- Delta
- -17.51%
- Verdict
- UNDERPRICED
- Comps
- 20 within 1.0 mi
Show comp detail 12 sales within ~0.75 mi
| Address | Dist | Beds/Ba | Sqft | Sold | Price | $/sf | Match |
|---|---|---|---|---|---|---|---|
| 2610 Lazy Vine Ln | 0.08mi | 4/4.5 | 2,907 (-8%) | 1mo | $715,000 | $246 | 79 |
| 2618 Lazy Vine Ln | 0.08mi | 4/3.5 | 3,478 (+10%) | 1mo | $750,000 | $216 | 78 |
| 9418 San Marco Dr | 0.27mi | 4/4.5 | 3,266 (+3%) | 4mo | $745,000 | $228 | 77 |
| 10039 Cypress Path | 0.45mi | 4/3.5 | 3,348 (+5%) | 0mo | $585,000 | $175 | 68 |
| 10018 Foggy Riv | 0.37mi | 3/3.5 (-1) | 2,944 (-7%) | 0mo | $449,999 | $153 | 63 |
| 9227 Turtle Pond Ln | 0.50mi | 4/4.0 | 3,404 (+7%) | 2mo | $600,000 | $176 | 63 |
| 10115 Cypress Path | 0.44mi | 4/3.5 | 3,457 (+9%) | 2mo | $520,900 | $151 | 61 |
| 10022 Orchard Fld | 0.41mi | 4/3.5 | 3,563 (+12%) | 1mo | $597,900 | $168 | 58 |
| 10023 Starhill Ct | 0.62mi | 4/3.0 | 2,930 (-8%) | 4mo | $450,000 | $154 | 51 |
| 8919 Autumn Pine Dr | 0.67mi | 4/3.5 | 3,439 (+8%) | 3mo | $597,000 | $174 | 50 |
| 9019 Serenity Frst | 0.71mi | 4/4.5 | 3,474 (+9%) | 3mo | $824,900 | $237 | 47 |
| 10143 Deerpark Dr | 0.73mi | 4/3.5 | 2,874 (-10%) | 2mo | $475,000 | $165 | 46 |
Match score weights: distance 35% · size 25% · config 20% · recency 20%. Top-matched comps best support the ARV.
Projected returns pro-forma
-1.67% appreciation · 0.0% rent growth · sell at horizon
- IRR
- -14.5%
- Equity multiple
- 0.43×
- Total profit
- $-80,667
- Equity at exit
- $105,913
- IRR
- -12.0%
- Equity multiple
- 0.17×
- Total profit
- $-117,894
- Equity at exit
- $98,101
Cash invested: $141,400 (down + closing). Projections, not guarantees.
Landlord ↔ Tenant lean methodology
- Overall (STATE)
- 87 Strongly Landlord-Friendly
- State Texas
- 87 Strongly Landlord-Friendly · R+5
- County
- — inherits STATE
- City
- — inherits STATE
ZIP-level market 77459
- Home prices YoY
- -0.8%
- Rents YoY
- -0.1%
- Active inventory
- 1215
- Price-to-rent
- 8.0×
Monthly cashflow live
- Estimated rent
- $5,289 medium interval (Pro) →
- Mortgage (P&I)
- −$2,648
- Tax from tax record
- −$1,387 /mo · $16,649/yr
- Insurance
- −$210
- HOA
- −$132
- Vacancy / Maint / Mgmt
- −$1,111
- Net cashflow
- $-200
Break-even live
UW: 25.0% down · 7.5% · 30yr · 1.5% tax · 5.0% vac · 8.0% maint · 8.0% mgmt
Financing live
Cash to close
- Down payment
- $126,250
- Closing costs
- $15,150
- Reserves months
- —
- Total cash needed
- —
Loan-product check · same deal, 3 products live
Conventional
25% down · 7.5% · 30yr
- Down + closing
- —
- Monthly P&I
- —
- Monthly cashflow
- —
- DSCR
- —
- Eligible?
- —
Personal DTI + credit; lowest rate.
DSCR
20% down · 8.5% · 30yr
- Down + closing
- —
- Monthly P&I
- —
- Monthly cashflow
- —
- DSCR
- —
- Eligible?
- —
No personal income docs; deal must DSCR.
Hard money
10% down · 12.0% · 12mo
- Down + closing
- —
- Monthly P&I
- —
- Monthly cashflow
- —
- DSCR
- —
- Eligible?
- —
Short-term bridge; refi at stabilization.
Rent comps 4 comps
| Address | Beds | Baths | Sqft | Rent | $/sqft | DOM | Units | Dist |
|---|---|---|---|---|---|---|---|---|
| 2142 Ironwood Pass Dr Missouri City, TX | 4.0 | 3.0 | 2140 | $6,000 | $2.80 | 1d | 1 | 0.79mi |
| 9006 Meadow Bridge Dr Missouri City, TX | 4.0 | 3.5 | 3958 | $6,580 | $1.66 | 2d | 1 | 0.85mi |
| 2718 Van Gogh Ln Missouri City, TX | 4.0 | 2.5 | 3036 | $3,595 | $1.18 | 10d | 1 | 0.85mi |
| 8719 Fox Trail Dr Missouri City, TX | 4.0 | 3.5 | 2143 | $6,000 | $2.80 | 22d | 1 | 0.97mi |
HOA detail
- Monthly dues
- $132 · $1,584/yr
Listing history 22 events
-
2026-06-02days on market $505,000 Active 48 DOM
-
2026-06-01days on market $505,000 Active 47 DOM
-
2026-05-31days on market $505,000 Active 46 DOM
-
2026-04-15$505,000 Active 804-char remark
Show marketing remark (804 chars)
Exquisitely appointed one-story Shea Home featuring 4 bedrooms, 3.5 baths, private study, media room, and a 3-car garage. Thoughtfully designed with an exceptional layout and seamless flow, the open-concept living spaces transition effortlessly from the gourmet kitchen to the dining and family rooms — ideal for elevated entertaining and everyday living. The primary suite is a true retreat, highlighted by an expansive custom closet that connects directly to the oversized laundry room for added convenience. Enjoy added privacy with no back neighbors and a serene backyard setting. Recent updates include $4,600 in upgraded flooring, $2,000 in refreshed carpet, and a $1,600 fence enhancement. Luxury, function, and refined comfort beautifully combined. Zoned to highly regarded Ridge Point HS.
-
2026-04-15historical
Show marketing remark (804 chars)
Exquisitely appointed one-story Shea Home featuring 4 bedrooms, 3.5 baths, private study, media room, and a 3-car garage. Thoughtfully designed with an exceptional layout and seamless flow, the open-concept living spaces transition effortlessly from the gourmet kitchen to the dining and family rooms — ideal for elevated entertaining and everyday living. The primary suite is a true retreat, highlighted by an expansive custom closet that connects directly to the oversized laundry room for added convenience. Enjoy added privacy with no back neighbors and a serene backyard setting. Recent updates include $4,600 in upgraded flooring, $2,000 in refreshed carpet, and a $1,600 fence enhancement. Luxury, function, and refined comfort beautifully combined. Zoned to highly regarded Ridge Point HS.
-
2026-03-27price $515,000
-
2026-03-27$515,000 Active
-
2026-03-26historical
-
2026-02-27$525,000 Active
-
2020-07-28soldstatus
-
2020-07-24soldstatus Sold
-
2020-07-03status Pending
-
2020-06-23status Option Pending
-
2020-06-04status Active
-
2020-06-02status Option Pending
-
2020-05-30price $399,989
-
2020-05-03$414,989 Active
-
2018-09-17soldstatus Sold
-
2018-09-11status Pending
-
2018-08-24status Active
-
2018-07-13status Pending
-
2018-01-24$441,091 Active
ⓘ Source: listings_history table (triggers on properties + properties_extension) + one-shot
backfill from property_details.listing_events for pre-trigger history.
Tax reassessment forecast TX · Resets to sale price
- Current annual tax
- $16,649 · $1,387/mo
- Projected year-2 tax
- $16,649 · $1,387/mo
- Expected delta
- $0/yr ($0/mo · 0.0%)
ⓘ Screening estimate from a state-policy table — verify with the county assessor before closing.
Climate risk First Street
- Flood 1/10 Low FEMA zone X · 0% chance over 30 yrs
- Wildfire 4/10 Moderate
- Heat 9/10 Extreme 7 d/yr ≥111°F today · 24 d/yr by 30 yrs out
- Wind 9/10 Extreme 99% chance of damaging wind over 30 yrs
- Air quality 2/10 Low 2 unhealthy d/yr today · 2 by 30 yrs out
Nearby sold comps map
Loading sold comps map…
Walkable amenities ~0.75 mi
Loading nearby amenities…
Taxation est. · year 1
- Rental income
- $63,464
- − Mortgage interest
- −$28,288
- − Property taxes
- −$16,649
- − Insurance
- −$2,525
- − Repairs & maintenance
- −$5,077
- − Management
- −$5,077
- − HOA
- −$1,584
- − Depreciation
- −$14,691
- Taxable loss
- −$10,427
- Est. tax savings @ 24.0%
- +$2,502
- After-tax cash flow
- $102/yr
For passive investors: Depreciation is non-cash, so a rental often shows a tax loss while cash-flowing — sheltering income. Rental losses are passive: they offset passive income freely, and up to $25,000/yr can offset ordinary (W-2) income if you actively participate and your MAGI is under $100k (phasing out to $0 by $150k); unused losses carry forward. On sale, claimed depreciation is recaptured at up to 25%, and gains may owe capital-gains tax (a 1031 exchange can defer both). Figures are a year-1 estimate at your 24.0% rate — not tax advice; consult a CPA.
Schools (NCES district)
- District
- Fort Bend ISD
- NCES district ID
- 4819650
- Math proficiency
- 44% ▼ -15.00%
- Reading proficiency
- 53% ▼ -4.00%
- Median HH income
- $82,360
- Composite
- 44.61/100
- National rank
- #2779
- State rank
- #140 of 826 in TX
Livability — Sienna
No livability data for this city. (Only ~50 U.S. cities are tracked.)
Census & demographics
- Census place
- Sienna, TX
- County
- Fort Bend County · 836,777 people
- Metro
- Houston-The Woodlands-Sugar Land, TX
- Population (ZIP)
- 84,221
- Household income
- $129,151
- Rent vs Own
- Severe rent burden
- 1004.0
Population outlook (Fort Bend County) Hauer SSP2
- Today (2025)
- 1,004,526 people
- By 2030
- 1,153,104 · +14.8%
- By 2040
- 1,453,718 · +44.7%
- By 2050
- 1,753,781 · +74.6%
- By 2075
- 2,455,772 · +144.5%
- By 2100
- 2,930,528 · +191.7%
Race, ethnicity, and origin ACS 2023
- Neighborhood character
- Highly diverse neighborhood (Simpson 0.75)
- Race & ethnicity
- White 34% Black 26% Asian 22% Hispanic / Latino 13% Two or more races 10%
- Hispanic origin (detail)
- Mexican 7%
- Common ancestry
- Lithuanian 2% Slovak 1% Italian 1%
- Foreign-born
- 21% · Canada, China, Vietnam
- Languages at home
- 73% English-only · Other Asian/Pacific 8% Spanish 7% Other Indo-European 5%
Political lean MEDSL · Fort Bend
- 2024 margin
- Toss-up / Even · D 49.5% · R 47.9% · Other 2.6%
- 2008→2024 swing
- +4.0pp toward D · 2008: -2.4pp · 2024: 1.6pp
- All cycles
- 2024: D+1.6 2020: D+10.6 2016: D+6.6 2012: R+6.8 2008: R+2.4
Not yet ingested
- Civics
- —
Market trends
- HPI YoY
- ▼ -1.67%
- Current HPI
- 212.3573
- Rent YoY
- ▼ -0.15%
- Metro
- Houston-The Woodlands-Sugar Land, TX
- State GDP YoY
- ▲ 3.95%
- F500 in state
- 110
Industry mix (Fortune 500 HQ in TX)
| Industry | F500 HQs | Revenue |
|---|---|---|
| Energy | 16 | $1,198B |
|
||
| Technology | 5 | $198B |
|
||
| Engineering / Construction | 4 | $72B |
|
||
| Energy Services | 3 | $60B |
|
||
| Utilities | 3 | $41B |
|
||
| Healthcare | 2 | $330B |
|
||
Price history
+14.5% since first listed19 events — show timeline
- 2026-04-15 Listing Removed — HARMLS
- 2026-04-15 Listed $505,000 HARMLS
- 2026-03-27 Price Changed $515,000 HARMLS
- 2026-03-27 Listed $515,000 HARMLS
- 2026-03-26 Listing Removed — HARMLS
- 2026-02-27 Listed $525,000 HARMLS
- 2020-07-28 Sold (Public Records) — Public Records
- 2020-07-24 Sold (MLS) — HARMLS
- 2020-07-03 Pending — HARMLS
- 2020-06-23 Pending — HARMLS
- 2020-06-04 Relisted — HARMLS
- 2020-06-02 Pending — HARMLS
- 2020-05-30 Price Changed $399,989 HARMLS
- 2020-05-03 Listed $414,989 HARMLS
- 2018-09-17 Sold (MLS) — HARMLS
- 2018-09-11 Pending — HARMLS
- 2018-08-24 Relisted — HARMLS
- 2018-07-13 Pending — HARMLS
- 2018-01-24 Listed $441,091 HARMLS
Property tax history
+24.9%/yrLatest (2025): $16,649 · +7.2% YoY. Source: county tax records.
Cash-flow waterfall
monthlySold comps — $/sqft
last 12 mo · ≤1 miLoading sold comps…