 Fourplex
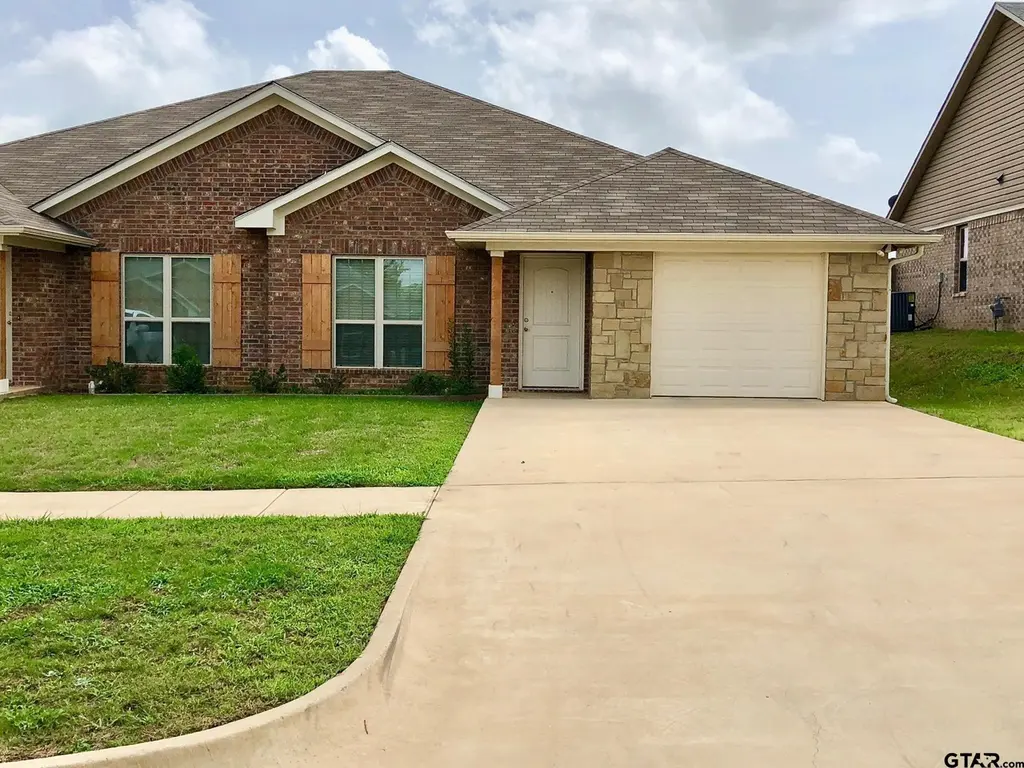
303/309 Princess Pl · Tyler, TX
Flood risk 1/10 · Minimal
- FEMA flood zone
- X (unshaded)
- Chance of flooding over 30 yrs
- 0.0%
- Est. flood insurance / yr
- $507 – $1,088
Fire risk 5/10 · Moderate
- Est. fire insurance / yr
- $1,222 – $2,270
Heat risk 7/10 · Major
- Hot days now (above 108°F)
- 7 days/yr
- Hot days in 30 yrs
- 27 days/yr
Wind risk 6/10 · Moderate
- Chance of severe wind over 30 yrs
- 68.0%
Air-quality risk 2/10 · Minimal
- Unhealthy air days now
- 0 days/yr
- Unhealthy air days in 30 yrs
- 1 days/yr
Risk factors via First Street. Map © Google.
Why this score? — see what drove the C+ grade
The composite is a weighted blend of 9 inputs, each scored 0–100. Each bar is that input's sub-score; the figure is the points it added to the 100-point composite (weight × sub-score).
- Cash flow +26.7/30.0
- DSCR +9.2/10.0
- ARV discount +7.5/15.0
- 1% rule +6.8/10.0
- Livability +3.8/5.0
- Schools +3.3/10.0
- Rent growth +2.5/5.0
- Condition / age +2.5/5.0
- Appreciation +0.0/10.0
$450,000
🖨 Deal sheet 📄 Offer letter ✓ Due diligence
Multi-family units
County records classify this as Multi-Family (2-4 Unit). Listing-text estimate: 4 units. confirmed
Listing remarks MLS
Looking to break into real estate the smart way or just build your current portfolio? This well-maintained duplex in Tyler offers the perfect opportunity for FHA buyers or investors wanting to build wealth one property at a time. With attractive brick and stone exterior finishes, private driveways, and individual garage spaces, this property offers both functionality and curb appeal in a growing area of town. Why This Property Works: Ideal for FHA owner-occupants (live in one side, rent the other). Great entry-level investment property, Strong rental demand, Individual garages & separate entrances, Low-maintenance exterior. Whether you're a first-time buyer wanting help with your mortgage payment or an investor testing the market with a manageable duplex, this property checks the boxes. Prime Tyler Location Situated in a convenient area of Tyler with quick access to: • Tyler Pounds Regional Airport – just minutes away • Loop 323 & Highway 31 for easy commuting • UT Tyler & Tyler Junior College • Christus & UT Health medical facilities • Shopping, dining, and retail centers • Growing residential developments nearby Tyler continues to experience steady growth, making this a smart long-term hold.
Key facts
- Private driveways
- Individual garages
- Prime tyler location
Tags
Neighborhood map
What this means for you Summary
Snapshot
- This is a 4 × 3-bed/2.0-bath units multifamily listed at $450k.
Deal economics
- At list price, monthly cash flow is $1k ($15k/yr) — positive. Per door: $305/mo.
- The deal already cash-flows at list — no discount required.
- Meets the 1% rule at list price ($5k rent vs $450k).
- Recommended offer: $436k (3.0% below list) — sets the bar for market timing.
- Cap rate 9.5% vs local median 3.6% in Tyler — top-decile yield for the area; either an underpriced asset or a hidden risk that comps aren't pricing in. Stress-test before assuming the spread holds.
Location & tenants
- Location reads 75/100 on livability (#147 in TX, #4,181 nationally) — a middle-class / working-renter tenant base. Strengths: cost of living A+, housing A+, health & safety A+; Watch: employment C-, schools D+, crime D+.
- Tyler ISD (urban): math 39% / reading 38% proficiency, ranked #449 of 826 in TX (top 54%) — families likely to look elsewhere, expect single-tenant / working-renter base with shorter leases; 66% free/reduced lunch — lower-income household profile, screen leases tightly.
- Market conditions: 191 active listings in the ZIP; 595 units permitted in Smith County in 2024 (45 in 5+ unit buildings).
Forward outlook
- Local home prices are declining (-3.0%/yr); year-one equity from $3k of loan paydown is wiped out by about $14k of value loss. Plan a longer hold.
- Smith County population projected at +24% by 2050 — long-run rental-demand tailwind backs the buy-and-hold thesis.
- At projected returns (-3.0% appreciation + 3.0% rent growth), your $126k cash investment doubles in ~10 years — after that, you're playing with house money.
Negotiation context
- It's been on market 59 days — a 3% lower offer ($436k) is reasonable based on typical stale-listing flexibility.
Risks & watch-outs
- Climate carrying-cost: major wind risk, 68% chance of damaging wind over 30y; moderate wildfire risk; extreme-heat days projected 7→27/yr by 2055 (HVAC capex compounding) — expect insurance premiums to compound above CPI over the hold.
Questions for the listing agent
- It's been on market 59 days. Have you received any prior offers? Is the seller open to a 3% concession, seller financing, or rate buy-down credit?
- Can we see the unit-by-unit rent roll, current vacancy, and any below-market leases? What's the average tenancy length?
- What capital expenditures (roof, boiler, parking lot, exteriors) have been made in the last 5 years, and what's planned in the next 2?
- Is there a deadline driving the sale (1031 exchange, divorce, estate, relocation)? That informs how much negotiation room exists.
- Schools are D-rated, which usually means shorter tenancies and higher turnover. Who's the typical renter profile here, and what's been the actual vacancy rate?
- Crime grade is D in this area — have there been break-ins, vandalism, or insurance claims at this property in the last 3 years? What carrier currently insures it and at what premium?
- What's the average days-on-market for RENTAL listings here right now (not sales)? A rising rental-DOM trend means longer vacancies and softer asking-rent achievability than the comps imply.
- What's the recent tenant-quality profile in this submarket — average credit score on applications, eviction rate, late-payment / NSF rate, and stable-employment percentage? A property-management company in the area should have these aggregated.
- How much new apartment / multifamily construction is in the pipeline within 1–3 miles? Heavy new supply (>2% of stock underway) typically softens rents 12–24 months out; light construction supports rent growth.
Investment metrics
- 1% rule
- 1.18% ✓
- Cap rate
- 9.54%
- Cash-on-cash
- 11.61%
- DSCR
- 1.52
- GRM
- 7.1
CMA / ARV
No comps found within radius.
Projected returns pro-forma
-3.0% appreciation · 3.0% rent growth · sell at horizon
- IRR
- 1.0%
- Equity multiple
- 1.04×
- Total profit
- $4,738
- Equity at exit
- $67,096
- IRR
- 10.6%
- Equity multiple
- 1.83×
- Total profit
- $104,101
- Equity at exit
- $38,908
Cash invested: $126,000 (down + closing). Projections, not guarantees.
Landlord ↔ Tenant lean methodology
- Overall (STATE)
- 87 Strongly Landlord-Friendly
- State Texas
- 87 Strongly Landlord-Friendly · R+5
- County
- — inherits STATE
- City
- — inherits STATE
ZIP-level market 75704
- Home prices YoY
- -17.6%
- Active inventory
- 191
- Price-to-rent
- 28.3×
Monthly cashflow live
- Estimated rent
- $5,300 medium interval (Pro) →
- Mortgage (P&I)
- −$2,360
- Tax from tax record
- −$420 /mo · $5,043/yr
- Insurance
- −$188
- HOA
- −$0
- Vacancy / Maint / Mgmt
- −$1,113
- Net cashflow
- $1,219
Break-even live
4-unit breakdown (identical units grouped — click to expand)
| Units | Beds | Baths | Est. rent |
|---|---|---|---|
| 4× units | 3 | 2 | $5,300 |
| #1 | 3 | 2 | $1,325 |
| #2 | 3 | 2 | $1,325 |
| #3 | 3 | 2 | $1,325 |
| #4 | 3 | 2 | $1,325 |
| Total (4 units) | $5,300 | ||
UW: 25.0% down · 7.5% · 30yr · 1.5% tax · 5.0% vac · 8.0% maint · 8.0% mgmt
Financing live
Cash to close
- Down payment
- $112,500
- Closing costs
- $13,500
- Reserves months
- —
- Total cash needed
- —
Loan-product check · same deal, 3 products live
Conventional
25% down · 7.5% · 30yr
- Down + closing
- —
- Monthly P&I
- —
- Monthly cashflow
- —
- DSCR
- —
- Eligible?
- —
Personal DTI + credit; lowest rate.
DSCR
20% down · 8.5% · 30yr
- Down + closing
- —
- Monthly P&I
- —
- Monthly cashflow
- —
- DSCR
- —
- Eligible?
- —
No personal income docs; deal must DSCR.
Hard money
10% down · 12.0% · 12mo
- Down + closing
- —
- Monthly P&I
- —
- Monthly cashflow
- —
- DSCR
- —
- Eligible?
- —
Short-term bridge; refi at stabilization.
Listing history 17 events
-
2026-06-19days on market $450,000 Active 59 DOM
-
2026-06-18days on market $450,000 Active 58 DOM
-
2026-06-17days on market $450,000 Active 57 DOM
-
2026-06-16days on market $450,000 Active 56 DOM
-
2026-06-15days on market $450,000 Active 55 DOM
-
2026-06-14days on market $450,000 Active 53 DOM
-
2026-06-13days on market $450,000 Active 52 DOM
-
2026-06-10days on market $450,000 Active 50 DOM
-
2026-06-09days on market $450,000 Active 49 DOM
-
2026-06-08days on market $450,000 Active 48 DOM
-
2026-06-07days on market $450,000 Active 47 DOM
-
2026-06-05days on market $450,000 Active 44 DOM
-
2026-06-02days on market $450,000 Active 42 DOM
-
2026-06-01days on market $450,000 Active 41 DOM
-
2026-05-31days on market $450,000 Active 40 DOM
-
2026-05-30days on market $450,000 Active 39 DOM
-
2026-04-21$450,000 Active 1274-char remark
Show marketing remark (1274 chars)
Looking to break into real estate the smart way or just build your current portfolio? This well-maintained duplex in Tyler offers the perfect opportunity for FHA buyers or investors wanting to build wealth one property at a time. With attractive brick and stone exterior finishes, private driveways, and individual garage spaces, this property offers both functionality and curb appeal in a growing area of town. Why This Property Works: Ideal for FHA owner-occupants (live in one side, rent the other). Great entry-level investment property, Strong rental demand, Individual garages & separate entrances, Low-maintenance exterior. Whether you're a first-time buyer wanting help with your mortgage payment or an investor testing the market with a manageable duplex, this property checks the boxes. Prime Tyler Location Situated in a convenient area of Tyler with quick access to: • Tyler Pounds Regional Airport – just minutes away • Loop 323 & Highway 31 for easy commuting • UT Tyler & Tyler Junior College • Christus & UT Health medical facilities • Shopping, dining, and retail centers • Growing residential developments nearby Tyler continues to experience steady growth, making this a smart long-term hold.
ⓘ Source: listings_history table (triggers on properties + properties_extension) + one-shot
backfill from property_details.listing_events for pre-trigger history.
Tax reassessment forecast TX · Resets to sale price
- Current annual tax
- $5,043 · $420/mo
- Projected year-2 tax
- $8,235 · $686/mo
- Expected delta
- +$3,192/yr (+$266/mo · 63.3%)
ⓘ Screening estimate from a state-policy table — verify with the county assessor before closing.
Climate risk First Street
- Flood 1/10 Low FEMA zone X (unshaded) · 0% chance over 30 yrs
- Wildfire 5/10 Major
- Heat 7/10 Severe 7 d/yr ≥108°F today · 27 d/yr by 30 yrs out
- Wind 6/10 Major 68% chance of damaging wind over 30 yrs
- Air quality 2/10 Low 0 unhealthy d/yr today · 1 by 30 yrs out
Nearby sold comps map
Loading sold comps map…
Walkable amenities ~0.75 mi
Loading nearby amenities…
Taxation est. · year 1
- Rental income
- $63,600
- − Mortgage interest
- −$25,207
- − Property taxes
- −$5,043
- − Insurance
- −$2,250
- − Repairs & maintenance
- −$5,088
- − Management
- −$5,088
- − Depreciation
- −$13,091
- Taxable income
- $7,833
- Est. tax owed @ 24.0%
- −$1,880
- After-tax cash flow
- $12,753/yr
For passive investors: Depreciation is non-cash, so a rental often shows a tax loss while cash-flowing — sheltering income. Rental losses are passive: they offset passive income freely, and up to $25,000/yr can offset ordinary (W-2) income if you actively participate and your MAGI is under $100k (phasing out to $0 by $150k); unused losses carry forward. On sale, claimed depreciation is recaptured at up to 25%, and gains may owe capital-gains tax (a 1031 exchange can defer both). Figures are a year-1 estimate at your 24.0% rate — not tax advice; consult a CPA.
Schools (NCES district)
- District
- Tyler ISD
- NCES district ID
- 4843470
- Math proficiency
- 39% ▼ -4.00%
- Reading proficiency
- 38% ▼ -1.00%
- Median HH income
- $44,090
- Composite
- 32.69/100
- National rank
- #5650
- State rank
- #449 of 826 in TX
Livability — Tyler
- Score
- 75/100
- State rank
- #147
- US rank
- #4181
Category grades
Schools grade is shown separately in the Schools card above.
Census & demographics
- City population
- 127,842
- Population (ZIP)
- 9,280
Population outlook (Smith County) Hauer SSP2
- Today (2025)
- 248,890 people
- By 2030
- 261,665 · +5.1%
- By 2040
- 286,114 · +15.0%
- By 2050
- 308,006 · +23.8%
- By 2075
- 354,171 · +42.3%
- By 2100
- 372,828 · +49.8%
Race, ethnicity, and origin ACS 2023
- Neighborhood character
- Diverse neighborhood (Simpson 0.62)
- Race & ethnicity
- White 53% Black 26% Hispanic / Latino 17% Two or more races 6% Asian 1%
- Hispanic origin (detail)
- Mexican 13%
- Common ancestry
- Italian 1% Portuguese 1% Slovak 1%
- Foreign-born
- 11% · Canada
- Languages at home
- 84% English-only · Spanish 15% Arabic 1%
Political lean MEDSL · Smith
- 2024 margin
- Solid R (+45.1) · D 27.0% · R 72.1%
- 2008→2024 swing
- -5.6pp toward R · 2008: -39.5pp · 2024: -45.1pp
- All cycles
- 2024: R+45.1 2020: R+39.4 2016: R+43.9 2012: R+46.9 2008: R+39.5
Not yet ingested
- Civics
- —
Market trends
- HPI YoY
- ▼ -46.96%
- Current HPI
- 219.5206
- Rent YoY
- —
- Metro
- —
- State GDP YoY
- ▲ 3.95%
- F500 in state
- 110
Industry mix (Fortune 500 HQ in TX)
| Industry | F500 HQs | Revenue |
|---|---|---|
| Energy | 16 | $1,198B |
|
||
| Technology | 5 | $198B |
|
||
| Engineering / Construction | 4 | $72B |
|
||
| Energy Services | 3 | $60B |
|
||
| Utilities | 3 | $41B |
|
||
| Healthcare | 2 | $330B |
|
||
Price history
1 event — show timeline
- 2026-04-21 Listed $450,000 GTAR
Property tax history
+38.4%/yrLatest (2024): $5,043 · -12.4% YoY. Source: county tax records.
Cash-flow waterfall
monthlySold comps — $/sqft
last 12 mo · ≤1 miLoading sold comps…