 🌊 Lakefront
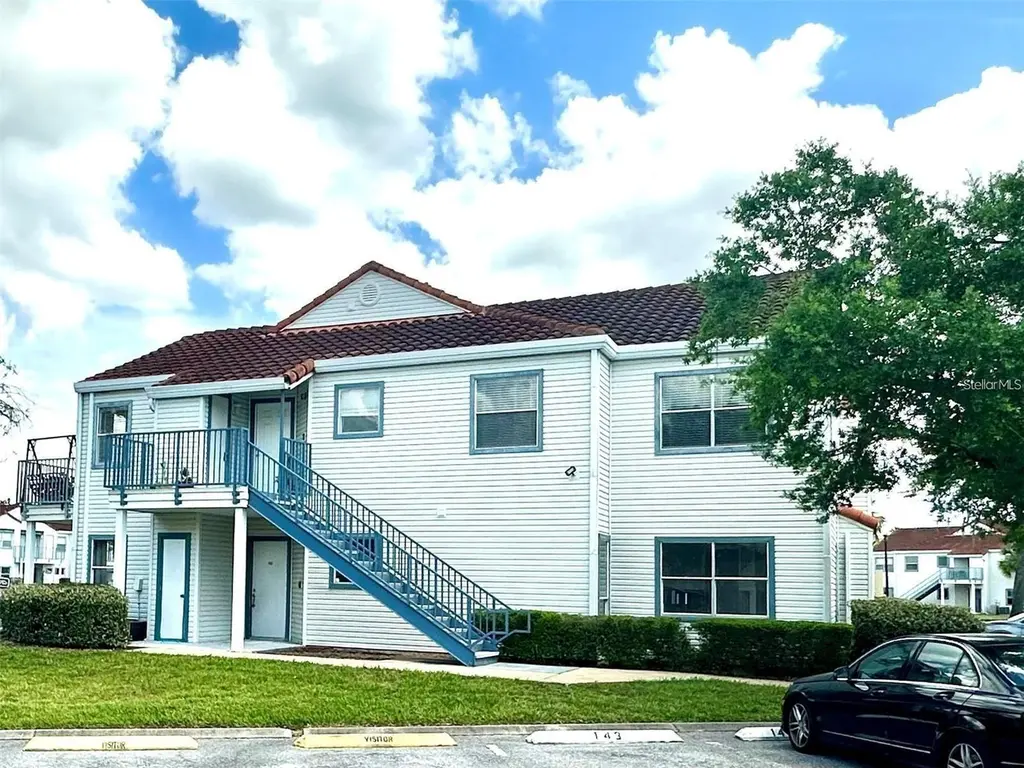
2540 Woodgate Blvd #201 · Orlando, FL
Flood risk No data
- FEMA flood zone
- —
- Chance of flooding over 30 yrs
- —
- Est. flood insurance / yr
- —
Fire risk No data
- Est. fire insurance / yr
- —
Heat risk No data
- Hot days now (above threshold)
- —
- Hot days in 30 yrs
- —
Wind risk No data
- Chance of severe wind over 30 yrs
- —
Air-quality risk No data
- Unhealthy air days now
- —
- Unhealthy air days in 30 yrs
- —
Risk factors via First Street. Map © Google.
Why this score? — see what drove the C- grade
The composite is a weighted blend of 9 inputs, each scored 0–100. Each bar is that input's sub-score; the figure is the points it added to the 100-point composite (weight × sub-score).
- Cash flow +17.5/30.0
- 1% rule +8.0/10.0
- ARV discount +7.5/15.0
- DSCR +5.5/10.0
- Livability +4.3/5.0
- Schools +4.1/10.0
- Condition / age +2.5/5.0
- Rent growth +2.3/5.0
- Appreciation +0.0/10.0
$120,000
🖨 Deal sheet (PDF) 📄 Offer letter ✓ Due diligence
Listing remarks
Under contract-accepting backup offers. Discover the perfect potential of comfort, convenience , and potential in this charming 2 bedroom, 2 bathroom condo ideally located near major roads, shopping, dining, and entertainment. Whether you are homeowner or investor , this property offers incredible value in a highly desirable area. Enjoy peaceful water views that creates a relexingathmosphere right from your home. This move in ready unit features a functional layout with spacious living areas, natural light, and plenty of opportunity add your personal touch and increase value over time. Perfectly situated for easy commuting and everyday living , this condo is just minutes from everything you
Key facts
- Water views
- Natural light
- Functional layout
Tags
Neighborhood map
What this means for you Summary
Snapshot
- This is a 2-bed/2.0-bath condo listed at $120k.
Deal economics
- At list price, monthly cash flow is $91 ($1k/yr) — positive.
- The deal already cash-flows at list — no discount required.
- Meets the 1% rule at list price ($2k rent vs $120k).
- Cap rate 7.2% vs local median 3.0% in Orlando — top-decile yield for the area; either an underpriced asset or a hidden risk that comps aren't pricing in. Stress-test before assuming the spread holds.
Location & tenants
- Location reads 86/100 on livability (#12 in FL, #360 nationally) — a professional / high-income tenant draw. Strengths: amenities A+, commute A+, housing A+.
- Orange (suburban): math 46% / reading 51% proficiency, ranked #43 of 73 in FL (top 59%) — families likely to look elsewhere, expect single-tenant / working-renter base with shorter leases.
- Zoned schools: Ventura Elementary (math 26% / reading 34%, grade F, #1,882 of 2,144 statewide, top 88%, 596 students, 66% FRL); Roberto Clemente Middle (math 31% / reading 36%, grade F, #428 of 571 statewide, top 76%, 951 students, 63% FRL); Colonial High (math 16% / reading 33%, grade F, #505 of 667 statewide, top 79%, 3,442 students, 62% FRL).
- Zoned-school proficiency averages 29% at this address vs 48% district-wide (-19 pts) — the specific schools serving this property underperform the Orange average; the district grade overstates school quality for this exact location.
- Market conditions: Rents soft (-0.7%/yr); 379 active listings in the ZIP; 40 comparable units currently listed for rent nearby; rentals at typical pace (median 20d on market — plan ~3-4 weeks tenant-placement turnaround); 8,053 units permitted in Orange County in 2024 (3,133 in 5+ unit buildings).
- This rent runs 33% of the median local income ($57k/yr) — at the standard rent-burdened threshold; future hikes will face affordability resistance.
Forward outlook
- Local home prices are declining (-3.0%/yr); year-one equity from $830 of loan paydown is wiped out by about $4k of value loss. Plan a longer hold.
- Orange County population projected at +52% by 2050 — long-run rental-demand tailwind backs the buy-and-hold thesis.
Negotiation context
- Only 6 days on market — expect competitive offers; lowballing is unlikely to land.
- 6 sale attempts since 3y ago with the ask held roughly flat each time — persistent listings suggest the price (not the market) is what's stuck; bring a comps-based counter.
Risks & watch-outs
- Watch-outs: HOA is 28% of rent.
Questions for the listing agent
- What does the HOA fee cover, when was the last increase, and are there any pending special assessments or reserve-fund shortfalls?
- Any open or pending special assessments — roof, HVAC, plumbing, elevator, façade? What's the per-unit balance and payoff schedule, and is the seller paying it off at close or rolling it to the buyer?
- Is there a deadline driving the sale (1031 exchange, divorce, estate, relocation)? That informs how much negotiation room exists.
- Schools are B-rated — typically a magnet for longer-tenancy family renters. What's the average tenant stay here, and is there a school-zone premium baked into asking?
- This sits on a lake — are riparian / water-frontage rights deeded with the parcel? Any dock permits, shoreline easements, or HOA water-use restrictions?
- What's the documented flood / surge / shoreline-erosion history here (FEMA AND non-FEMA — e.g., storm surge, creek backup, septic-field saturation)?
- Any water-quality or seasonal algae-bloom issues that affect tenant satisfaction or short-term-rental demand?
- What's the average days-on-market for RENTAL listings here right now (not sales)? A rising rental-DOM trend means longer vacancies and softer asking-rent achievability than the comps imply.
- What's the recent tenant-quality profile in this submarket — average credit score on applications, eviction rate, late-payment / NSF rate, and stable-employment percentage? A property-management company in the area should have these aggregated.
- How much new apartment / multifamily construction is in the pipeline within 1–3 miles? Heavy new supply (>2% of stock underway) typically softens rents 12–24 months out; light construction supports rent growth.
Investment metrics
- 1% rule
- 1.30% ✓
- Cap rate
- 7.21%
- Cash-on-cash
- 3.27%
- DSCR
- 1.15
- GRM
- 6.4
CMA / ARV
No comps found within radius.
Projected returns pro-forma
-3.0% appreciation · 0.0% rent growth · sell at horizon
- IRR
- -15.6%
- Equity multiple
- 0.46×
- Total profit
- $-17,979
- Equity at exit
- $17,892
- IRR
- -16.3%
- Equity multiple
- 0.26×
- Total profit
- $-24,959
- Equity at exit
- $10,375
Cash invested: $33,600 (down + closing). Projections, not guarantees.
Landlord ↔ Tenant lean methodology
- Overall (STATE)
- 87 Strongly Landlord-Friendly
- State Florida
- 87 Strongly Landlord-Friendly · R+3
- County
- — inherits STATE
- City
- — inherits STATE
ZIP-level market 32822
- Home prices YoY
- -21.1%
- Rents YoY
- -0.7%
- Active inventory
- 379
- Price-to-rent
- 6.4×
Monthly cashflow live
- Estimated rent
- $1,561 high interval (Pro) →
- Mortgage (P&I)
- −$629
- Tax from tax record
- −$32 /mo · $390/yr
- Insurance
- −$50
- HOA
- −$430
- Vacancy / Maint / Mgmt
- −$328
- Net cashflow
- $91
Break-even live
Sensitivity live
| Price | -10% $159 | -5% $125 | +0% $91 | +5% $57 | +10% $24 |
|---|---|---|---|---|---|
| Rent | -10% $-32 | -5% $30 | +0% $91 | +5% $153 | +10% $215 |
| Rate | -1.0pp $152 | -0.5pp $122 | base $91 | +0.5pp $60 | +1.0pp $29 |
UW: 25.0% down · 7.5% · 30yr · 1.5% tax · 5.0% vac · 8.0% maint · 8.0% mgmt
Financing live
Cash to close
- Down payment
- $30,000
- Closing costs
- $3,600
- Reserves months
- —
- Total cash needed
- —
Loan-product check · same deal, 3 products live
Conventional
25% down · 7.5% · 30yr
- Down + closing
- —
- Monthly P&I
- —
- Monthly cashflow
- —
- DSCR
- —
- Eligible?
- —
Personal DTI + credit; lowest rate.
DSCR
20% down · 8.5% · 30yr
- Down + closing
- —
- Monthly P&I
- —
- Monthly cashflow
- —
- DSCR
- —
- Eligible?
- —
No personal income docs; deal must DSCR.
Hard money
10% down · 12.0% · 12mo
- Down + closing
- —
- Monthly P&I
- —
- Monthly cashflow
- —
- DSCR
- —
- Eligible?
- —
Short-term bridge; refi at stabilization.
Rent comps 40 comps
| Address | Beds | Baths | Sqft | Rent | $/sqft | DOM | Units | Dist |
|---|---|---|---|---|---|---|---|---|
| 6122 Curry Ford Rd #241 Orlando, FL | 1.0 | 1.0 | 742 | $1,325 | $1.79 | 25d | 1 | 0.04mi |
| 6118 Curry Ford Rd Orlando, FL | 1.0 | 1.0 | 742 | $1,175 | $1.58 | 25d | 1 | 0.04mi |
| 2536 Woodgate Blvd #107 Orlando, FL | 2.0 | 2.0 | 930 | $1,650 | $1.77 | 23d | 1 | 0.05mi |
| 2516 Woodgate Blvd #203 Orlando, FL | 1.0 | 1.0 | 680 | $1,245 | $1.83 | 9d | 1 | 0.07mi |
| 2508 Woodgate Blvd #207 Orlando, FL | 2.0 | 2.0 | 930 | $1,600 | $1.72 | 23d | 1 | 0.07mi |
| 6110 Curry Ford Rd #117 Orlando, FL | 1.0 | 1.0 | 742 | $1,175 | $1.58 | 25d | 1 | 0.07mi |
| 2556 Woodgate Blvd #203 Orlando, FL | 1.0 | 1.0 | 680 | $1,350 | $1.99 | 16d | 1 | 0.08mi |
| 2143 Raper Dairy Rd Orlando, FL | 1.0 | 1.0 | 432 | $1,319 | $3.05 | 0d | 9 | 0.11mi |
| 6104 Curry Ford Rd #108 Orlando, FL | 2.0 | 2.0 | 1051 | $1,500 | $1.43 | 9d | 1 | 0.11mi |
| 6104 Curry Ford Rd #207 Orlando, FL | 2.0 | 2.0 | 1051 | $1,600 | $1.52 | 25d | 1 | 0.11mi |
| 2568 Woodgate Blvd Orlando, FL | 1.0–2.0 | 1.0–2.0 | 790 | $1,500 | $1.90 | 6d | 1 | 0.13mi |
| 2500 Woodgate Blvd #203 Orlando, FL | 1.0 | 1.0 | 680 | $1,299 | $1.91 | 6d | 1 | 0.16mi |
| 6203 Curry Ford Rd Orlando, FL | 1.0–3.0 | 1.0–2.0 | 1011 | $1,720 | $1.70 | 15d | 1 | 0.18mi |
| 6077 Village Cir #6077 Orlando, FL | 2.0 | 2.0 | 1022 | $1,800 | $1.76 | 25d | 1 | 0.19mi |
| 6032 Village Cir N #6032 Orlando, FL | 2.0 | 2.0 | 1022 | $1,800 | $1.76 | 25d | 1 | 0.21mi |
| 6065 Village Cir #6065 Orlando, FL | 2.0 | 1.5 | 860 | $1,425 | $1.66 | 9d | 1 | 0.22mi |
| 6020 Village Cir N Orlando, FL | 2.0 | 1.5 | 825 | $1,390 | $1.68 | 25d | 1 | 0.22mi |
| 6043 Village Cir #6043 Orlando, FL | 2.0 | 1.5 | 860 | $1,550 | $1.80 | 19d | 1 | 0.23mi |
| 1854 Caralee Blvd #3 Orlando, FL | 2.0 | 1.0 | 850 | $1,700 | $2.00 | 25d | 1 | 0.25mi |
| 6031 Scotchwood Gln #204 Orlando, FL | 2.0 | 2.0 | 846 | $1,650 | $1.95 | 0d | 1 | 0.26mi |
| 1847 Caralee Blvd #4 Orlando, FL | 2.0 | 1.0 | 850 | $1,650 | $1.94 | 5d | 1 | 0.27mi |
| 6254 S Bend Sq #173 Orlando, FL | 2.0 | 2.5 | 1104 | $1,699 | $1.54 | 25d | 1 | 0.27mi |
| 6031 Scotchwood Gln Orlando, FL | 2.0 | 2.0 | 846 | $1,625 | $1.92 | 25d | 2 | 0.28mi |
| 5914 Mausser Dr Orlando, FL | 1.0–4.0 | 1.0–2.5 | 1052 | $1,771 | $1.68 | 0d | 14 | 0.30mi |
| 2683 Oak Park Way #214 Orlando, FL | 2.0 | 2.0 | 950 | $1,700 | $1.79 | 25d | 1 | 0.31mi |
| 2439 Oak Park Way #217 Orlando, FL | 2.0 | 2.0 | 953 | $1,650 | $1.73 | 4d | 1 | 0.31mi |
| 2365 Oak Park Way #109 Orlando, FL | 2.0 | 2.0 | 953 | $1,350 | $1.42 | 12d | 1 | 0.33mi |
| 2365 Oak Park Way Orlando, FL | 2.0 | 2.0 | 953 | $1,350 | $1.42 | 0d | 1 | 0.33mi |
| 2451 Oak Park Way #120 Orlando, FL | 2.0 | 2.0 | 953 | $1,700 | $1.78 | 6d | 1 | 0.33mi |
| 1724 Townhall Ln Orlando, FL | 2.0 | 1.5 | 1018 | $1,595 | $1.57 | 23d | 1 | 0.36mi |
| 6299 Arlington Ct #212 Orlando, FL | 2.0 | 1.5 | 1032 | $1,680 | $1.63 | 25d | 1 | 0.36mi |
| 1732 Hidden Creek Blvd #108 Orlando, FL | 2.0 | 2.5 | 1104 | $1,550 | $1.40 | 19d | 1 | 0.37mi |
| 1718 Silver Creek Ct #102 Orlando, FL | 2.0 | 1.5 | 1032 | $1,850 | $1.79 | 23d | 1 | 0.38mi |
| 1701 Shady Ridge Ct #247 Orlando, FL | 2.0 | 2.5 | 1104 | $1,600 | $1.45 | 25d | 1 | 0.41mi |
| 5762 Folkstone Ln Orlando, FL | 1.0–3.0 | 1.0–2.0 | 1081 | $1,967 | $1.82 | 0d | 16 | 0.47mi |
| 5870 Sundown Cir Orlando, FL | 1.0–2.0 | 1.0–2.0 | 840 | $1,744 | $2.08 | 0d | 23 | 0.49mi |
| 3217 Westridge Blvd Orlando, FL | 2.0 | 2.0 | 914 | $1,800 | $1.97 | 16d | 1 | 0.50mi |
| 3233 Candle Ridge Dr #101 Orlando, FL | 2.0 | 2.0 | 914 | $1,600 | $1.75 | 9d | 1 | 0.53mi |
| 3239 Candle Ridge Dr Orlando, FL | 2.0 | 2.0 | 914 | $2,100 | $2.30 | 25d | 1 | 0.56mi |
| 6084 Willowpointe Cir Unit 1501435P Orlando, FL | 2.0 | 2.0 | 904 | $3,413 | $3.78 | 0d | 1 | 0.65mi |
HOA detail condo
- Monthly dues
- $430 · $5,160/yr
- Likely covers
- water
- Assessments
- None detected in remarks — confirm with the listing agent.
Listing history 21 events
-
2026-04-20status Pending
-
2026-04-14$120,000 Active
-
2025-12-19historical
-
2025-12-05price $129,900
-
2025-07-30$130,000 Active
-
2024-10-01historical
-
2024-08-29price $135,000
-
2024-08-07historical
-
2024-08-05$150,000 Active
-
2024-07-31$145,000 Active
-
2023-05-04status Pending
-
2023-05-04historical
-
2023-04-23status Active
-
2023-04-13status Pending
-
2023-04-12historical
-
2023-04-08$175,000 Active
-
2006-06-22soldstatus $148,000
-
2005-03-16soldstatus $101,000
-
2003-08-29soldstatus $72,500
-
2000-01-04soldstatus $52,500
-
1997-09-30soldstatus $24,600
ⓘ Source: listings_history table (triggers on properties + properties_extension) + one-shot
backfill from property_details.listing_events for pre-trigger history.
Tax reassessment forecast FL · Resets to sale price
- Current annual tax
- $390 · $32/mo
- Projected year-2 tax
- $996 · $83/mo
- Expected delta
- +$606/yr (+$51/mo · 155.6%)
ⓘ Screening estimate from a state-policy table — verify with the county assessor before closing.
Nearby sold comps map
Loading sold comps map…
Walkable amenities ~0.75 mi
Loading nearby amenities…
Taxation est. · year 1
- Rental income
- $18,733
- − Mortgage interest
- −$6,722
- − Property taxes
- −$390
- − Insurance
- −$600
- − Repairs & maintenance
- −$1,499
- − Management
- −$1,499
- − HOA
- −$5,160
- − Depreciation
- −$3,491
- Taxable loss
- −$627
- Est. tax savings @ 24.0%
- +$151
- After-tax cash flow
- $1,248/yr
For passive investors: Depreciation is non-cash, so a rental often shows a tax loss while cash-flowing — sheltering income. Rental losses are passive: they offset passive income freely, and up to $25,000/yr can offset ordinary (W-2) income if you actively participate and your MAGI is under $100k (phasing out to $0 by $150k); unused losses carry forward. On sale, claimed depreciation is recaptured at up to 25%, and gains may owe capital-gains tax (a 1031 exchange can defer both). Figures are a year-1 estimate at your 24.0% rate — not tax advice; consult a CPA.
Schools (NCES district)
- District
- Orange
- NCES district ID
- 1201440
- Math proficiency
- 46% ▼ -9.00%
- Reading proficiency
- 51% ▼ -2.00%
- Median HH income
- $49,350
- Composite
- 41.47/100
- National rank
- #3461
- State rank
- #43 of 73 in FL
Livability — Orlando
- Score
- 86/100
- State rank
- #12
- US rank
- #360
Category grades
Schools grade is shown separately in the Schools card above.
Census & demographics
- Census place
- Orlando, FL
- County
- Orange County · 1,471,359 people
- City population
- 964,969
- Metro
- Orlando-Kissimmee-Sanford, FL
- Population (ZIP)
- 67,081
- Household income
- $56,540
- Rent vs Own
- Severe rent burden
- 4246.0
Population outlook (Orange County) Hauer SSP2
- Today (2025)
- 1,618,226 people
- By 2030
- 1,787,404 · +10.5%
- By 2040
- 2,125,621 · +31.4%
- By 2050
- 2,454,016 · +51.6%
- By 2075
- 3,173,711 · +96.1%
- By 2100
- 3,607,781 · +122.9%
Race, ethnicity, and origin ACS 2023
- Neighborhood character
- Predominantly Hispanic (68%)
- Race & ethnicity
- Hispanic / Latino 68% Two or more races 36% White 17% Black 10% Asian 2%
- Hispanic origin (detail)
- Mexican 2% Puerto Rican 38% Cuban 5% Dominican 5%
- Common ancestry
- Lithuanian 1% Romanian 1% Slovak 1%
- Foreign-born
- 27% · Canada, Jamaica, China
- Languages at home
- 36% English-only · Spanish 60% French/Haitian/Cajun 1% Arabic 1%
Political lean MEDSL · Orange
- 2024 margin
- D (+13.6) · D 56.1% · R 42.5% · Other 1.3%
- 2008→2024 swing
- -5.0pp toward R · 2008: 18.6pp · 2024: 13.6pp
- All cycles
- 2024: D+13.6 2020: D+23.1 2016: D+24.6 2012: D+18.2 2008: D+18.6
Not yet ingested
- Civics
- —
Market trends
- HPI YoY
- ▼ -95.17%
- Current HPI
- 355.5775
- Rent YoY
- ▼ -0.68%
- Metro
- Orlando-Kissimmee-Sanford, FL
- State GDP YoY
- ▲ 3.28%
- F500 in state
- 36
Industry mix (Fortune 500 HQ in FL)
| Industry | F500 HQs | Revenue |
|---|---|---|
| Industrial Technology | 2 | $29B |
|
||
| Insurance | 2 | $17B |
|
||
| Retail | 1 | $60B |
|
||
| Technology Distribution | 1 | $58B |
|
||
| Homebuilding | 1 | $35B |
|
||
| Technology Manufacturing | 1 | $35B |
|
||
Price history
+387.8% since first listed21 events — show timeline
- 2026-04-20 Pending — Stellar MLS as Distributed by MLS Grid
- 2026-04-14 Listed $120,000 Stellar MLS as Distributed by MLS Grid
- 2025-12-19 Listing Removed — Stellar MLS as Distributed by MLS Grid
- 2025-12-05 Price Changed $129,900 Stellar MLS as Distributed by MLS Grid
- 2025-07-30 Listed $130,000 Stellar MLS as Distributed by MLS Grid
- 2024-10-01 Listing Removed — Stellar MLS as Distributed by MLS Grid
- 2024-08-29 Price Changed $135,000 Stellar MLS as Distributed by MLS Grid
- 2024-08-07 Listing Removed — Stellar MLS as Distributed by MLS Grid
- 2024-08-05 Listed $150,000 Stellar MLS as Distributed by MLS Grid
- 2024-07-31 Listed $145,000 Stellar MLS as Distributed by MLS Grid
- 2023-05-04 Pending — Stellar MLS as Distributed by MLS Grid
- 2023-05-04 Listing Removed — Stellar MLS as Distributed by MLS Grid
- 2023-04-23 Relisted — Stellar MLS as Distributed by MLS Grid
- 2023-04-13 Pending — Stellar MLS as Distributed by MLS Grid
- 2023-04-12 Listing Removed — Stellar MLS as Distributed by MLS Grid
- 2023-04-08 Listed $175,000 Stellar MLS as Distributed by MLS Grid
- 2006-06-22 Sold (Public Records) $148,000 Public Records
- 2005-03-16 Sold (Public Records) $101,000 Public Records
- 2003-08-29 Sold (Public Records) $72,500 Public Records
- 2000-01-04 Sold (Public Records) $52,500 Public Records
- 1997-09-30 Sold (Public Records) $24,600 Public Records
Property tax history
+6.2%/yrLatest (2025): $390 · +13.8% YoY. Source: county tax records.
Cash-flow waterfall
monthlySold comps — $/sqft
last 12 mo · ≤1 miLoading sold comps…