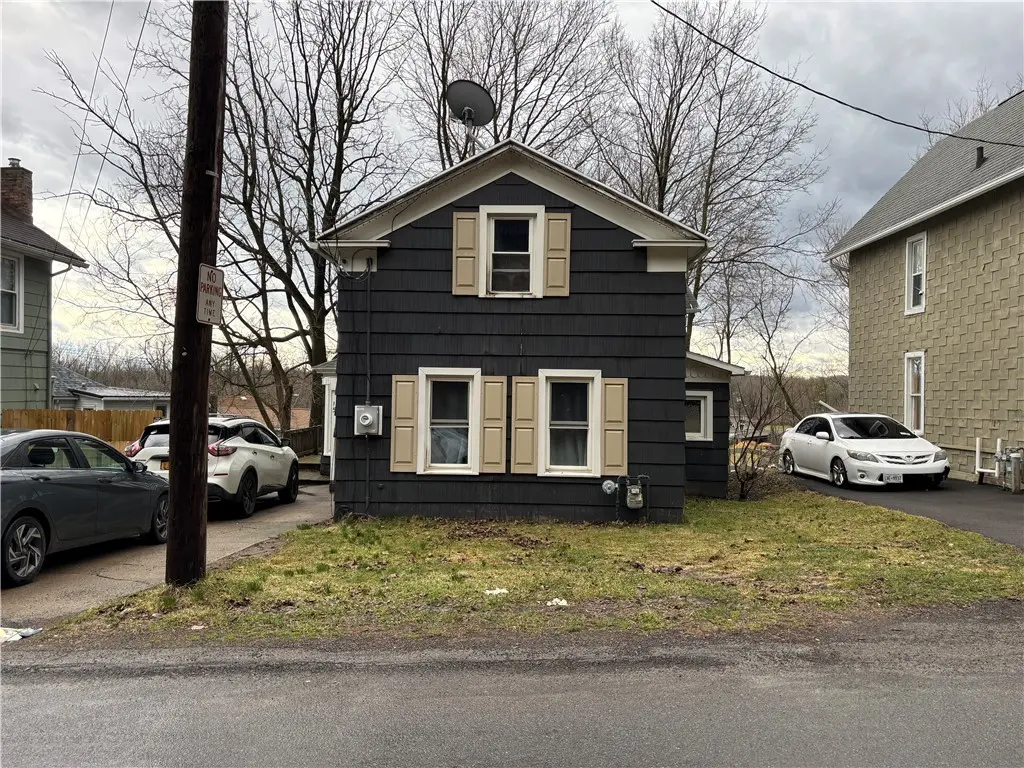
15 Layton St · Lyons, NY
Flood risk 1/10 · Minimal
- FEMA flood zone
- —
- Chance of flooding over 30 yrs
- 0.0%
- Est. flood insurance / yr
- —
Fire risk 3/10 · Minor
- Est. fire insurance / yr
- $691 – $1,283
Heat risk 2/10 · Minimal
- Hot days now (above 96°F)
- 7 days/yr
- Hot days in 30 yrs
- 15 days/yr
Wind risk 1/10 · Minimal
- Chance of severe wind over 30 yrs
- —
Air-quality risk 2/10 · Minimal
- Unhealthy air days now
- 1 days/yr
- Unhealthy air days in 30 yrs
- 2 days/yr
Risk factors via First Street. Map © Google.
Why this score? — see what drove the A- grade
The composite is a weighted blend of 9 inputs, each scored 0–100. Each bar is that input's sub-score; the figure is the points it added to the 100-point composite (weight × sub-score).
- Cash flow +30.0/30.0
- ARV discount +11.5/15.0
- DSCR +10.0/10.0
- Appreciation +10.0/10.0
- 1% rule +9.5/10.0
- Livability +3.8/5.0
- Schools +3.2/10.0
- Rent growth +2.5/5.0
- Condition / age +2.5/5.0
$120,000
🖨 Deal sheet (PDF) 📄 Offer letter ✓ Due diligence
Listing remarks MLS
Opportunity awaits at 15 Layton Street in Lyons! This 3-bedroom, 2-bath home offers over 1,200 sq ft of living space and solid bones for its next owner. Recent updates include a newer furnace and hot water heater, giving buyers a great head start on improvements. The home features a fully fenced backyard, perfect for pets, gardening, or outdoor entertaining. With a little cosmetic updating, this property could truly shine. Whether you're a first-time buyer looking to build equity or an investor seeking your next project, this home offers great potential in a convenient village location . Short trip to Thruway for easy communting .
Key facts
- Newer furnace
- Hot water heater
- 4,792 sq ft lot
Tags
Neighborhood map
What this means for you Summary
Snapshot
- This is a 3-bed/1.0-bath single-family listed at $120k.
Deal economics
- At list price, monthly cash flow is $511 ($6k/yr) — positive.
- The deal already cash-flows at list — no discount required.
- Meets the 1% rule at list price ($2k rent vs $120k).
- Recommended offer: $109k (9.0% below list) — sets the bar for market timing.
Location & tenants
- Location reads 75/100 on livability (#270 in NY, #4,307 nationally) — a middle-class / working-renter tenant base. Strengths: cost of living A+, housing A+, health & safety A+; Watch: employment D, amenities F.
- Lyons Central School District (town): math 33% / reading 42% proficiency, ranked #549 of 590 in NY (top 93%) — families likely to look elsewhere, expect single-tenant / working-renter base with shorter leases.
- Zoned schools: Lyons Elementary School (math 27% / reading 37%, grade F, #1,646 of 2,108 statewide, top 80%, 492 students, 59% FRL); Lyons Middle School (math 2% / reading 27%, grade F, #704 of 729 statewide, top 98%, 124 students, 66% FRL); Lyons Senior High School (math 82% / reading 84%, grade A, #435 of 1,100 statewide, top 40%, 259 students, 62% FRL).
- Market conditions: 27 active listings in the ZIP; 259 units permitted in Wayne County in 2024 (90 in 5+ unit buildings).
Forward outlook
- In year one you build about $13k of equity ($830 loan paydown + $12k appreciation (10.0% local appreciation)).
- Wayne County population projected at -24% by 2050 — secular population decline; favor cash flow + early exit over multi-decade hold.
- At projected returns (10.0% appreciation + 3.0% rent growth), your $34k cash investment doubles in ~2 years — after that, you're playing with house money.
- By year 3, paydown + projected appreciation supports a ~$32k cash-out refi (75% LTV) — recoverable capital for the next deal without selling this one.
Negotiation context
- It's been on market 98 days — a 9% lower offer ($109k) is reasonable based on typical stale-listing flexibility.
Risks & watch-outs
- Watch-outs: built in 1880 — expect roof / HVAC / electrical / plumbing capex.
Questions for the listing agent
- It's been on market 98 days. Have you received any prior offers? Is the seller open to a 9% concession, seller financing, or rate buy-down credit?
- Built in 1880 — when were the roof, HVAC, electrical panel, plumbing, and water heater last replaced?
- Why hasn't it sold? Are there any deal-killer items the seller is aware of (foundation, flood, title, zoning, code violations)?
- Is there a deadline driving the sale (1031 exchange, divorce, estate, relocation)? That informs how much negotiation room exists.
- Schools are D-rated, which usually means shorter tenancies and higher turnover. Who's the typical renter profile here, and what's been the actual vacancy rate?
- What's the average days-on-market for RENTAL listings here right now (not sales)? A rising rental-DOM trend means longer vacancies and softer asking-rent achievability than the comps imply.
- What's the recent tenant-quality profile in this submarket — average credit score on applications, eviction rate, late-payment / NSF rate, and stable-employment percentage? A property-management company in the area should have these aggregated.
- How much new for-sale + rental construction is in the pipeline within 1–3 miles? Heavy new supply typically softens prices + rents 12–24 months out; constrained supply supports both.
Investment metrics
- 1% rule
- 1.45% ✓
- Cap rate
- 11.41%
- Cash-on-cash
- 18.27%
- DSCR
- 1.81
- GRM
- 5.7
CMA / ARV
- ARV (median comp)
- $131,771
- List price
- $120,000
- Delta
- -8.93%
- Verdict
- FAIR
- Comps
- 20 within 1.0 mi
Show comp detail 12 sales within ~0.75 mi
| Address | Dist | Beds/Ba | Sqft | Sold | Price | $/sf | Match |
|---|---|---|---|---|---|---|---|
| 8 Layton St | 0.03mi | 3/1.5 | 1,268 (+1%) | 20mo | $75,000 | $59 | 78 |
| 4 Rice St | 0.54mi | 3/1.0 | 1,196 (-5%) | 5mo | $70,000 | $59 | 63 |
| 47 Montezuma St | 0.72mi | 3/1.5 | 1,264 (+1%) | 4mo | $75,000 | $59 | 60 |
| 2 Elm St | 0.56mi | 3/1.0 | 1,356 (+8%) | 3mo | $149,000 | $110 | 58 |
| 3 Maple St | 0.58mi | 3/2.0 | 1,226 (-2%) | 9mo | $110,000 | $90 | 58 |
| 21 Dickerson St | 0.33mi | 3/1.5 | 1,125 (-10%) | 12mo | $190,000 | $169 | 56 |
| 46 Dickerson St | 0.46mi | 3/1.5 | 1,348 (+7%) | 11mo | $183,000 | $136 | 55 |
| 38 Shuler St | 0.69mi | 3/1.0 | 1,260 (+0%) | 15mo | $79,000 | $63 | 54 |
| 14 Hillcrest Dr | 0.60mi | 3/1.5 | 1,340 (+7%) | 12mo | $196,000 | $146 | 49 |
| 20 High St | 0.32mi | 2/1.0 (-1) | 1,126 (-10%) | 18mo | $105,000 | $93 | 48 |
| 46 Shuler St | 0.72mi | 3/1.0 | 1,128 (-10%) | 6mo | $84,500 | $75 | 44 |
| 3 Scott St | 0.67mi | 3/1.5 | 1,392 (+11%) | 15mo | $125,500 | $90 | 37 |
Match score weights: distance 35% · size 25% · config 20% · recency 20%. Top-matched comps best support the ARV.
Projected returns pro-forma
10.0% appreciation · 3.0% rent growth · sell at horizon
- IRR
- 37.9%
- Equity multiple
- 3.92×
- Total profit
- $97,976
- Equity at exit
- $108,106
- IRR
- 32.6%
- Equity multiple
- 8.83×
- Total profit
- $263,000
- Equity at exit
- $233,134
Cash invested: $33,600 (down + closing). Projections, not guarantees.
Landlord ↔ Tenant lean methodology
- Overall (STATE)
- 15 Strongly Tenant-Friendly
- State New York
- 15 Strongly Tenant-Friendly · D+10
- County
- — inherits STATE
- City
- — inherits STATE
ZIP-level market 14489
- Home prices YoY
- 14.2%
- Active inventory
- 27
- Price-to-rent
- 5.7×
Monthly cashflow live
- Estimated rent
- $1,740 medium interval (Pro) →
- Mortgage (P&I)
- −$629
- Tax from tax record
- −$184 /mo · $2,204/yr
- Insurance
- −$50
- HOA
- −$0
- Vacancy / Maint / Mgmt
- −$365
- Net cashflow
- $511
Break-even live
Sensitivity live
| Price | -10% $579 | -5% $545 | +0% $511 | +5% $477 | +10% $444 |
|---|---|---|---|---|---|
| Rent | -10% $374 | -5% $443 | +0% $511 | +5% $580 | +10% $649 |
| Rate | -1.0pp $572 | -0.5pp $542 | base $511 | +0.5pp $480 | +1.0pp $449 |
UW: 25.0% down · 7.5% · 30yr · 1.5% tax · 5.0% vac · 8.0% maint · 8.0% mgmt
Financing live
Cash to close
- Down payment
- $30,000
- Closing costs
- $3,600
- Reserves months
- —
- Total cash needed
- —
Loan-product check · same deal, 3 products live
Conventional
25% down · 7.5% · 30yr
- Down + closing
- —
- Monthly P&I
- —
- Monthly cashflow
- —
- DSCR
- —
- Eligible?
- —
Personal DTI + credit; lowest rate.
DSCR
20% down · 8.5% · 30yr
- Down + closing
- —
- Monthly P&I
- —
- Monthly cashflow
- —
- DSCR
- —
- Eligible?
- —
No personal income docs; deal must DSCR.
Hard money
10% down · 12.0% · 12mo
- Down + closing
- —
- Monthly P&I
- —
- Monthly cashflow
- —
- DSCR
- —
- Eligible?
- —
Short-term bridge; refi at stabilization.
Listing history 18 events
-
2026-06-22days on market $120,000 Active 98 DOM
-
2026-06-21days on market $120,000 Active 97 DOM
-
2026-06-21days on market $120,000 Active 96 DOM
-
2026-06-18days on market $120,000 Active 94 DOM
-
2026-06-17days on market $120,000 Active 93 DOM
-
2026-06-16days on market $120,000 Active 92 DOM
-
2026-06-15days on market $120,000 Active 91 DOM
-
2026-06-13days on market $120,000 Active 89 DOM
-
2026-06-12days on market $120,000 Active 88 DOM
-
2026-06-09days on market $120,000 Active 85 DOM
-
2026-06-08days on market $120,000 Active 84 DOM
-
2026-06-07days on market $120,000 Active 83 DOM
-
2026-06-07days on market $120,000 Active 82 DOM
-
2026-06-04days on market $120,000 Active 79 DOM
-
2026-06-02days on market $120,000 Active 78 DOM
-
2026-06-01days on market $120,000 Active 77 DOM
-
2026-05-31days on market $120,000 Active 76 DOM
-
2026-03-16$120,000 Active 638-char remark
Show marketing remark (638 chars)
Opportunity awaits at 15 Layton Street in Lyons! This 3-bedroom, 2-bath home offers over 1,200 sq ft of living space and solid bones for its next owner. Recent updates include a newer furnace and hot water heater, giving buyers a great head start on improvements. The home features a fully fenced backyard, perfect for pets, gardening, or outdoor entertaining. With a little cosmetic updating, this property could truly shine. Whether you're a first-time buyer looking to build equity or an investor seeking your next project, this home offers great potential in a convenient village location . Short trip to Thruway for easy communting .
ⓘ Source: listings_history table (triggers on properties + properties_extension) + one-shot
backfill from property_details.listing_events for pre-trigger history.
Tax reassessment forecast NY · Partial reset (capped growth)
- Current annual tax
- $2,204 · $184/mo
- Projected year-2 tax
- $2,204 · $184/mo
- Expected delta
- $0/yr ($0/mo · 0.0%)
ⓘ Screening estimate from a state-policy table — verify with the county assessor before closing.
Climate risk First Street
- Flood 1/10 Low 0% chance over 30 yrs
- Wildfire 3/10 Moderate
- Heat 2/10 Low 7 d/yr ≥96°F today · 15 d/yr by 30 yrs out
- Wind 1/10 Low
- Air quality 2/10 Low 1 unhealthy d/yr today · 2 by 30 yrs out
Nearby sold comps map
Loading sold comps map…
Walkable amenities ~0.75 mi
Loading nearby amenities…
Taxation est. · year 1
- Rental income
- $20,877
- − Mortgage interest
- −$6,722
- − Property taxes
- −$2,204
- − Insurance
- −$600
- − Repairs & maintenance
- −$1,670
- − Management
- −$1,670
- − Depreciation
- −$3,491
- Taxable income
- $4,520
- Est. tax owed @ 24.0%
- −$1,085
- After-tax cash flow
- $5,052/yr
For passive investors: Depreciation is non-cash, so a rental often shows a tax loss while cash-flowing — sheltering income. Rental losses are passive: they offset passive income freely, and up to $25,000/yr can offset ordinary (W-2) income if you actively participate and your MAGI is under $100k (phasing out to $0 by $150k); unused losses carry forward. On sale, claimed depreciation is recaptured at up to 25%, and gains may owe capital-gains tax (a 1031 exchange can defer both). Figures are a year-1 estimate at your 24.0% rate — not tax advice; consult a CPA.
Schools (NCES district)
- District
- Lyons Central School District
- NCES district ID
- 3618030
- Math proficiency
- 33% ▲ 4.00%
- Reading proficiency
- 42% ▼ -28.00%
- Median HH income
- $43,076
- Composite
- 31.73/100
- National rank
- #5909
- State rank
- #549 of 590 in NY
Livability — Lyons
- Score
- 75/100
- State rank
- #270
- US rank
- #4307
Category grades
Schools grade is shown separately in the Schools card above.
Census & demographics
- Census place
- Lyons, NY
- Population (ZIP)
- 7,016
Population outlook (Wayne County) Hauer SSP2
- Today (2025)
- 85,662 people
- By 2030
- 81,945 · -4.3%
- By 2040
- 73,735 · -13.9%
- By 2050
- 65,029 · -24.1%
- By 2075
- 47,451 · -44.6%
- By 2100
- 31,574 · -63.1%
Race, ethnicity, and origin ACS 2023
- Neighborhood character
- Predominantly White (86%)
- Race & ethnicity
- White 86% Hispanic / Latino 8% Two or more races 7% Black 2%
- Hispanic origin (detail)
- Puerto Rican 7%
- Common ancestry
- Iranian 8% Romanian 5% Lithuanian 3%
- Foreign-born
- 1% · Canada
- Languages at home
- 90% English-only · German/W. Germanic 7% Spanish 3% Russian/Polish/Slavic 1%
Political lean MEDSL · Wayne
- 2024 margin
- Strong R (+23.1) · D 38.5% · R 61.5%
- 2008→2024 swing
- -13.2pp toward R · 2008: -9.9pp · 2024: -23.1pp
- All cycles
- 2024: R+23.1 2020: R+19.6 2016: R+26.1 2012: R+9.3 2008: R+9.9
Not yet ingested
- Civics
- —
Market trends
- HPI YoY
- ▲ 38.65%
- Current HPI
- 311.1445
- Rent YoY
- —
- Metro
- —
- State GDP YoY
- ▲ 2.60%
- F500 in state
- 92
Industry mix (Fortune 500 HQ in NY)
| Industry | F500 HQs | Revenue |
|---|---|---|
| Financial Services | 10 | $950B |
|
||
| Consumer Goods | 9 | $162B |
|
||
| Insurance | 4 | $225B |
|
||
| Telecommunications | 2 | $144B |
|
||
| Pharmaceuticals | 2 | $112B |
|
||
| Media / Entertainment | 2 | $69B |
|
||
Price history
1 event — show timeline
- 2026-03-16 Listed $120,000 UNYREIS
Property tax history
+1.5%/yrLatest (2025): $2,204 · +6.1% YoY. Source: county tax records.
Cash-flow waterfall
monthlySold comps — $/sqft
last 12 mo · ≤1 miLoading sold comps…