48 Echo Lake Dr W · Monrovia, IN
Flood risk 1/10 · Minimal
- FEMA flood zone
- X (unshaded)
- Chance of flooding over 30 yrs
- 0.0%
- Est. flood insurance / yr
- $473 – $860
Fire risk 1/10 · Minimal
- Est. fire insurance / yr
- $717 – $1,331
Heat risk 3/10 · Minor
- Hot days now (above 102°F)
- 7 days/yr
- Hot days in 30 yrs
- 19 days/yr
Wind risk 2/10 · Minimal
- Chance of severe wind over 30 yrs
- 1.0%
Air-quality risk 2/10 · Minimal
- Unhealthy air days now
- 1 days/yr
- Unhealthy air days in 30 yrs
- 2 days/yr
Risk factors via First Street. Map © Google.
Why this score? — see what drove the B grade
The composite is a weighted blend of 9 inputs, each scored 0–100. Each bar is that input's sub-score; the figure is the points it added to the 100-point composite (weight × sub-score).
- Cash flow +30.0/30.0
- 1% rule +10.0/10.0
- DSCR +10.0/10.0
- ARV discount +7.5/15.0
- Condition / age +3.8/5.0
- Schools +3.4/10.0
- Livability +3.3/5.0
- Rent growth +2.5/5.0
- Appreciation +0.0/10.0
$55,750
🖨 Deal sheet 📄 Offer letter ✓ Due diligence
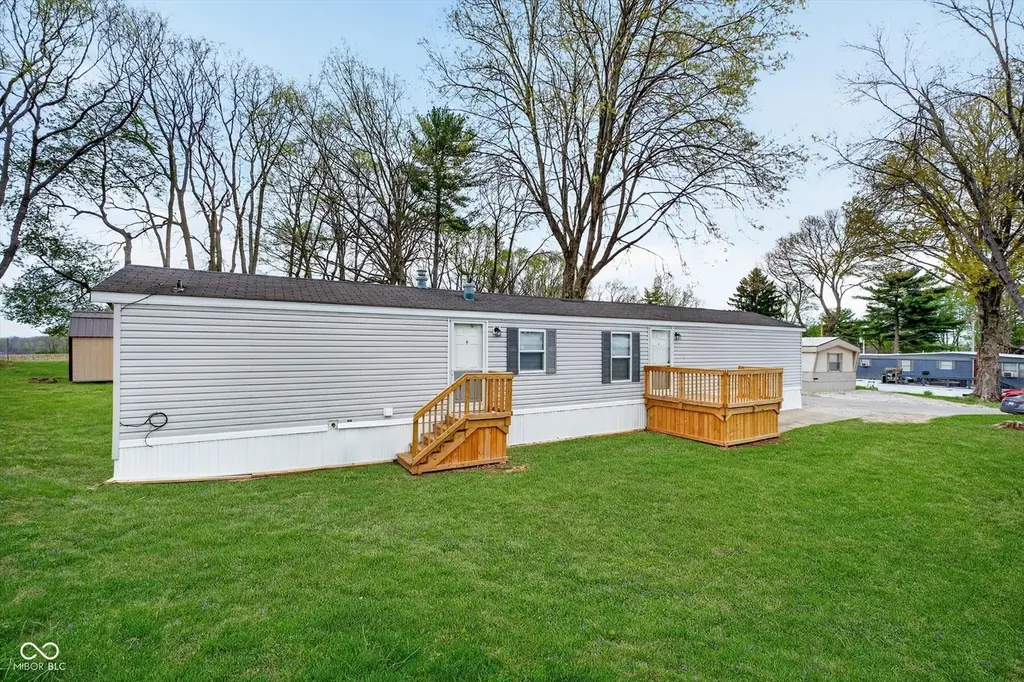
Listing remarks
Low maintenance living can be yours with this 924 sf 3 BR/2 BA completely remodeled home in the picturesque Echo Lake Community. This home has more new things than you can count. New paint, floor coverings, drywall, toilets, master bath fixtures, complete new kitchen, Air Conditioning, decks, skirting, windows and doors. All for a fraction of what it would take to buy a house in a subdivision. Enjoy off street parking, no one above or below you, and maintain your own yard space. Mini barns allowed pet friendly. The Echo Lake Community offers a fishing lake, walking trails, covered mailbox areas, playgrounds, BB court, and soon picnic shelters for family gatherings. We are located close to t
Key facts
- Air conditioning
- New kitchen
- Off street parking
Tags
Property features AI
Finance
- Other: Lot size approximately 0.115 acre (<1/4 acre); Model/legal: 2005 Skyline 14x66; GPS-friendly directions
- HOA & community: Homeowners association with monthly fee of $500; HOA includes maintenance, park/playground, management, snow removal and trash; Low-maintenance lifestyle community
Exterior
- Parking: Gravel parking
- Security: Security lights; Smoke detectors
- Utilities: Public water; Community sewer; Separate electric and gas meters; No solid waste service listed
- Home design: Manufactured home; One level; Faces southeast; Updated / remodeled condition; Ownership: Other / see remarks
- Construction: Vinyl siding; Crawl space foundation; Built by Skyline
- Exterior features: Deck; No fence; Lot has access
Interior
- Kitchen: Range hood; Water heater
- Bedrooms: Three bedrooms on the main level
- Bathrooms: Two full bathrooms on the main level
- Heating & cooling: Natural gas heating; Central air conditioning
- Interior features: Vaulted ceilings; Eat-in kitchen
- Laundry & utility: In-unit laundry with all connections; Dedicated laundry room
Neighborhood map
What this means for you Summary
Snapshot
- This is a 3-bed/2.0-bath manufactured listed at $56k. Condition is rated good.
Deal economics
- At list price, monthly cash flow is $313 ($4k/yr) — positive.
- The deal already cash-flows at list — no discount required.
- Meets the 1% rule at list price ($2k rent vs $56k).
- Recommended offer: $54k (3.0% below list) — sets the bar for market timing.
- Cap rate 13.0% vs local median 4.5% in Monrovia — top-decile yield for the area; either an underpriced asset or a hidden risk that comps aren't pricing in. Stress-test before assuming the spread holds.
Location & tenants
- Location reads 66/100 on livability (#304 in IN) — a middle-class / working-renter tenant base. Strengths: crime A+, employment A+, cost of living A+; Watch: amenities F, commute F, health & safety F.
- Monroe-Gregg School District (rural): math 31% / reading 45% proficiency, ranked #143 of 301 in IN (top 48%) — families likely to look elsewhere, expect single-tenant / working-renter base with shorter leases.
- Zoned schools: Monrovia Elementary School (math 42% / reading 44%, grade F, #417 of 994 statewide, top 43%, 702 students, 47% FRL); Monrovia High School (math 32% / reading 57%, grade F, #169 of 369 statewide, top 51%, 528 students, 36% FRL).
- Market conditions: 134 active listings in the ZIP; 330 units permitted in Morgan County in 2024 (0 in 5+ unit buildings).
Forward outlook
- Local home prices are declining (-3.0%/yr); year-one equity from $386 of loan paydown is wiped out by about $2k of value loss. Plan a longer hold.
- Morgan County population projected to shrink 6% by 2050 — rents likely to lag national; underwrite the cash flow, not the appreciation.
- At projected returns (-3.0% appreciation + 3.0% rent growth), your $16k cash investment doubles in ~5 years — after that, you're playing with house money.
Negotiation context
- It's been on market 34 days — a 3% lower offer ($54k) is reasonable based on typical stale-listing flexibility.
Risks & watch-outs
- Watch-outs: HOA is 33% of rent.
Questions for the listing agent
- It's been on market 34 days. Have you received any prior offers? Is the seller open to a 3% concession, seller financing, or rate buy-down credit?
- What does the HOA fee cover, when was the last increase, and are there any pending special assessments or reserve-fund shortfalls?
- Is there a deadline driving the sale (1031 exchange, divorce, estate, relocation)? That informs how much negotiation room exists.
- Schools are D-rated, which usually means shorter tenancies and higher turnover. Who's the typical renter profile here, and what's been the actual vacancy rate?
- What's the average days-on-market for RENTAL listings here right now (not sales)? A rising rental-DOM trend means longer vacancies and softer asking-rent achievability than the comps imply.
- What's the recent tenant-quality profile in this submarket — average credit score on applications, eviction rate, late-payment / NSF rate, and stable-employment percentage? A property-management company in the area should have these aggregated.
- How much new for-sale + rental construction is in the pipeline within 1–3 miles? Heavy new supply typically softens prices + rents 12–24 months out; constrained supply supports both.
Investment metrics
- 1% rule
- 2.72% ✓
- Cap rate
- 13.03%
- Cash-on-cash
- 24.06%
- DSCR
- 2.07
- GRM
- 3.1
CMA / ARV
No comps found within radius.
Projected returns pro-forma
-3.0% appreciation · 3.0% rent growth · sell at horizon
- IRR
- 17.7%
- Equity multiple
- 1.72×
- Total profit
- $11,230
- Equity at exit
- $8,313
- IRR
- 26.4%
- Equity multiple
- 3.36×
- Total profit
- $36,788
- Equity at exit
- $4,820
Cash invested: $15,610 (down + closing). Projections, not guarantees.
Landlord ↔ Tenant lean methodology
- Overall (STATE)
- 90 Strongly Landlord-Friendly
- State Indiana
- 90 Strongly Landlord-Friendly · R+11
- County
- — inherits STATE
- City
- — inherits STATE
ZIP-level market 46158
- Home prices YoY
- -26.3%
- Active inventory
- 134
- Price-to-rent
- 3.1×
Monthly cashflow live
- Estimated rent
- $1,517 medium interval (Pro) →
- Mortgage (P&I)
- −$292
- Tax est. 1.5%
- −$70 /mo · $836/yr
- Insurance
- −$23
- HOA
- −$500
- Vacancy / Maint / Mgmt
- −$319
- Net cashflow
- $313
Break-even live
UW: 25.0% down · 7.5% · 30yr · 1.5% tax · 5.0% vac · 8.0% maint · 8.0% mgmt
Financing live
Cash to close
- Down payment
- $13,938
- Closing costs
- $1,672
- Reserves months
- —
- Total cash needed
- —
Loan-product check · same deal, 3 products live
Conventional
25% down · 7.5% · 30yr
- Down + closing
- —
- Monthly P&I
- —
- Monthly cashflow
- —
- DSCR
- —
- Eligible?
- —
Personal DTI + credit; lowest rate.
DSCR
20% down · 8.5% · 30yr
- Down + closing
- —
- Monthly P&I
- —
- Monthly cashflow
- —
- DSCR
- —
- Eligible?
- —
No personal income docs; deal must DSCR.
Hard money
10% down · 12.0% · 12mo
- Down + closing
- —
- Monthly P&I
- —
- Monthly cashflow
- —
- DSCR
- —
- Eligible?
- —
Short-term bridge; refi at stabilization.
HOA detail
- Monthly dues
- $500 · $6,000/yr
- Likely covers
- landscaping
Listing history 14 events
-
2026-06-18days on market $55,750 Active 34 DOM
-
2026-06-17days on market $55,750 Active 33 DOM
-
2026-06-16days on market $55,750 Active 32 DOM
-
2026-06-15days on market $55,750 Active 31 DOM
-
2026-06-13days on market $55,750 Active 29 DOM
-
2026-06-09days on market $55,750 Active 25 DOM
-
2026-06-08days on market $55,750 Active 24 DOM
-
2026-06-07days on market $55,750 Active 23 DOM
-
2026-06-05days on market $55,750 Active 20 DOM
-
2026-06-03days on market $55,750 Active 19 DOM
-
2026-06-02days on market $55,750 Active 18 DOM
-
2026-06-01days on market $55,750 Active 17 DOM
-
2026-05-31days on market $55,750 Active 16 DOM
-
2026-05-15$55,750 Active 791-char remark
ⓘ Source: listings_history table (triggers on properties + properties_extension) + one-shot
backfill from property_details.listing_events for pre-trigger history.
Climate risk First Street
- Flood 1/10 Low FEMA zone X (unshaded) · 0% chance over 30 yrs
- Wildfire 1/10 Low
- Heat 3/10 Moderate 7 d/yr ≥102°F today · 19 d/yr by 30 yrs out
- Wind 2/10 Low 100% chance of damaging wind over 30 yrs
- Air quality 2/10 Low 1 unhealthy d/yr today · 2 by 30 yrs out
Nearby sold comps map
Loading sold comps map…
Walkable amenities ~0.75 mi
Loading nearby amenities…
Taxation est. · year 1
- Rental income
- $18,201
- − Mortgage interest
- −$3,123
- − Property taxes
- −$836
- − Insurance
- −$279
- − Repairs & maintenance
- −$1,456
- − Management
- −$1,456
- − HOA
- −$6,000
- − Depreciation
- −$1,622
- Taxable income
- $3,429
- Est. tax owed @ 24.0%
- −$823
- After-tax cash flow
- $2,933/yr
For passive investors: Depreciation is non-cash, so a rental often shows a tax loss while cash-flowing — sheltering income. Rental losses are passive: they offset passive income freely, and up to $25,000/yr can offset ordinary (W-2) income if you actively participate and your MAGI is under $100k (phasing out to $0 by $150k); unused losses carry forward. On sale, claimed depreciation is recaptured at up to 25%, and gains may owe capital-gains tax (a 1031 exchange can defer both). Figures are a year-1 estimate at your 24.0% rate — not tax advice; consult a CPA.
Condition & rehab AI · 13 photos
This 924 sq ft 3 BR/2 BA home in the Echo Lake Community is fully remodeled with new paint, flooring, and appliances. It offers low maintenance living with a new deck, landscaping, and air conditioning. The home is move-in ready and has a good condition score.
Value-add opportunities
- Resale Paint the exterior siding — Enhances curb appeal and value
- Resale Replace the deck if necessary — Improves outdoor living space and value
- Resale Inspect and replace any damaged windows — Ensures energy efficiency and safety
Renovation cost estimate screening
Value-add ROI direction
- Resale Paint the exterior siding — Enhances curb appeal and value ↑
- Resale Replace the deck if necessary — Improves outdoor living space and value ↑
- Resale Inspect and replace any damaged windows — Ensures energy efficiency and safety ↑
ⓘ Cost ranges are severity-bucket heuristics (US national rule-of-thumb). Get contractor quotes + a written scope before underwriting a rehab budget.
Schools (NCES district)
- District
- Monroe-Gregg School District
- NCES district ID
- 1804140
- Math proficiency
- 31% ▼ -9.00%
- Reading proficiency
- 45% ▼ -4.00%
- Median HH income
- $64,767
- Composite
- 34.2/100
- National rank
- #5266
- State rank
- #143 of 301 in IN
Livability — Monrovia
- Score
- 66/100
- State rank
- #304
- US rank
- #12092
Category grades
Schools grade is shown separately in the Schools card above.
Census & demographics
- Population (ZIP)
- 24,622
Population outlook (Morgan County) Hauer SSP2
- Today (2025)
- 71,081 people
- By 2030
- 71,178 · +0.1%
- By 2040
- 69,907 · -1.7%
- By 2050
- 66,455 · -6.5%
- By 2075
- 57,291 · -19.4%
- By 2100
- 43,782 · -38.4%
Race, ethnicity, and origin ACS 2023
- Neighborhood character
- Predominantly White (94%)
- Race & ethnicity
- White 94% Two or more races 3% Hispanic / Latino 2%
- Common ancestry
- Slovak 2% Italian 2% Iranian 2%
- Foreign-born
- 1% · Canada
- Languages at home
- 98% English-only · Spanish 1%
Political lean MEDSL · Morgan
- 2024 margin
- Solid R (+54.3) · D 22.0% · R 76.3% · Other 1.7%
- 2008→2024 swing
- -27.3pp toward R · 2008: -27.1pp · 2024: -54.3pp
- All cycles
- 2024: R+54.3 2020: R+54.6 2016: R+56.6 2012: R+41.1 2008: R+27.1
Not yet ingested
- Civics
- —
Market trends
- HPI YoY
- ▼ -90.62%
- Current HPI
- 254.0837
- Rent YoY
- —
- Metro
- —
- State GDP YoY
- ▲ 2.90%
- F500 in state
- 18
Industry mix (Fortune 500 HQ in IN)
| Industry | F500 HQs | Revenue |
|---|---|---|
| Industrial Machinery | 2 | $37B |
|
||
| Healthcare | 1 | $177B |
|
||
| Pharmaceuticals | 1 | $45B |
|
||
| Metals / Steel | 1 | $18B |
|
||
| Agriculture | 1 | $17B |
|
||
| Packaging | 1 | $12B |
|
||
Price history
1 event — show timeline
- 2026-05-15 Listed $55,750 MIBOR as Distributed by MLS Grid
Cash-flow waterfall
monthlySold comps — $/sqft
last 12 mo · ≤1 miLoading sold comps…