 Duplex
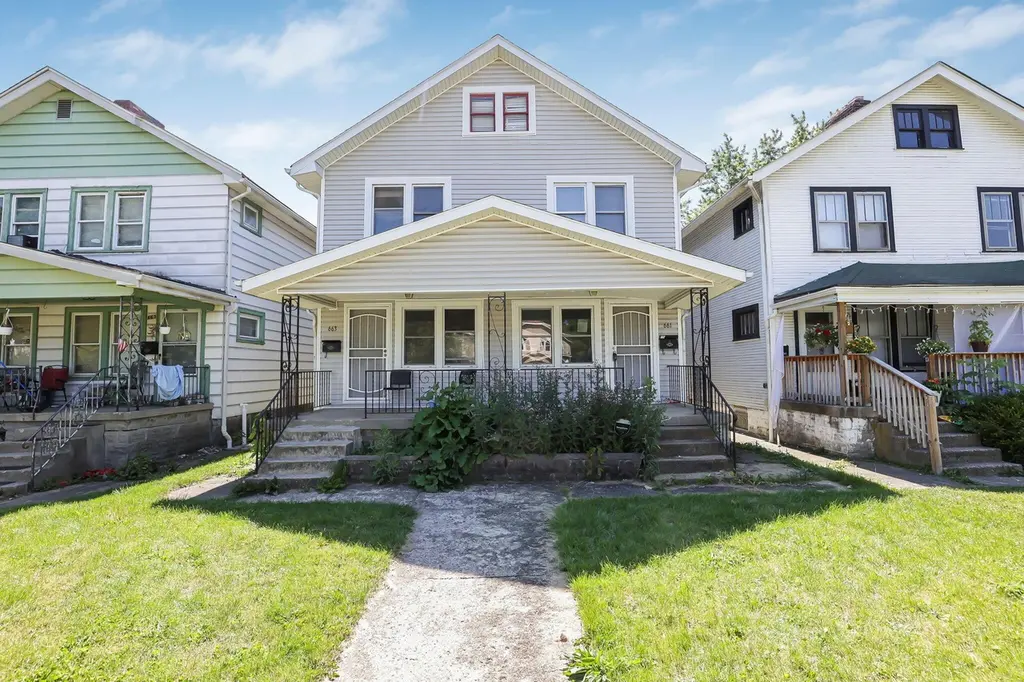
661-663 S Burgess Ave · Columbus, OH
Flood risk 1/10 · Minimal
- FEMA flood zone
- X (unshaded)
- Chance of flooding over 30 yrs
- 0.0%
- Est. flood insurance / yr
- $473 – $860
Fire risk 1/10 · Minimal
- Est. fire insurance / yr
- $713 – $1,323
Heat risk 4/10 · Minor
- Hot days now (above 102°F)
- 7 days/yr
- Hot days in 30 yrs
- 18 days/yr
Wind risk 2/10 · Minimal
- Chance of severe wind over 30 yrs
- 1.0%
Air-quality risk 2/10 · Minimal
- Unhealthy air days now
- 1 days/yr
- Unhealthy air days in 30 yrs
- 2 days/yr
Risk factors via First Street. Map © Google.
Why this score? — see what drove the D+ grade
The composite is a weighted blend of 9 inputs, each scored 0–100. Each bar is that input's sub-score; the figure is the points it added to the 100-point composite (weight × sub-score).
- Cash flow +23.8/30.0
- DSCR +7.7/10.0
- 1% rule +5.6/10.0
- Livability +4.0/5.0
- Rent growth +3.6/5.0
- Condition / age +2.5/5.0
- Schools +1.7/10.0
- ARV discount +0.5/15.0
- Appreciation +0.0/10.0
$239,900
🖨 Deal sheet 📄 Offer letter ✓ Due diligence
Multi-family units
County records classify this as Multi-Family (2-4 Unit). Listing-text estimate: 2 units. confirmed
Listing remarks
Well-maintained duplex investment opportunity in Columbus! One unit is currently occupied at $900/month, under market rent. while the other unit provides flexibility for an owner-occupant or additional tenant. Features include a roof less than 5 years old, central air on one side, and updated hot water tank in Unit 661 (2024). Unit 661 also offers 1.5 baths. Detached 2 car garage adds opportunity for additional/higher rental income
Key facts
- Central air
- 4,791 sq ft lot
- Built 1926
Tags
Property features AI
Finance
- Other: Cross street: Burroughs; Listing status: Standard special listing conditions
- Financial info: 2024 annual tax: $2,244
Exterior
- Home design: Duplex; Built in 1926
- Exterior features: Lot approximately 0.11 acres
Interior
- Bedrooms: Duplex property with 2 total units
- Heating & cooling: Central Air; Forced Air
- Interior features: Central air conditioning; Forced-air heating
Neighborhood map
What this means for you Summary
Snapshot
- This is a 2 × 3-bed/1.5-bath units multifamily listed at $240k.
Deal economics
- At list price, monthly cash flow is $460 ($6k/yr) — positive. Per door: $230/mo.
- The deal already cash-flows at list — no discount required.
- Meets the 1% rule at list price ($3k rent vs $240k).
- Cap rate 8.6% vs local median 3.8% in Columbus — top-decile yield for the area; either an underpriced asset or a hidden risk that comps aren't pricing in. Stress-test before assuming the spread holds.
Location & tenants
- Location reads 81/100 on livability (#97 in OH, #1,491 nationally) — a professional / high-income tenant draw. Strengths: commute A+, cost of living A+, housing A+; Watch: employment C-, crime F.
- Columbus City School District (urban): math 15% / reading 26% proficiency, ranked #626 of 656 in OH (top 95%) — low school quality limits family demand, transient renter base, plan for 1-2y turnover; 72% free/reduced lunch — lower-income household profile, screen leases tightly.
- Market conditions: Rents rising fast (+4.5%/yr); 187 active listings in the ZIP; 2 comparable units currently listed for rent nearby; 8,139 units permitted in Franklin County in 2024 (5,940 in 5+ unit buildings).
- At $2,538/mo this rent would consume 51% of the median local household income ($59k/yr) (locally 2290% of renters already pay >50% of income on rent) — very limited rent-growth headroom before tenants either downsize or default.
Forward outlook
- Local home prices are declining (-3.0%/yr); year-one equity from $2k of loan paydown is wiped out by about $7k of value loss. Plan a longer hold.
- Franklin County population projected at +34% by 2050 — long-run rental-demand tailwind backs the buy-and-hold thesis.
Negotiation context
- Only 14 days on market — expect competitive offers; lowballing is unlikely to land.
- 3 sale attempts since 3y ago with the ask held roughly flat each time — persistent listings suggest the price (not the market) is what's stuck; bring a comps-based counter.
- Current owner paid $200k; 20% above their basis — modest negotiation headroom, anchor on the comps not their cost.
Risks & watch-outs
- Watch-outs: built in 1926 — expect roof / HVAC / electrical / plumbing capex.
Questions for the listing agent
- Can we see the unit-by-unit rent roll, current vacancy, and any below-market leases? What's the average tenancy length?
- What capital expenditures (roof, boiler, parking lot, exteriors) have been made in the last 5 years, and what's planned in the next 2?
- Built in 1926 — when were the roof, HVAC, electrical panel, plumbing, and water heater last replaced?
- Is there a deadline driving the sale (1031 exchange, divorce, estate, relocation)? That informs how much negotiation room exists.
- Crime grade is F in this area — have there been break-ins, vandalism, or insurance claims at this property in the last 3 years? What carrier currently insures it and at what premium?
- The area grade is low — what's the realistic commute time and amenity access for the typical tenant pool here? Any planned neighborhood developments (good or bad) we should know about?
- What's the average days-on-market for RENTAL listings here right now (not sales)? A rising rental-DOM trend means longer vacancies and softer asking-rent achievability than the comps imply.
- What's the recent tenant-quality profile in this submarket — average credit score on applications, eviction rate, late-payment / NSF rate, and stable-employment percentage? A property-management company in the area should have these aggregated.
- How much new apartment / multifamily construction is in the pipeline within 1–3 miles? Heavy new supply (>2% of stock underway) typically softens rents 12–24 months out; light construction supports rent growth.
Investment metrics
- 1% rule
- 1.06% ✓
- Cap rate
- 8.59%
- Cash-on-cash
- 8.22%
- DSCR
- 1.37
- GRM
- 7.9
CMA / ARV
- ARV (on-the-fly)
- $207,480
- Comps found
- 11
Show comp detail 11 sales within ~0.75 mi
| Address | Dist | Beds/Ba | Sqft | Sold | Price | $/sf | Match |
|---|---|---|---|---|---|---|---|
| 622 S Ogden Ave | 0.08mi | 6/— | 2,100 (-4%) | 4mo | $127,500 | $61 | 87 |
| 661-663 S Burgess Ave | 0.00mi | 6/— | 2,184 (0%) | 20mo | $200,000 | $92 | 83 |
| 557-559 S Terrace Ave | 0.19mi | 6/— | 2,184 (0%) | 12mo | $222,000 | $102 | 82 |
| 612-614 Racine Ave | 0.19mi | 6/— | 2,124 (-3%) | 9mo | $190,000 | $89 | 79 |
| 634 Racine Ave | 0.17mi | 6/— | 2,128 (-3%) | 19mo | $250,000 | $117 | 72 |
| 638 Racine Ave | 0.17mi | 6/— | 2,128 (-3%) | 21mo | $255,000 | $120 | 70 |
| 618 Racine Ave | 0.18mi | 6/2.0 | 2,280 (+4%) | 20mo | $215,000 | $94 | 68 |
| 2197 Amherst Ave | 0.59mi | 6/— | 2,188 (+0%) | 13mo | $242,500 | $111 | 62 |
| 2511 Sullivant Ave | 0.25mi | 6/— | 2,352 (+8%) | 17mo | $224,000 | $95 | 62 |
| 361 S Harris Ave #361 | 0.48mi | 5/— (-1) | 1,890 (-14%) | 1mo | $180,000 | $95 | 49 |
| 780-782 Whitethorne Ave | 0.75mi | 6/2.0 | 1,956 (-10%) | 11mo | $142,000 | $73 | 38 |
Match score weights: distance 35% · size 25% · config 20% · recency 20%. Top-matched comps best support the ARV.
Projected returns pro-forma
-3.0% appreciation · 4.49% rent growth · sell at horizon
- IRR
- -2.2%
- Equity multiple
- 0.91×
- Total profit
- $-5,747
- Equity at exit
- $35,770
- IRR
- 8.9%
- Equity multiple
- 1.73×
- Total profit
- $48,927
- Equity at exit
- $20,742
Cash invested: $67,172 (down + closing). Projections, not guarantees.
Landlord ↔ Tenant lean methodology
- Overall (STATE)
- 73 Landlord-Friendly
- State Ohio
- 73 Landlord-Friendly · R+6
- County
- — inherits STATE
- City
- — inherits STATE
ZIP-level market 43204
- Rents YoY
- 4.5%
- Active inventory
- 187
- Price-to-rent
- 15.8×
Monthly cashflow live
- Estimated rent
- $2,538 high interval (Pro) →
- Mortgage (P&I)
- −$1,258
- Tax from tax record
- −$187 /mo · $2,244/yr
- Insurance
- −$100
- HOA
- −$0
- Vacancy / Maint / Mgmt
- −$533
- Net cashflow
- $460
Break-even live
2-unit breakdown (identical units grouped — click to expand)
| Units | Beds | Baths | Est. rent |
|---|---|---|---|
| 2× units | 3 | 1.5 | $2,538 |
| #1 | 3 | 1.5 | $1,269 |
| #2 | 3 | 1.5 | $1,269 |
| Total (2 units) | $2,538 | ||
UW: 25.0% down · 7.5% · 30yr · 1.5% tax · 5.0% vac · 8.0% maint · 8.0% mgmt
Financing live
Cash to close
- Down payment
- $59,975
- Closing costs
- $7,197
- Reserves months
- —
- Total cash needed
- —
Loan-product check · same deal, 3 products live
Conventional
25% down · 7.5% · 30yr
- Down + closing
- —
- Monthly P&I
- —
- Monthly cashflow
- —
- DSCR
- —
- Eligible?
- —
Personal DTI + credit; lowest rate.
DSCR
20% down · 8.5% · 30yr
- Down + closing
- —
- Monthly P&I
- —
- Monthly cashflow
- —
- DSCR
- —
- Eligible?
- —
No personal income docs; deal must DSCR.
Hard money
10% down · 12.0% · 12mo
- Down + closing
- —
- Monthly P&I
- —
- Monthly cashflow
- —
- DSCR
- —
- Eligible?
- —
Short-term bridge; refi at stabilization.
Rent comps 2 comps
| Address | Beds | Baths | Sqft | Rent | $/sqft | DOM | Units | Dist |
|---|---|---|---|---|---|---|---|---|
| 2545 Vanderberg Ave Columbus, OH | 6.0 | 3.0 | 2600 | $5,800 | $2.23 | 14d | 1 | 0.35mi |
| 89 S Richardson Ave Columbus, OH | 6.0 | 2.0 | 2112 | $1,995 | $0.94 | 2d | 1 | 0.85mi |
Listing history 11 events
-
2026-06-18days on market $239,900 Active 14 DOM
-
2026-06-17days on market $239,900 Active 13 DOM
-
2026-06-16days on market $239,900 Active 12 DOM
-
2026-06-15days on market $239,900 Active 11 DOM
-
2026-06-13days on market $239,900 Active 9 DOM
-
2026-06-13days on market $239,900 Active 8 DOM
-
2026-06-09days on market $239,900 Active 5 DOM
-
2026-06-08days on market $239,900 Active 4 DOM
-
2026-06-07days on market $239,900 Active 3 DOM
-
2026-06-05remarks 435-char remark
-
2026-06-05$239,900 Active 1 DOM
ⓘ Source: listings_history table (triggers on properties + properties_extension) + one-shot
backfill from property_details.listing_events for pre-trigger history.
Tax reassessment forecast OH · Partial reset (capped growth)
- Current annual tax
- $2,244 · $187/mo
- Projected year-2 tax
- $2,993 · $249/mo
- Expected delta
- +$749/yr (+$62/mo · 33.4%)
ⓘ Screening estimate from a state-policy table — verify with the county assessor before closing.
Climate risk First Street
- Flood 1/10 Low FEMA zone X (unshaded) · 0% chance over 30 yrs
- Wildfire 1/10 Low
- Heat 4/10 Moderate 7 d/yr ≥102°F today · 18 d/yr by 30 yrs out
- Wind 2/10 Low 100% chance of damaging wind over 30 yrs
- Air quality 2/10 Low 1 unhealthy d/yr today · 2 by 30 yrs out
Nearby sold comps map
Loading sold comps map…
Walkable amenities ~0.75 mi
Loading nearby amenities…
Taxation est. · year 1
- Rental income
- $30,456
- − Mortgage interest
- −$13,438
- − Property taxes
- −$2,244
- − Insurance
- −$1,200
- − Repairs & maintenance
- −$2,436
- − Management
- −$2,436
- − Depreciation
- −$6,979
- Taxable income
- $1,722
- Est. tax owed @ 24.0%
- −$413
- After-tax cash flow
- $5,106/yr
For passive investors: Depreciation is non-cash, so a rental often shows a tax loss while cash-flowing — sheltering income. Rental losses are passive: they offset passive income freely, and up to $25,000/yr can offset ordinary (W-2) income if you actively participate and your MAGI is under $100k (phasing out to $0 by $150k); unused losses carry forward. On sale, claimed depreciation is recaptured at up to 25%, and gains may owe capital-gains tax (a 1031 exchange can defer both). Figures are a year-1 estimate at your 24.0% rate — not tax advice; consult a CPA.
Schools (NCES district)
- District
- Columbus City School District
- NCES district ID
- 3904380
- Math proficiency
- 15% ▼ -17.00%
- Reading proficiency
- 26% ▼ -12.00%
- Median HH income
- $38,483
- Composite
- 17.19/100
- National rank
- #9105
- State rank
- #626 of 656 in OH
Livability — Columbus
- Score
- 81/100
- State rank
- #97
- US rank
- #1491
Category grades
Schools grade is shown separately in the Schools card above.
Census & demographics
- Census place
- Columbus, OH
- County
- Franklin County · 1,351,780 people
- City population
- 612,189
- Metro
- Columbus, OH
- Population (ZIP)
- 42,962
- Household income
- $59,266
- Rent vs Own
- Severe rent burden
- 2290.0
Population outlook (Franklin County) Hauer SSP2
- Today (2025)
- 1,456,139 people
- By 2030
- 1,556,890 · +6.9%
- By 2040
- 1,757,349 · +20.7%
- By 2050
- 1,950,539 · +34.0%
- By 2075
- 2,376,171 · +63.2%
- By 2100
- 2,636,796 · +81.1%
Race, ethnicity, and origin ACS 2023
- Neighborhood character
- Diverse neighborhood (Simpson 0.58)
- Race & ethnicity
- White 61% Hispanic / Latino 16% Black 13% Two or more races 12% Asian 3%
- Hispanic origin (detail)
- Mexican 9%
- Common ancestry
- Lithuanian 1% Slovak 1% Romanian 1%
- Foreign-born
- 13% · Canada
- Languages at home
- 81% English-only · Spanish 13% Arabic 2% Other Asian/Pacific 1%
Political lean MEDSL · Franklin
- 2024 margin
- Strong D (+28.4) · D 63.7% · R 35.3% · Other 1.0%
- 2008→2024 swing
- +7.7pp toward D · 2008: 20.7pp · 2024: 28.4pp
- All cycles
- 2024: D+28.4 2020: D+31.4 2016: D+25.9 2012: D+21.7 2008: D+20.7
Not yet ingested
- Civics
- —
Market trends
- HPI YoY
- ▼ -220.67%
- Current HPI
- 265.7711
- Rent YoY
- ▲ 4.49%
- Metro
- Columbus, OH
- State GDP YoY
- ▲ 1.98%
- F500 in state
- 48
Industry mix (Fortune 500 HQ in OH)
| Industry | F500 HQs | Revenue |
|---|---|---|
| Insurance | 3 | $145B |
|
||
| Industrial Machinery | 3 | $49B |
|
||
| Financial Services | 3 | $24B |
|
||
| Consumer Goods | 2 | $93B |
|
||
| Aerospace / Defense | 2 | $47B |
|
||
| Utilities | 2 | $33B |
|
||
Price history
+442.5% since first listed12 events — show timeline
- 2026-06-04 Listed $239,900 CBRMLS
- 2025-09-18 Rental Removed $900 RENTLY
- 2025-08-27 Listed for Rent $900 RENTLY
- 2024-10-22 Sold (Public Records) $200,000 Public Records
- 2024-05-06 Listing Removed — CBRMLS
- 2024-01-19 Price Changed $265,000 CBRMLS
- 2023-12-30 Price Changed $245,000 CBRMLS
- 2023-12-15 Listed $265,000 CBRMLS
- 2007-01-17 Sold (Public Records) $65,500 Public Records
- 1989-09-05 Sold (Public Records) $48,000 Public Records
- 1988-08-30 Sold (Public Records) $32,000 Public Records
- 1987-07-01 Sold (Public Records) $44,219 Public Records
Property tax history
+6.2%/yrLatest (2024): $2,244 · +1.3% YoY. Source: county tax records.
Cash-flow waterfall
monthlySold comps — $/sqft
last 12 mo · ≤1 miLoading sold comps…