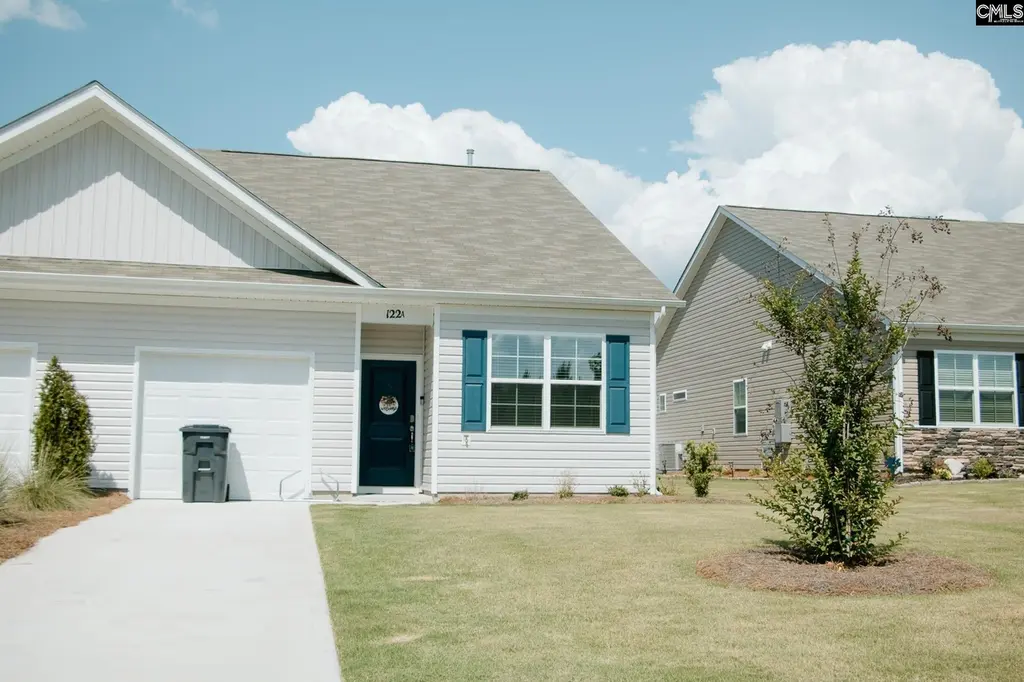
122 A Willow Creek Blvd · Lugoff, SC
Flood risk No data
- FEMA flood zone
- —
- Chance of flooding over 30 yrs
- —
- Est. flood insurance / yr
- —
Fire risk No data
- Est. fire insurance / yr
- —
Heat risk No data
- Hot days now (above threshold)
- —
- Hot days in 30 yrs
- —
Wind risk No data
- Chance of severe wind over 30 yrs
- —
Air-quality risk No data
- Unhealthy air days now
- —
- Unhealthy air days in 30 yrs
- —
Risk factors via First Street. Map © Google.
Why this score? — see what drove the D grade
The composite is a weighted blend of 9 inputs, each scored 0–100. Each bar is that input's sub-score; the figure is the points it added to the 100-point composite (weight × sub-score).
- Cash flow +13.7/30.0
- ARV discount +7.5/15.0
- DSCR +4.1/10.0
- Schools +3.8/10.0
- 1% rule +3.6/10.0
- Livability +3.6/5.0
- Rent growth +2.5/5.0
- Condition / age +2.5/5.0
- Appreciation +0.0/10.0
$225,500
🖨 Deal sheet (PDF) 📄 Offer letter ✓ Due diligence
Listing remarks
* * Hot Listing Alert - Newer Construction with builder warranties in place * * Welcome home to 122A Willow Creek Blvd in the peaceful Willow Creek Commons community! This newer construction single-story townhome features a fully fenced-in backyard for ample privacy. The Conway floorplan is perfect for those searching for a one-level townhome. It is masterfully designed with an open concept kitchen, dining, and family area. The kitchen comes equipped with stunning granite countertops and gray cabinetry. The primary bedroom suite is tucked away at the back of the home with a walk-in closet and a private bathroom. The remaining two bedrooms and bathroom can be found towards the front of th
Key facts
- Open concept kitchen
- Walk-in closet
- Newer construction
Tags
Property features AI
Finance
- Other: Lot size approximately 0.13 acres; Lot number 0034
- HOA & community: Property is part of an association
Exterior
- Parking: Attached garage (1 car); Two parking spaces total
- Utilities: Public sewer; Public water
- Home design: Single-story home
- Construction: Slab foundation
- Exterior features: Vinyl exterior finish; Paved road access; Public water
Interior
- Kitchen: Granite countertops
- Bedrooms: Master bedroom on main level; Second bedroom on main level; Third bedroom on main level
- Bathrooms: Two full bathrooms
- Heating & cooling: Central heating; Central cooling
- Interior features: Family room on main level; Granite countertops in kitchen; Laundry closet in heated space on main level
- Laundry & utility: Washer/dryer area on main level; Laundry located in a closet within heated space
Neighborhood map
What this means for you Summary
Snapshot
- This is a 3-bed/2.0-bath townhouse listed at $226k.
Deal economics
- At list price, monthly cash flow is $16 ($190/yr) — positive.
- The deal already cash-flows at list — no discount required.
- To meet the 1% rule (rent ≥ 1% of price), the offer needs to be $193k (14.2% below list).
- Recommended offer: $193k (14.2% below list) — sets the bar for 1% rule.
Location & tenants
- Location reads 71/100 on livability (#47 in SC) — a middle-class / working-renter tenant base. Strengths: cost of living A+, housing A+, health & safety A+; Watch: amenities F, commute F.
- Kershaw 01 (rural): math 38% / reading 51% proficiency, ranked #25 of 80 in SC (top 31%) — families likely to look elsewhere, expect single-tenant / working-renter base with shorter leases.
- Zoned schools: Lugoff Elementary (math 44% / reading 51%, grade D, #199 of 597 statewide, top 35%, 526 students, 100% FRL); Lugoff-Elgin Middle (math 31% / reading 44%, grade F, #90 of 229 statewide, top 42%, 668 students, 68% FRL); Lugoff-Elgin High (math 65% / reading 89%, grade A-, #28 of 196 statewide, top 16%, 1,744 students, 62% FRL) — zoned schools average 77% FRL vs 49% district-wide (28 pts higher); higher-poverty schools than district average — tighter screening recommended.
- Market conditions: 181 active listings in the ZIP; 8 comparable units currently listed for rent nearby; rentals leasing fast (median 5d on market — plan ~1-2 weeks tenant-placement turnaround); 491 units permitted in Kershaw County in 2024 (0 in 5+ unit buildings).
- This rent runs 34% of the median local income ($68k/yr) — at the standard rent-burdened threshold; future hikes will face affordability resistance.
Forward outlook
- Local home prices are declining (-3.0%/yr); year-one equity from $2k of loan paydown is wiped out by about $7k of value loss. Plan a longer hold.
- Kershaw County population projected at +8% by 2050 — modest demand growth; plan on rents tracking national, not racing it.
Negotiation context
- Only 7 days on market — expect competitive offers; lowballing is unlikely to land.
- 3 sale attempts with the ask held roughly flat each time — persistent listings suggest the price (not the market) is what's stuck; bring a comps-based counter.
Questions for the listing agent
- What does the HOA fee cover, when was the last increase, and are there any pending special assessments or reserve-fund shortfalls?
- Is there a deadline driving the sale (1031 exchange, divorce, estate, relocation)? That informs how much negotiation room exists.
- The area grade is low — what's the realistic commute time and amenity access for the typical tenant pool here? Any planned neighborhood developments (good or bad) we should know about?
- What's the average days-on-market for RENTAL listings here right now (not sales)? A rising rental-DOM trend means longer vacancies and softer asking-rent achievability than the comps imply.
- What's the recent tenant-quality profile in this submarket — average credit score on applications, eviction rate, late-payment / NSF rate, and stable-employment percentage? A property-management company in the area should have these aggregated.
- How much new for-sale + rental construction is in the pipeline within 1–3 miles? Heavy new supply typically softens prices + rents 12–24 months out; constrained supply supports both.
Investment metrics
- 1% rule
- 0.86% ✗
- Cap rate
- 6.38%
- Cash-on-cash
- 0.30%
- DSCR
- 1.01
- GRM
- 9.7
CMA / ARV
No comps found within radius.
Projected returns pro-forma
-3.0% appreciation · 3.0% rent growth · sell at horizon
- IRR
- -15.8%
- Equity multiple
- 0.44×
- Total profit
- $-35,533
- Equity at exit
- $33,623
- IRR
- -7.4%
- Equity multiple
- 0.53×
- Total profit
- $-29,642
- Equity at exit
- $19,497
Cash invested: $63,140 (down + closing). Projections, not guarantees.
Landlord ↔ Tenant lean methodology
- Overall (STATE)
- 90 Strongly Landlord-Friendly
- State South Carolina
- 90 Strongly Landlord-Friendly · R+6
- County
- — inherits STATE
- City
- — inherits STATE
ZIP-level market 29078
- Home prices YoY
- -22.9%
- Active inventory
- 181
- Price-to-rent
- 9.7×
Monthly cashflow live
- Estimated rent
- $1,935 high interval (Pro) →
- Mortgage (P&I)
- −$1,183
- Tax from tax record
- −$135 /mo · $1,622/yr
- Insurance
- −$94
- HOA
- −$101
- Vacancy / Maint / Mgmt
- −$406
- Net cashflow
- $16
Break-even live
Sensitivity live
| Price | -10% $143 | -5% $80 | +0% $16 | +5% $-48 | +10% $-112 |
|---|---|---|---|---|---|
| Rent | -10% $-137 | -5% $-61 | +0% $16 | +5% $92 | +10% $169 |
| Rate | -1.0pp $129 | -0.5pp $73 | base $16 | +0.5pp $-43 | +1.0pp $-102 |
UW: 25.0% down · 7.5% · 30yr · 1.5% tax · 5.0% vac · 8.0% maint · 8.0% mgmt
Financing live
Cash to close
- Down payment
- $56,375
- Closing costs
- $6,765
- Reserves months
- —
- Total cash needed
- —
Loan-product check · same deal, 3 products live
Conventional
25% down · 7.5% · 30yr
- Down + closing
- —
- Monthly P&I
- —
- Monthly cashflow
- —
- DSCR
- —
- Eligible?
- —
Personal DTI + credit; lowest rate.
DSCR
20% down · 8.5% · 30yr
- Down + closing
- —
- Monthly P&I
- —
- Monthly cashflow
- —
- DSCR
- —
- Eligible?
- —
No personal income docs; deal must DSCR.
Hard money
10% down · 12.0% · 12mo
- Down + closing
- —
- Monthly P&I
- —
- Monthly cashflow
- —
- DSCR
- —
- Eligible?
- —
Short-term bridge; refi at stabilization.
Rent comps 8 comps
| Address | Beds | Baths | Sqft | Rent | $/sqft | DOM | Units | Dist |
|---|---|---|---|---|---|---|---|---|
| 186 State Rd S-28-743 Lugoff, SC | 2.0–3.0 | 2.0 | 1025 | $1,199 | $1.17 | 4d | 6 | 0.19mi |
| 300 Pine Point Rd Unit D Lugoff, SC | 3.0 | 2.5 | 1470 | $1,750 | $1.19 | 5d | 1 | 0.21mi |
| 1302 Champions Rest Rd Unit C Lugoff, SC | 3.0 | 2.5 | 1383 | $2,000 | $1.45 | 5d | 1 | 0.22mi |
| 1302 Champions Rest Rd Unit B Lugoff, SC | 3.0 | 2.5 | 1383 | $1,900 | $1.37 | 5d | 1 | 0.23mi |
| 1292 Champions Rest Rd Unit A Lugoff, SC | 3.0 | 2.5 | 1383 | $2,100 | $1.52 | 25d | 1 | 0.25mi |
| 260 Pine Point Rd Unit C Lugoff, SC | 3.0 | 2.5 | 1335 | $1,900 | $1.42 | 13d | 1 | 0.25mi |
| 139 Triumph Ave Unit C Lugoff, SC | 3.0 | 2.5 | 1485 | $1,899 | $1.28 | 16d | 1 | 0.35mi |
| 40 State Rd S-28-910 Lugoff, SC | 1.0–3.0 | 1.0–2.0 | 930 | $1,249 | $1.34 | 4d | 3 | 0.46mi |
HOA detail
- Monthly dues
- $101 · $1,212/yr
Listing history 6 events
-
2026-06-22days on market $225,500 Active 7 DOM
-
2026-06-18days on market $225,500 Active 4 DOM
-
2026-06-17days on market $225,500 Active 3 DOM
-
2026-06-16days on market $225,500 Active 2 DOM
-
2026-06-15remarks 699-char remark
-
2026-06-15$225,500 Active 1 DOM
ⓘ Source: listings_history table (triggers on properties + properties_extension) + one-shot
backfill from property_details.listing_events for pre-trigger history.
Tax reassessment forecast SC · Resets to sale price
- Current annual tax
- $1,622 · $135/mo
- Projected year-2 tax
- $1,622 · $135/mo
- Expected delta
- $0/yr ($0/mo · 0.0%)
ⓘ Screening estimate from a state-policy table — verify with the county assessor before closing.
Nearby sold comps map
Loading sold comps map…
Walkable amenities ~0.75 mi
Loading nearby amenities…
Taxation est. · year 1
- Rental income
- $23,217
- − Mortgage interest
- −$12,632
- − Property taxes
- −$1,622
- − Insurance
- −$1,128
- − Repairs & maintenance
- −$1,857
- − Management
- −$1,857
- − HOA
- −$1,212
- − Depreciation
- −$6,560
- Taxable loss
- −$3,651
- Est. tax savings @ 24.0%
- +$876
- After-tax cash flow
- $1,066/yr
For passive investors: Depreciation is non-cash, so a rental often shows a tax loss while cash-flowing — sheltering income. Rental losses are passive: they offset passive income freely, and up to $25,000/yr can offset ordinary (W-2) income if you actively participate and your MAGI is under $100k (phasing out to $0 by $150k); unused losses carry forward. On sale, claimed depreciation is recaptured at up to 25%, and gains may owe capital-gains tax (a 1031 exchange can defer both). Figures are a year-1 estimate at your 24.0% rate — not tax advice; consult a CPA.
Schools (NCES district)
- District
- Kershaw 01
- NCES district ID
- 4502550
- Math proficiency
- 38% ▼ -7.00%
- Reading proficiency
- 51% ▲ 6.00%
- Median HH income
- $44,585
- Composite
- 37.66/100
- National rank
- #4371
- State rank
- #25 of 80 in SC
Livability — Lugoff
- Score
- 71/100
- State rank
- #47
- US rank
- #6636
Category grades
Schools grade is shown separately in the Schools card above.
Census & demographics
- Census place
- Lugoff, SC
- County
- Kershaw County · 47,655 people
- City population
- 16,283
- Metro
- Columbia, SC
- Population (ZIP)
- 16,283
- Household income
- $67,727
- Rent vs Own
- Severe rent burden
- 61.0
Population outlook (Kershaw County) Hauer SSP2
- Today (2025)
- 67,683 people
- By 2030
- 69,374 · +2.5%
- By 2040
- 71,936 · +6.3%
- By 2050
- 73,292 · +8.3%
- By 2075
- 75,762 · +11.9%
- By 2100
- 72,620 · +7.3%
Race, ethnicity, and origin ACS 2023
- Neighborhood character
- Predominantly White (74%)
- Race & ethnicity
- White 74% Black 18% Hispanic / Latino 6% Two or more races 4%
- Hispanic origin (detail)
- Puerto Rican 3%
- Common ancestry
- Italian 2% Lithuanian 2% Slovak 1%
- Foreign-born
- 2% · Canada
- Languages at home
- 93% English-only · Spanish 6%
Political lean MEDSL · Kershaw
- 2024 margin
- Strong R (+28.2) · D 35.3% · R 63.5% · Other 1.2%
- 2008→2024 swing
- -9.5pp toward R · 2008: -18.7pp · 2024: -28.2pp
- All cycles
- 2024: R+28.2 2020: R+23.1 2016: R+24.8 2012: R+18.6 2008: R+18.7
Not yet ingested
- Civics
- —
Market trends
- HPI YoY
- ▼ -62.83%
- Current HPI
- 211.3661
- Rent YoY
- —
- Metro
- Columbia, SC
- State GDP YoY
- ▲ 4.51%
- F500 in state
- 2
Industry mix (Fortune 500 HQ in SC)
| Industry | F500 HQs | Revenue |
|---|---|---|
| Packaging | 1 | $7B |
|
||
Price history
+4.9% since first listed5 events — show timeline
- 2026-06-14 Listed $225,500 Consolidated MLS
- 2025-07-03 Pending — Consolidated MLS
- 2025-07-01 Listed $213,000 Consolidated MLS
- 2025-06-09 Pending — Consolidated MLS
- 2025-05-19 Listed $215,000 Consolidated MLS
Cash-flow waterfall
monthlySold comps — $/sqft
last 12 mo · ≤1 miLoading sold comps…