 Duplex
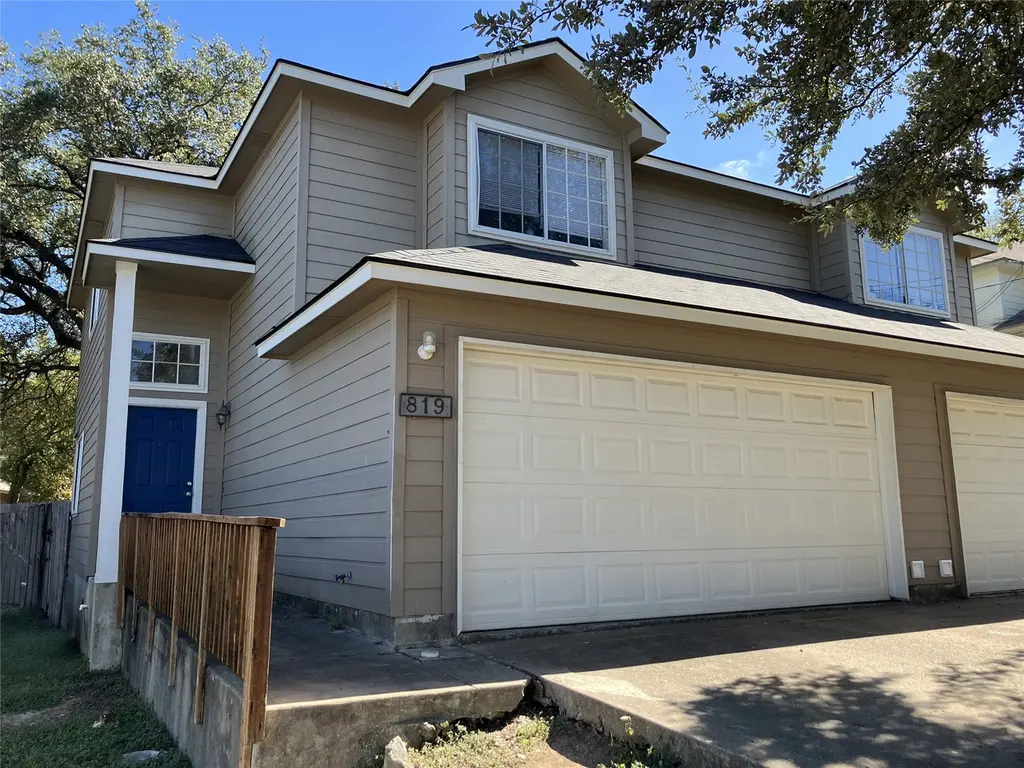
819/821 Sagewood Trl · San Marcos, TX
Flood risk 4/10 · Minor
- FEMA flood zone
- X (unshaded)
- Chance of flooding over 30 yrs
- 0.22%
- Est. flood insurance / yr
- $507 – $1,088
Fire risk 4/10 · Minor
- Est. fire insurance / yr
- $1,222 – $2,270
Heat risk 8/10 · Major
- Hot days now (above 108°F)
- 7 days/yr
- Hot days in 30 yrs
- 21 days/yr
Wind risk 8/10 · Major
- Chance of severe wind over 30 yrs
- 80.0%
Air-quality risk 2/10 · Minimal
- Unhealthy air days now
- 0 days/yr
- Unhealthy air days in 30 yrs
- 1 days/yr
Risk factors via First Street. Map © Google.
Why this score? — see what drove the D grade
The composite is a weighted blend of 9 inputs, each scored 0–100. Each bar is that input's sub-score; the figure is the points it added to the 100-point composite (weight × sub-score).
- Cash flow +12.1/30.0
- ARV discount +11.5/15.0
- Livability +4.0/5.0
- DSCR +3.6/10.0
- 1% rule +3.5/10.0
- Rent growth +3.0/5.0
- Condition / age +2.2/5.0
- Schools +2.0/10.0
- Appreciation +0.0/10.0
$399,000
🖨 Deal sheet (PDF) 📄 Offer letter ✓ Due diligence
Multi-family units
County records classify this as Multi-Family (2-4 Unit). Listing-text estimate: 2 units. confirmed
Listing remarks MLS
Investment Opportunity: 3 Bedrooms 3.5 Bath 2 Car Garage Duplex Near Texas State - Great for Students! This Duplex is nestled in a prime location in San Marcos, Texas, just 1.2 miles from away from Texas State University, and on the bus route. When roommates wants their own space and not share, this Duplex offers each tenant their own bathroom and closet on the 2nd floor. Downstairs they enjoy an open floor plan with full sized washer and dryer in each unit, dishwasher, half bathroom, and private fenced in yards. This established neighborhood offers convenience and community. Currently occupied on both sides. One unit brings in $1500 while the other unit brings in $1700 till July of 2027. New Roof in 2021. Come check this investment opportunity out.
Key facts
- 6,412 sq ft lot
- 4 garage spots
- Built 1998
Neighborhood map
What this means for you Summary
Snapshot
- This is a 2 × 3.0-bed/3.5-bath units multifamily listed at $399k. Condition is rated fair.
Deal economics
- At list price, monthly cash flow is $-90 ($-1k/yr) — negative. Per door: $-45/mo.
- To cash-flow at today's rent, offer at most $386k (3.3% below list).
- To meet the 1% rule (rent ≥ 1% of price), the offer needs to be $338k (15.4% below list).
- Recommended offer: $338k (15.4% below list) — sets the bar for 1% rule.
- Cap rate 6.0% vs local median 3.2% in San Marcos — top-decile yield for the area; either an underpriced asset or a hidden risk that comps aren't pricing in. Stress-test before assuming the spread holds.
Location & tenants
- Location reads 81/100 on livability (#30 in TX, #1,601 nationally) — a professional / high-income tenant draw. Strengths: amenities A+, cost of living A+, health & safety A+; Watch: crime D+, employment F.
- San Marcos CISD (rural): math 18% / reading 31% proficiency, ranked #731 of 826 in TX (top 88%) — low school quality limits family demand, transient renter base, plan for 1-2y turnover; 63% free/reduced lunch — lower-income household profile, screen leases tightly.
- Zoned schools: Crockett El (math 27% / reading 43%, grade F, #1,965 of 4,322 statewide, top 46%, 525 students, 68% FRL); Miller Middle (math 21% / reading 36%, grade F, #1,122 of 1,662 statewide, top 69%, 986 students, 74% FRL); San Marcos H S (math 26% / reading 31%, grade F, #1,157 of 1,632 statewide, top 72%, 2,536 students, 76% FRL).
- Market conditions: Rents rising (+2.0%/yr); 1146 active listings in the ZIP; 1 comparable units currently listed for rent nearby; 5,270 units permitted in Hays County in 2024 (1,464 in 5+ unit buildings).
- At $3,376/mo this rent would consume 74% of the median local household income ($55k/yr) (locally 6504% of renters already pay >50% of income on rent) — very limited rent-growth headroom before tenants either downsize or default.
Forward outlook
- Local home prices are declining (-3.0%/yr); year-one equity from $3k of loan paydown is wiped out by about $12k of value loss. Plan a longer hold.
- Hays County population projected at +93% by 2050 — long-run rental-demand tailwind backs the buy-and-hold thesis.
Negotiation context
- It's been on market 56 days — a 3% lower offer ($387k) is reasonable based on typical stale-listing flexibility.
- 4 sale attempts since 28y ago with the ask held roughly flat each time — persistent listings suggest the price (not the market) is what's stuck; bring a comps-based counter.
Risks & watch-outs
- Climate carrying-cost: severe wind risk, 80% chance of damaging wind over 30y; extreme-heat days projected 7→21/yr by 2055 (HVAC capex compounding) — expect insurance premiums to compound above CPI over the hold.
Questions for the listing agent
- What do current leases actually rent for vs. the listed asking? Can we see a recent rent roll and the last 12 months of T-12 income?
- It's been on market 56 days. Have you received any prior offers? Is the seller open to a 15% concession, seller financing, or rate buy-down credit?
- Can we see the unit-by-unit rent roll, current vacancy, and any below-market leases? What's the average tenancy length?
- What capital expenditures (roof, boiler, parking lot, exteriors) have been made in the last 5 years, and what's planned in the next 2?
- Have any recent inspections been done? Can we get a copy of the seller's disclosures and any deferred-maintenance estimates?
- Is there a deadline driving the sale (1031 exchange, divorce, estate, relocation)? That informs how much negotiation room exists.
- Schools are F-rated, which usually means shorter tenancies and higher turnover. Who's the typical renter profile here, and what's been the actual vacancy rate?
- Crime grade is D in this area — have there been break-ins, vandalism, or insurance claims at this property in the last 3 years? What carrier currently insures it and at what premium?
- The area grade is low — what's the realistic commute time and amenity access for the typical tenant pool here? Any planned neighborhood developments (good or bad) we should know about?
- What's the average days-on-market for RENTAL listings here right now (not sales)? A rising rental-DOM trend means longer vacancies and softer asking-rent achievability than the comps imply.
- What's the recent tenant-quality profile in this submarket — average credit score on applications, eviction rate, late-payment / NSF rate, and stable-employment percentage? A property-management company in the area should have these aggregated.
- How much new apartment / multifamily construction is in the pipeline within 1–3 miles? Heavy new supply (>2% of stock underway) typically softens rents 12–24 months out; light construction supports rent growth.
Investment metrics
- 1% rule
- 0.85% ✗
- Cap rate
- 6.02%
- Cash-on-cash
- -0.97%
- DSCR
- 0.96
- GRM
- 9.8
CMA / ARV
- ARV (median comp)
- $437,628
- List price
- $399,000
- Delta
- -8.83%
- Verdict
- FAIR
- Comps
- 15 within 1.0 mi
Show comp detail 4 sales within ~0.75 mi
| Address | Dist | Beds/Ba | Sqft | Sold | Price | $/sf | Match |
|---|---|---|---|---|---|---|---|
| 819/821 Sagewood Trl | 0.00mi | 6/7.0 | 2,522 (0%) | 0mo | $399,000 | $158 | 100 |
| 903/905 Sagewood Trl | 0.15mi | 6/7.0 | 2,768 (+10%) | 2mo | $444,999 | $161 | 75 |
| 897-899 Sagewood Trl | 0.14mi | 6/7.0 | 2,710 (+8%) | 9mo | $440,000 | $162 | 74 |
| 114-116 Hughson Ct | 0.29mi | 5/3.5 (-1) | 2,578 (+2%) | 19mo | $400,000 | $155 | 48 |
Match score weights: distance 35% · size 25% · config 20% · recency 20%. Top-matched comps best support the ARV.
Projected returns pro-forma
-3.0% appreciation · 1.98% rent growth · sell at horizon
- IRR
- -19.0%
- Equity multiple
- 0.34×
- Total profit
- $-73,789
- Equity at exit
- $59,492
- IRR
- -13.8%
- Equity multiple
- 0.24×
- Total profit
- $-85,247
- Equity at exit
- $34,498
Cash invested: $111,720 (down + closing). Projections, not guarantees.
Landlord ↔ Tenant lean methodology
- Overall (STATE)
- 87 Strongly Landlord-Friendly
- State Texas
- 87 Strongly Landlord-Friendly · R+5
- County
- — inherits STATE
- City
- — inherits STATE
ZIP-level market 78666
- Rents YoY
- 2.0%
- Active inventory
- 1146
- Price-to-rent
- 19.7×
Monthly cashflow live
- Estimated rent
- $3,376 high interval (Pro) →
- Mortgage (P&I)
- −$2,092
- Tax est. 1.5%
- −$499 /mo · $5,985/yr
- Insurance
- −$166
- HOA
- −$0
- Vacancy / Maint / Mgmt
- −$709
- Net cashflow
- $-90
Break-even live
Sensitivity live
| Price | -10% $185 | -5% $48 | +0% $-90 | +5% $-228 | +10% $-366 |
|---|---|---|---|---|---|
| Rent | -10% $-357 | -5% $-224 | +0% $-90 | +5% $43 | +10% $176 |
| Rate | -1.0pp $111 | -0.5pp $11 | base $-90 | +0.5pp $-194 | +1.0pp $-299 |
2-unit breakdown (identical units grouped — click to expand)
| Units | Beds | Baths | Est. rent |
|---|---|---|---|
| 2× units | 3.0 | 3.5 | $3,376 |
| #1 | 3.0 | 3.5 | $1,688 |
| #2 | 3.0 | 3.5 | $1,688 |
| Total (2 units) | $3,376 | ||
UW: 25.0% down · 7.5% · 30yr · 1.5% tax · 5.0% vac · 8.0% maint · 8.0% mgmt
Financing live
Cash to close
- Down payment
- $99,750
- Closing costs
- $11,970
- Reserves months
- —
- Total cash needed
- —
Loan-product check · same deal, 3 products live
Conventional
25% down · 7.5% · 30yr
- Down + closing
- —
- Monthly P&I
- —
- Monthly cashflow
- —
- DSCR
- —
- Eligible?
- —
Personal DTI + credit; lowest rate.
DSCR
20% down · 8.5% · 30yr
- Down + closing
- —
- Monthly P&I
- —
- Monthly cashflow
- —
- DSCR
- —
- Eligible?
- —
No personal income docs; deal must DSCR.
Hard money
10% down · 12.0% · 12mo
- Down + closing
- —
- Monthly P&I
- —
- Monthly cashflow
- —
- DSCR
- —
- Eligible?
- —
Short-term bridge; refi at stabilization.
Rent comps 1 comps
| Address | Beds | Baths | Sqft | Rent | $/sqft | DOM | Units | Dist |
|---|---|---|---|---|---|---|---|---|
| 1350 N LBJ Dr San Marcos, TX | 1.0–5.0 | 1.0–5.5 | 1243 | $1,442 | $1.16 | 25d | 28 | 0.59mi |
Listing history 14 events
-
2026-06-05status $399,000 Pending 56 DOM
-
2026-06-03days on market $399,000 Active 56 DOM
-
2026-06-02days on market $399,000 Active 55 DOM
-
2026-06-01days on market $399,000 Active 54 DOM
-
2026-05-31days on market $399,000 Active 53 DOM
-
2026-04-08$399,000 Active 759-char remark
Show marketing remark (759 chars)
Investment Opportunity: 3 Bedrooms 3.5 Bath 2 Car Garage Duplex Near Texas State - Great for Students! This Duplex is nestled in a prime location in San Marcos, Texas, just 1.2 miles from away from Texas State University, and on the bus route. When roommates wants their own space and not share, this Duplex offers each tenant their own bathroom and closet on the 2nd floor. Downstairs they enjoy an open floor plan with full sized washer and dryer in each unit, dishwasher, half bathroom, and private fenced in yards. This established neighborhood offers convenience and community. Currently occupied on both sides. One unit brings in $1500 while the other unit brings in $1700 till July of 2027. New Roof in 2021. Come check this investment opportunity out.
-
2007-10-04historical 179-char remark
Show marketing remark (179 chars)
100% OCCUPIED DUPLEX NEAR TEXAS STATE UNIVERSITY. CERAMIC TILE FLOORS DOWNSTAIRS AND AND FENCED BACKYARD. GREAT RENTAL HISTORY NEW LEASES TILL SUMMER OF 2008.Restrictions: Unknown
-
2007-10-04soldstatus 179-char remark
Show marketing remark (179 chars)
100% OCCUPIED DUPLEX NEAR TEXAS STATE UNIVERSITY. CERAMIC TILE FLOORS DOWNSTAIRS AND AND FENCED BACKYARD. GREAT RENTAL HISTORY NEW LEASES TILL SUMMER OF 2008.Restrictions: Unknown
-
2007-08-17$249,000 179-char remark
Show marketing remark (179 chars)
100% OCCUPIED DUPLEX NEAR TEXAS STATE UNIVERSITY. CERAMIC TILE FLOORS DOWNSTAIRS AND AND FENCED BACKYARD. GREAT RENTAL HISTORY NEW LEASES TILL SUMMER OF 2008.Restrictions: Unknown
-
2004-11-19soldstatus
-
2004-10-08historical
-
2004-06-29$185,900
-
1999-08-18historical
-
1998-06-01
ⓘ Source: listings_history table (triggers on properties + properties_extension) + one-shot
backfill from property_details.listing_events for pre-trigger history.
Climate risk First Street
- Flood 4/10 Moderate FEMA zone X (unshaded) · 22% chance over 30 yrs
- Wildfire 4/10 Moderate
- Heat 8/10 Severe 7 d/yr ≥108°F today · 21 d/yr by 30 yrs out
- Wind 8/10 Severe 80% chance of damaging wind over 30 yrs
- Air quality 2/10 Low 0 unhealthy d/yr today · 1 by 30 yrs out
Nearby sold comps map
Loading sold comps map…
Walkable amenities ~0.75 mi
Loading nearby amenities…
Taxation est. · year 1
- Rental income
- $40,512
- − Mortgage interest
- −$22,350
- − Property taxes
- −$5,985
- − Insurance
- −$1,995
- − Repairs & maintenance
- −$3,241
- − Management
- −$3,241
- − Depreciation
- −$11,607
- Taxable loss
- −$7,907
- Est. tax savings @ 24.0%
- +$1,898
- After-tax cash flow
- $813/yr
For passive investors: Depreciation is non-cash, so a rental often shows a tax loss while cash-flowing — sheltering income. Rental losses are passive: they offset passive income freely, and up to $25,000/yr can offset ordinary (W-2) income if you actively participate and your MAGI is under $100k (phasing out to $0 by $150k); unused losses carry forward. On sale, claimed depreciation is recaptured at up to 25%, and gains may owe capital-gains tax (a 1031 exchange can defer both). Figures are a year-1 estimate at your 24.0% rate — not tax advice; consult a CPA.
Condition & rehab AI · 12 photos
This multi-family property requires moderate renovations to update the kitchens and bathrooms, which will significantly increase its resale and rental value.
Repairs flagged
- Moderate kitchen cabinets — dated and in need of replacement
- Moderate bathroom fixtures — outdated and in need of replacement
- Minor exterior siding — moderate wear, could benefit from touch-up paint
Value-add opportunities
- Both update kitchen cabinets and appliances — modernizing the kitchen will appeal to both buyers and renters
- Both update bathroom fixtures and cabinetry — modernizing the bathrooms will appeal to both buyers and renters
- Both paint interior walls — fresh paint will improve the overall appearance and appeal
Renovation cost estimate screening
| Repair item | Severity | Est. cost |
|---|---|---|
| kitchen cabinets · dated and in need of replacement | Moderate | $3,000–15,000 |
| bathroom fixtures · outdated and in need of replacement | Moderate | $3,000–15,000 |
| exterior siding · moderate wear, could benefit from touch-up paint | Minor | $500–3,000 |
| Total estimated repair cost · 3 items | $6,500–33,000 |
Value-add ROI direction
- Both update kitchen cabinets and appliances — modernizing the kitchen will appeal to both buyers and renters ↑
- Both update bathroom fixtures and cabinetry — modernizing the bathrooms will appeal to both buyers and renters ↑
- Both paint interior walls — fresh paint will improve the overall appearance and appeal ↑
ⓘ Cost ranges are severity-bucket heuristics (US national rule-of-thumb). Get contractor quotes + a written scope before underwriting a rehab budget.
Schools (NCES district)
- District
- San Marcos CISD
- NCES district ID
- 4838970
- Math proficiency
- 18% ▼ -16.00%
- Reading proficiency
- 31% ▼ -8.00%
- Median HH income
- $34,538
- Composite
- 20.11/100
- National rank
- #8644
- State rank
- #731 of 826 in TX
Livability — San Marcos
- Score
- 81/100
- State rank
- #30
- US rank
- #1601
Category grades
Schools grade is shown separately in the Schools card above.
Census & demographics
- Census place
- San Marcos, TX
- County
- Hays County · 280,138 people
- City population
- 88,583
- Metro
- Austin-Round Rock-Georgetown, TX
- Population (ZIP)
- 88,583
- Household income
- $54,737
- Rent vs Own
- Severe rent burden
- 6504.0
Population outlook (Hays County) Hauer SSP2
- Today (2025)
- 286,948 people
- By 2030
- 336,923 · +17.4%
- By 2040
- 441,894 · +54.0%
- By 2050
- 553,462 · +92.9%
- By 2075
- 838,261 · +192.1%
- By 2100
- 1,063,658 · +270.7%
Race, ethnicity, and origin ACS 2023
- Neighborhood character
- Diverse neighborhood (Simpson 0.60)
- Race & ethnicity
- White 45% Hispanic / Latino 44% Two or more races 20% Black 5% Asian 2%
- Hispanic origin (detail)
- Mexican 37%
- Common ancestry
- Slovak 2% Lithuanian 2% Italian 1%
- Foreign-born
- 8% · Canada
- Languages at home
- 73% English-only · Spanish 24% Other Indo-European 1%
Political lean MEDSL · Hays
- 2024 margin
- Lean D (+5.7) · D 52.1% · R 46.5% · Other 1.4%
- 2008→2024 swing
- +7.7pp toward D · 2008: -2.0pp · 2024: 5.7pp
- All cycles
- 2024: D+5.7 2020: D+10.8 2016: R+0.9 2012: R+10.4 2008: R+2.0
Not yet ingested
- Civics
- —
Market trends
- HPI YoY
- ▼ -108.27%
- Current HPI
- 187.6679
- Rent YoY
- ▲ 1.98%
- Metro
- Austin-Round Rock-Georgetown, TX
- State GDP YoY
- ▲ 3.95%
- F500 in state
- 110
Industry mix (Fortune 500 HQ in TX)
| Industry | F500 HQs | Revenue |
|---|---|---|
| Energy | 16 | $1,198B |
|
||
| Technology | 5 | $198B |
|
||
| Engineering / Construction | 4 | $72B |
|
||
| Energy Services | 3 | $60B |
|
||
| Utilities | 3 | $41B |
|
||
| Healthcare | 2 | $330B |
|
||
Price history
+114.6% since first listed9 events — show timeline
- 2026-04-08 Listed $399,000 Unlock MLS
- 2007-10-04 Sold (MLS) — Unlock MLS
- 2007-10-04 Delisted — Unlock MLS
- 2007-08-17 Listed $249,000 Unlock MLS
- 2004-11-19 Sold (MLS) — Unlock MLS
- 2004-10-08 Delisted — Unlock MLS
- 2004-06-29 Listed $185,900 Unlock MLS
- 1999-08-18 Delisted — Unlock MLS
- 1998-06-01 Listed — Unlock MLS
Cash-flow waterfall
monthlySold comps — $/sqft
last 12 mo · ≤1 miLoading sold comps…