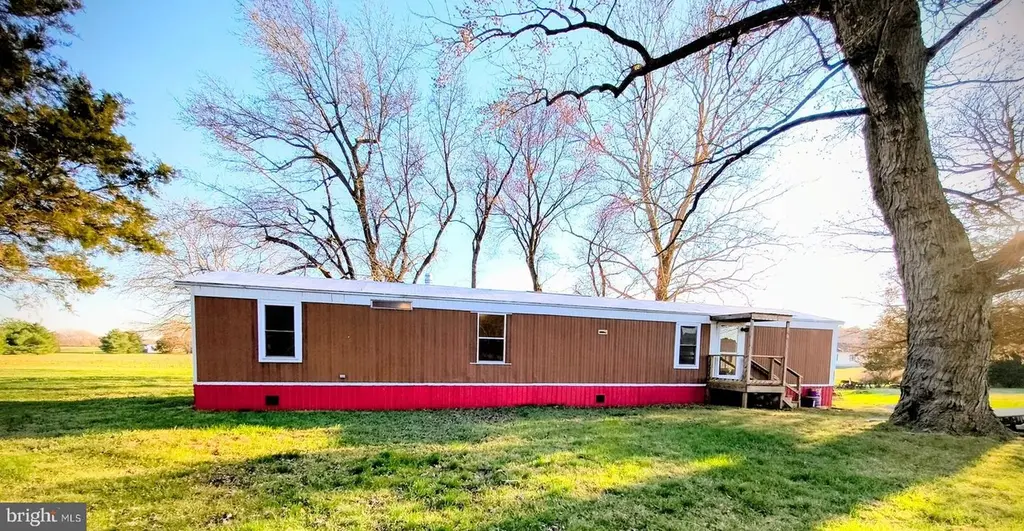
32391 Geib Rd · Cordova, MD
Flood risk No data
- FEMA flood zone
- —
- Chance of flooding over 30 yrs
- —
- Est. flood insurance / yr
- —
Fire risk No data
- Est. fire insurance / yr
- —
Heat risk No data
- Hot days now (above threshold)
- —
- Hot days in 30 yrs
- —
Wind risk No data
- Chance of severe wind over 30 yrs
- —
Air-quality risk No data
- Unhealthy air days now
- —
- Unhealthy air days in 30 yrs
- —
Risk factors via First Street. Map © Google.
Why this score? — see what drove the C+ grade
The composite is a weighted blend of 9 inputs, each scored 0–100. Each bar is that input's sub-score; the figure is the points it added to the 100-point composite (weight × sub-score).
- Cash flow +30.0/30.0
- 1% rule +10.0/10.0
- DSCR +10.0/10.0
- Livability +3.2/5.0
- Rent growth +2.5/5.0
- Condition / age +2.5/5.0
- Schools +2.3/10.0
- ARV discount +2.2/15.0
- Appreciation +0.0/10.0
$95,000
🖨 Deal sheet (PDF) 📄 Offer letter ✓ Due diligence
Listing remarks
This home is located in a quiet country setting, with the backyard overlooking fields. The home has 3 bedrooms, 1.5 bathrooms, a spacious living room that opens up to the kitchen, and a laundry area off the main bathroom. The bathrooms have been refreshed with new toilets & flooring. New flooring has also been added to the kitchen and laundry area. The kitchen cabinets have been freshly painted. This property has been used as a rental property and would be a great opportunity for an investor. Buyer to perform due diligence.
Key facts
- New flooring
- Refreshed bathrooms
- 0.31 acre lot
Tags
Property features AI
Finance
- Financial info: Ownership is fee simple
Exterior
- Parking: Driveway parking
- Utilities: Well water; On-site septic
- Home design: Single-wide manufactured/mobile home; Mobile home built before 1976; Not winterized
- Construction: Modular/Manufactured construction; Above-grade finished living space; No below-grade living area
- Exterior features: Property located outside city limits; Driveway access; Home set back from road with driveway running between two neighboring homes
Interior
- Bedrooms: Three bedrooms on the main level
- Bathrooms: One full bathroom on the main level; One half bathroom on the main level; Total: 1 full bath, 1 half bath
- Heating & cooling: Oil heating; Electric hot water
- Interior features: No basement; Living area measured by assessor
Neighborhood map
What this means for you Summary
Snapshot
- This is a 3-bed/1.0-bath manufactured listed at $95k.
Deal economics
- At list price, monthly cash flow is $1k ($14k/yr) — positive.
- The deal already cash-flows at list — no discount required.
- Meets the 1% rule at list price ($2k rent vs $95k).
- Recommended offer: $94k (1.5% below list) — sets the bar for market timing.
Location & tenants
- Location reads 63/100 on livability (#295 in MD) — a middle-class / working-renter tenant base. Strengths: employment A+, cost of living A+, housing B; Watch: crime F, amenities F, commute F.
- Talbot County Public Schools (town): math 15% / reading 35% proficiency, ranked #12 of 24 in MD (top 50%) — low school quality limits family demand, transient renter base, plan for 1-2y turnover.
- Zoned schools: Chapel District Elementary (math 17% / reading 27%, grade F, #297 of 860 statewide, top 38%, 347 students, 43% FRL); Easton Middle (math 9% / reading 32%, grade F, #141 of 225 statewide, top 65%, 737 students, 62% FRL); Easton High (math 40% / reading 65%, grade C-, #98 of 222 statewide, top 44%, 1,203 students, 56% FRL) — zoned schools average 54% FRL vs 37% district-wide (17 pts higher); higher-poverty schools than district average — tighter screening recommended.
- Market conditions: 12 active listings in the ZIP; 158 units permitted in Talbot County in 2024 (0 in 5+ unit buildings).
Forward outlook
- Local home prices are declining (-3.0%/yr); year-one equity from $657 of loan paydown is wiped out by about $3k of value loss. Plan a longer hold.
- Talbot County population projected at -10% by 2050 — secular population decline; favor cash flow + early exit over multi-decade hold.
- At projected returns (-3.0% appreciation + 3.0% rent growth), your $27k cash investment doubles in ~3 years — after that, you're playing with house money.
Negotiation context
- It's been on market 26 days — a 2% lower offer ($94k) is reasonable based on typical stale-listing flexibility.
Questions for the listing agent
- Built in 1970 — when were the roof, HVAC, electrical panel, plumbing, and water heater last replaced?
- Is there a deadline driving the sale (1031 exchange, divorce, estate, relocation)? That informs how much negotiation room exists.
- Crime grade is F in this area — have there been break-ins, vandalism, or insurance claims at this property in the last 3 years? What carrier currently insures it and at what premium?
- What's the average days-on-market for RENTAL listings here right now (not sales)? A rising rental-DOM trend means longer vacancies and softer asking-rent achievability than the comps imply.
- What's the recent tenant-quality profile in this submarket — average credit score on applications, eviction rate, late-payment / NSF rate, and stable-employment percentage? A property-management company in the area should have these aggregated.
- How much new for-sale + rental construction is in the pipeline within 1–3 miles? Heavy new supply typically softens prices + rents 12–24 months out; constrained supply supports both.
Investment metrics
- 1% rule
- 2.28% ✓
- Cap rate
- 20.52%
- Cash-on-cash
- 50.82%
- DSCR
- 3.26
- GRM
- 3.7
CMA / ARV
- ARV (on-the-fly)
- $85,008
- Comps found
- 1
Show comp detail 1 sale within ~0.75 mi
| Address | Dist | Beds/Ba | Sqft | Sold | Price | $/sf | Match |
|---|---|---|---|---|---|---|---|
| 32391 Geib Rd | 0.00mi | 3/1.5 | 924 (0%) | 1mo | $85,000 | $92 | 97 |
Match score weights: distance 35% · size 25% · config 20% · recency 20%. Top-matched comps best support the ARV.
Projected returns pro-forma
-3.0% appreciation · 3.0% rent growth · sell at horizon
- IRR
- 48.6%
- Equity multiple
- 3.12×
- Total profit
- $56,338
- Equity at exit
- $14,165
- IRR
- 54.2%
- Equity multiple
- 6.32×
- Total profit
- $141,387
- Equity at exit
- $8,214
Cash invested: $26,600 (down + closing). Projections, not guarantees.
Landlord ↔ Tenant lean methodology
- Overall (STATE)
- 27 Tenant-Leaning
- State Maryland
- 27 Tenant-Leaning · D+14
- County
- — inherits STATE
- City
- — inherits STATE
ZIP-level market 21625
- Home prices YoY
- -12.8%
- Active inventory
- 12
- Price-to-rent
- 3.7×
Monthly cashflow live
- Estimated rent
- $2,162 medium interval (Pro) →
- Mortgage (P&I)
- −$498
- Tax from tax record
- −$44 /mo · $522/yr
- Insurance
- −$40
- HOA
- −$0
- Vacancy / Maint / Mgmt
- −$454
- Net cashflow
- $1,126
Break-even live
Sensitivity live
| Price | -10% $1,180 | -5% $1,153 | +0% $1,126 | +5% $1,100 | +10% $1,073 |
|---|---|---|---|---|---|
| Rent | -10% $956 | -5% $1,041 | +0% $1,126 | +5% $1,212 | +10% $1,297 |
| Rate | -1.0pp $1,174 | -0.5pp $1,151 | base $1,126 | +0.5pp $1,102 | +1.0pp $1,077 |
UW: 25.0% down · 7.5% · 30yr · 1.5% tax · 5.0% vac · 8.0% maint · 8.0% mgmt
Financing live
Cash to close
- Down payment
- $23,750
- Closing costs
- $2,850
- Reserves months
- —
- Total cash needed
- —
Loan-product check · same deal, 3 products live
Conventional
25% down · 7.5% · 30yr
- Down + closing
- —
- Monthly P&I
- —
- Monthly cashflow
- —
- DSCR
- —
- Eligible?
- —
Personal DTI + credit; lowest rate.
DSCR
20% down · 8.5% · 30yr
- Down + closing
- —
- Monthly P&I
- —
- Monthly cashflow
- —
- DSCR
- —
- Eligible?
- —
No personal income docs; deal must DSCR.
Hard money
10% down · 12.0% · 12mo
- Down + closing
- —
- Monthly P&I
- —
- Monthly cashflow
- —
- DSCR
- —
- Eligible?
- —
Short-term bridge; refi at stabilization.
Listing history 2 events
-
2026-04-17historical Active Under Contract
-
2026-03-22$95,000 Active
ⓘ Source: listings_history table (triggers on properties + properties_extension) + one-shot
backfill from property_details.listing_events for pre-trigger history.
Tax reassessment forecast MD · Partial reset (capped growth)
- Current annual tax
- $522 · $44/mo
- Projected year-2 tax
- $779 · $65/mo
- Expected delta
- +$257/yr (+$21/mo · 49.2%)
ⓘ Screening estimate from a state-policy table — verify with the county assessor before closing.
Nearby sold comps map
Loading sold comps map…
Walkable amenities ~0.75 mi
Loading nearby amenities…
Taxation est. · year 1
- Rental income
- $25,941
- − Mortgage interest
- −$5,321
- − Property taxes
- −$522
- − Insurance
- −$475
- − Repairs & maintenance
- −$2,075
- − Management
- −$2,075
- − Depreciation
- −$2,764
- Taxable income
- $12,708
- Est. tax owed @ 24.0%
- −$3,050
- After-tax cash flow
- $10,468/yr
For passive investors: Depreciation is non-cash, so a rental often shows a tax loss while cash-flowing — sheltering income. Rental losses are passive: they offset passive income freely, and up to $25,000/yr can offset ordinary (W-2) income if you actively participate and your MAGI is under $100k (phasing out to $0 by $150k); unused losses carry forward. On sale, claimed depreciation is recaptured at up to 25%, and gains may owe capital-gains tax (a 1031 exchange can defer both). Figures are a year-1 estimate at your 24.0% rate — not tax advice; consult a CPA.
Schools (NCES district)
- District
- Talbot County Public Schools
- NCES district ID
- 2400630
- Math proficiency
- 15% ▼ -19.00%
- Reading proficiency
- 35% ▼ -10.00%
- Median HH income
- $61,786
- Composite
- 23.11/100
- National rank
- #7961
- State rank
- #12 of 24 in MD
Livability — Cordova
- Score
- 63/100
- State rank
- #295
- US rank
- #15384
Category grades
Schools grade is shown separately in the Schools card above.
Census & demographics
- Population (ZIP)
- 1,837
Population outlook (Talbot County) Hauer SSP2
- Today (2025)
- 36,811 people
- By 2030
- 36,305 · -1.4%
- By 2040
- 34,818 · -5.4%
- By 2050
- 32,982 · -10.4%
- By 2075
- 29,631 · -19.5%
- By 2100
- 25,767 · -30.0%
Race, ethnicity, and origin ACS 2023
- Neighborhood character
- Predominantly White (79%)
- Race & ethnicity
- White 79% Two or more races 15% Black 5% Hispanic / Latino 3% Asian 1%
- Common ancestry
- Lithuanian 3% Slovak 2% Iranian 1%
- Foreign-born
- 3% · Canada
- Languages at home
- 95% English-only · Spanish 1% Other Indo-European 1%
Political lean MEDSL · Talbot
- 2024 margin
- Toss-up / Even · D 49.0% · R 49.1% · Other 1.9%
- 2008→2024 swing
- +9.6pp toward D · 2008: -9.6pp · 2024: -0.0pp
- All cycles
- 2024: R+0.0 2020: D+0.5 2016: R+11.9 2012: R+13.2 2008: R+9.6
Not yet ingested
- Civics
- —
Market trends
- HPI YoY
- ▼ -39.09%
- Current HPI
- 265.7447
- Rent YoY
- —
- Metro
- —
- State GDP YoY
- ▲ 2.97%
- F500 in state
- 12
Industry mix (Fortune 500 HQ in MD)
| Industry | F500 HQs | Revenue |
|---|---|---|
| Aerospace / Defense | 1 | $71B |
|
||
| Utilities | 1 | $25B |
|
||
| Hotels | 1 | $24B |
|
||
| Consumer Goods | 1 | $7B |
|
||
| Real Estate | 1 | $6B |
|
||
| Chemicals | 1 | $2B |
|
||
Price history
2 events — show timeline
- 2026-04-17 Contingent — BRIGHT MLS
- 2026-03-22 Listed $95,000 BRIGHT MLS
Property tax history
+3.5%/yrLatest (2025): $522 · +4.2% YoY. Source: county tax records.
Cash-flow waterfall
monthlySold comps — $/sqft
last 12 mo · ≤1 miLoading sold comps…