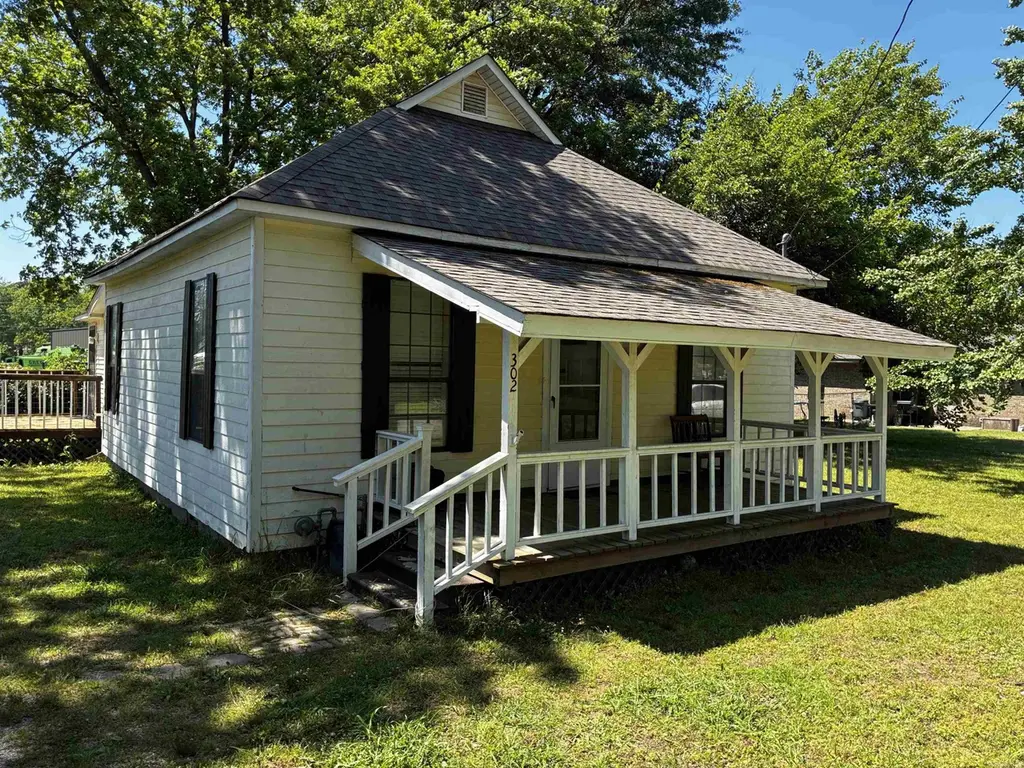
302 Spring St · Beebe, AR
Flood risk 1/10 · Minimal
- FEMA flood zone
- X (unshaded)
- Chance of flooding over 30 yrs
- 0.0%
- Est. flood insurance / yr
- $507 – $1,088
Fire risk 4/10 · Minor
- Est. fire insurance / yr
- $1,499 – $2,785
Heat risk 6/10 · Moderate
- Hot days now (above 109°F)
- 7 days/yr
- Hot days in 30 yrs
- 19 days/yr
Wind risk 3/10 · Minor
- Chance of severe wind over 30 yrs
- 8.0%
Air-quality risk 2/10 · Minimal
- Unhealthy air days now
- 1 days/yr
- Unhealthy air days in 30 yrs
- 1 days/yr
Risk factors via First Street. Map © Google.
Why this score? — see what drove the C grade
The composite is a weighted blend of 9 inputs, each scored 0–100. Each bar is that input's sub-score; the figure is the points it added to the 100-point composite (weight × sub-score).
- Cash flow +19.8/30.0
- ARV discount +15.0/15.0
- DSCR +6.3/10.0
- 1% rule +4.0/10.0
- Schools +3.4/10.0
- Livability +3.3/5.0
- Rent growth +2.5/5.0
- Condition / age +2.5/5.0
- Appreciation +0.0/10.0
$120,000
🖨 Deal sheet 📄 Offer letter ✓ Due diligence
Listing remarks
Neat as a Pin - 3 Bedroom 1 Bath Home. Priced to sell and ideal for first-time buyers, investors, or anyone looking for a solid home at a great value. Convenient to town, schools, and daily essentials. Opportunity and affordability meet. This home checks many boxes and is centrally located to schools and downtown and a great location to reach Little Rock, Searcy, or Conway. Agents, please see remarks.
Key facts
- Convenient to town
- Centrally located
- Detached
Tags
Property features AI
Finance
- Other: Lot approximately 104' x 132' (about 0.32 acre)
- Financial info: Financing possible: conventional loan, cash, or Rural Development
Exterior
- Parking: 2-car parking
- Utilities: Public sewer; Public water; Municipal electric (Entergy); Natural gas
- Home design: Inside city limits
- Construction: Metal/vinyl siding; 3-tab shingle roof; Crawl space foundation with piers; Approximately 1,112 square feet
- Exterior features: Deck; Porch; Outside storage area; Paved road access; Level lot
Interior
- Kitchen: Free-standing stove; Refrigerator stays
- Flooring: Tile; Laminate
- Bathrooms: 1 full bathroom
- Heating & cooling: Central heat (gas); Central cooling (electric)
- Interior features: Washer connection and electric dryer connection; Ceiling fans; Electric log fireplace; Sheetrock walls/ceilings
- Laundry & utility: Laundry area; Washer connection and electric dryer connection; Outside storage area
Neighborhood map
What this means for you Summary
Snapshot
- This is a 3-bed/1.0-bath single-family listed at $120k.
Deal economics
- At list price, monthly cash flow is $142 ($2k/yr) — positive.
- The deal already cash-flows at list — no discount required.
- To meet the 1% rule (rent ≥ 1% of price), the offer needs to be $108k (9.9% below list).
- Recommended offer: $108k (9.9% below list) — sets the bar for 1% rule.
- Cap rate 7.7% vs local median 3.7% in Beebe — top-decile yield for the area; either an underpriced asset or a hidden risk that comps aren't pricing in. Stress-test before assuming the spread holds.
Location & tenants
- Location reads 66/100 on livability (#114 in AR) — a middle-class / working-renter tenant base. Strengths: cost of living A+, housing A+; Watch: schools D+, crime F, amenities F.
- Beebe School District (town): math 44% / reading 36% proficiency, ranked #64 of 238 in AR (top 27%) — families likely to look elsewhere, expect single-tenant / working-renter base with shorter leases.
- Market conditions: 151 active listings in the ZIP; 3 comparable units currently listed for rent nearby; rentals at typical pace (median 24d on market — plan ~3-4 weeks tenant-placement turnaround); 219 units permitted in White County in 2024 (36 in 5+ unit buildings).
Forward outlook
- Local home prices are declining (-3.0%/yr); year-one equity from $830 of loan paydown is wiped out by about $4k of value loss. Plan a longer hold.
- White County population projected at +7% by 2050 — modest demand growth; plan on rents tracking national, not racing it.
Negotiation context
- It's been on market 37 days — a 3% lower offer ($116k) is reasonable based on typical stale-listing flexibility.
- Current owner paid $53k; list at $120k implies a 126% gain — meaningful room to come down on a strong offer.
Risks & watch-outs
- Watch-outs: built in 1932 — expect roof / HVAC / electrical / plumbing capex.
- Climate carrying-cost: extreme-heat days projected 7→19/yr by 2055 (HVAC capex compounding) — expect insurance premiums to compound above CPI over the hold.
Questions for the listing agent
- It's been on market 37 days. Have you received any prior offers? Is the seller open to a 10% concession, seller financing, or rate buy-down credit?
- Built in 1932 — when were the roof, HVAC, electrical panel, plumbing, and water heater last replaced?
- Is there a deadline driving the sale (1031 exchange, divorce, estate, relocation)? That informs how much negotiation room exists.
- Schools are D-rated, which usually means shorter tenancies and higher turnover. Who's the typical renter profile here, and what's been the actual vacancy rate?
- Crime grade is F in this area — have there been break-ins, vandalism, or insurance claims at this property in the last 3 years? What carrier currently insures it and at what premium?
- What's the average days-on-market for RENTAL listings here right now (not sales)? A rising rental-DOM trend means longer vacancies and softer asking-rent achievability than the comps imply.
- What's the recent tenant-quality profile in this submarket — average credit score on applications, eviction rate, late-payment / NSF rate, and stable-employment percentage? A property-management company in the area should have these aggregated.
- How much new for-sale + rental construction is in the pipeline within 1–3 miles? Heavy new supply typically softens prices + rents 12–24 months out; constrained supply supports both.
Investment metrics
- 1% rule
- 0.90% ✗
- Cap rate
- 7.71%
- Cash-on-cash
- 5.08%
- DSCR
- 1.23
- GRM
- 9.2
CMA / ARV
- ARV (median comp)
- $151,752
- List price
- $120,000
- Delta
- -20.92%
- Verdict
- UNDERPRICED
- Comps
- 20 within 1.0 mi
Show comp detail 12 sales within ~0.75 mi
| Address | Dist | Beds/Ba | Sqft | Sold | Price | $/sf | Match |
|---|---|---|---|---|---|---|---|
| 616 S Elm St | 0.42mi | 3/1.0 | 1,048 (-6%) | 3mo | $151,000 | $144 | 69 |
| 804 W Indiana Sts | 0.69mi | 3/1.0 | 1,128 (+1%) | 0mo | $135,000 | $120 | 65 |
| 615 S Elm St | 0.41mi | 3/1.0 | 1,186 (+7%) | 6mo | $65,000 | $55 | 65 |
| 930 S Fir St | 0.53mi | 3/2.0 | 1,200 (+8%) | 0mo | $200,000 | $167 | 58 |
| 704 N Cypress St | 0.49mi | 2/1.0 (-1) | 1,022 (-8%) | 5mo | $130,000 | $127 | 55 |
| 924 S Fir St | 0.53mi | 3/2.0 | 1,200 (+8%) | 4mo | $198,000 | $165 | 54 |
| 928 S Fir St | 0.53mi | 3/2.0 | 1,200 (+8%) | 5mo | $203,100 | $169 | 54 |
| 922 S Fir St | 0.53mi | 3/2.0 | 1,200 (+8%) | 5mo | $198,000 | $165 | 54 |
| 229 Baldwin Dr | 0.68mi | 3/2.0 | 1,143 (+3%) | 7mo | $170,000 | $149 | 54 |
| 122 S Apple St | 0.51mi | 3/2.0 | 1,250 (+12%) | 2mo | $202,000 | $162 | 50 |
| 515 E Mississippi | 0.61mi | 3/2.0 | 1,204 (+8%) | 7mo | $198,000 | $164 | 48 |
| 3042 Highway 31 S | 0.54mi | 2/2.0 (-1) | 1,260 (+13%) | 6mo | $155,000 | $123 | 39 |
Match score weights: distance 35% · size 25% · config 20% · recency 20%. Top-matched comps best support the ARV.
Projected returns pro-forma
-3.0% appreciation · 3.0% rent growth · sell at horizon
- IRR
- -8.5%
- Equity multiple
- 0.69×
- Total profit
- $-10,450
- Equity at exit
- $17,892
- IRR
- 1.0%
- Equity multiple
- 1.07×
- Total profit
- $2,328
- Equity at exit
- $10,375
Cash invested: $33,600 (down + closing). Projections, not guarantees.
Landlord ↔ Tenant lean methodology
- Overall (STATE)
- 92 Strongly Landlord-Friendly
- State Arkansas
- 92 Strongly Landlord-Friendly · R+14
- County
- — inherits STATE
- City
- — inherits STATE
ZIP-level market 72012
- Home prices YoY
- -15.4%
- Active inventory
- 151
- Price-to-rent
- 9.2×
Monthly cashflow live
- Estimated rent
- $1,081 medium interval (Pro) →
- Mortgage (P&I)
- −$629
- Tax from tax record
- −$33 /mo · $395/yr
- Insurance
- −$50
- HOA
- −$0
- Vacancy / Maint / Mgmt
- −$227
- Net cashflow
- $142
Break-even live
UW: 25.0% down · 7.5% · 30yr · 1.5% tax · 5.0% vac · 8.0% maint · 8.0% mgmt
Financing live
Cash to close
- Down payment
- $30,000
- Closing costs
- $3,600
- Reserves months
- —
- Total cash needed
- —
Loan-product check · same deal, 3 products live
Conventional
25% down · 7.5% · 30yr
- Down + closing
- —
- Monthly P&I
- —
- Monthly cashflow
- —
- DSCR
- —
- Eligible?
- —
Personal DTI + credit; lowest rate.
DSCR
20% down · 8.5% · 30yr
- Down + closing
- —
- Monthly P&I
- —
- Monthly cashflow
- —
- DSCR
- —
- Eligible?
- —
No personal income docs; deal must DSCR.
Hard money
10% down · 12.0% · 12mo
- Down + closing
- —
- Monthly P&I
- —
- Monthly cashflow
- —
- DSCR
- —
- Eligible?
- —
Short-term bridge; refi at stabilization.
Rent comps 3 comps
| Address | Beds | Baths | Sqft | Rent | $/sqft | DOM | Units | Dist |
|---|---|---|---|---|---|---|---|---|
| 501 N Elm St Beebe, AR | 2.0 | 1.0 | 1028 | $795 | $0.77 | 23d | 1 | 0.37mi |
| 213 N Hickory St Beebe, AR | 4.0 | 1.0 | 1380 | $1,450 | $1.05 | 23d | 1 | 0.42mi |
| 606 Oregon St Beebe, AR | 2.0 | 2.0 | 1394 | $1,095 | $0.79 | 43d | 1 | 0.88mi |
Listing history 12 events
-
2026-06-09days on market $120,000 Active 37 DOM
-
2026-06-08days on market $120,000 Active 36 DOM
-
2026-06-07days on market $120,000 Active 35 DOM
-
2026-06-05days on market $120,000 Active 32 DOM
-
2026-06-03days on market $120,000 Active 31 DOM
-
2026-06-02days on market $120,000 Active 30 DOM
-
2026-06-01days on market $120,000 Active 29 DOM
-
2026-05-31days on market $120,000 Active 28 DOM
-
2026-05-30days on market $120,000 Active 27 DOM
-
2026-05-03$120,000 New Listing 404-char remark
-
2007-10-23soldstatus $53,000
-
2000-07-25soldstatus $18,000
ⓘ Source: listings_history table (triggers on properties + properties_extension) + one-shot
backfill from property_details.listing_events for pre-trigger history.
Tax reassessment forecast AR · Resets to sale price
- Current annual tax
- $395 · $33/mo
- Projected year-2 tax
- $768 · $64/mo
- Expected delta
- +$373/yr (+$31/mo · 94.5%)
ⓘ Screening estimate from a state-policy table — verify with the county assessor before closing.
Climate risk First Street
- Flood 1/10 Low FEMA zone X (unshaded) · 0% chance over 30 yrs
- Wildfire 4/10 Moderate
- Heat 6/10 Major 7 d/yr ≥109°F today · 19 d/yr by 30 yrs out
- Wind 3/10 Moderate 8% chance of damaging wind over 30 yrs
- Air quality 2/10 Low 1 unhealthy d/yr today · 1 by 30 yrs out
Nearby sold comps map
Loading sold comps map…
Walkable amenities ~0.75 mi
Loading nearby amenities…
Taxation est. · year 1
- Rental income
- $12,977
- − Mortgage interest
- −$6,722
- − Property taxes
- −$395
- − Insurance
- −$600
- − Repairs & maintenance
- −$1,038
- − Management
- −$1,038
- − Depreciation
- −$3,491
- Taxable loss
- −$307
- Est. tax savings @ 24.0%
- +$74
- After-tax cash flow
- $1,779/yr
For passive investors: Depreciation is non-cash, so a rental often shows a tax loss while cash-flowing — sheltering income. Rental losses are passive: they offset passive income freely, and up to $25,000/yr can offset ordinary (W-2) income if you actively participate and your MAGI is under $100k (phasing out to $0 by $150k); unused losses carry forward. On sale, claimed depreciation is recaptured at up to 25%, and gains may owe capital-gains tax (a 1031 exchange can defer both). Figures are a year-1 estimate at your 24.0% rate — not tax advice; consult a CPA.
Schools (NCES district)
- District
- Beebe School District
- NCES district ID
- 0502880
- Math proficiency
- 44% ▼ -10.00%
- Reading proficiency
- 36% ▼ -7.00%
- Median HH income
- $45,433
- Composite
- 34.1/100
- National rank
- #5293
- State rank
- #64 of 238 in AR
Livability — Beebe
- Score
- 66/100
- State rank
- #114
- US rank
- #11235
Category grades
Schools grade is shown separately in the Schools card above.
Census & demographics
- Census place
- Beebe, AR
- Population (ZIP)
- 13,663
Population outlook (White County) Hauer SSP2
- Today (2025)
- 82,310 people
- By 2030
- 83,861 · +1.9%
- By 2040
- 86,492 · +5.1%
- By 2050
- 88,246 · +7.2%
- By 2075
- 91,307 · +10.9%
- By 2100
- 91,548 · +11.2%
Race, ethnicity, and origin ACS 2023
- Neighborhood character
- Predominantly White (90%)
- Race & ethnicity
- White 90% Two or more races 6% Hispanic / Latino 3% Black 1%
- Common ancestry
- Slovak 3% Italian 2% Romanian 1%
- Foreign-born
- 1% · Canada
- Languages at home
- 98% English-only · Spanish 1%
Political lean MEDSL · White
- 2024 margin
- Solid R (+61.2) · D 18.3% · R 79.5% · Other 2.2%
- 2008→2024 swing
- -14.0pp toward R · 2008: -47.2pp · 2024: -61.2pp
- All cycles
- 2024: R+61.2 2020: R+58.9 2016: R+57.9 2012: R+53.7 2008: R+47.2
Not yet ingested
- Civics
- —
Market trends
- HPI YoY
- ▼ -40.40%
- Current HPI
- 221.5962
- Rent YoY
- —
- Metro
- —
- State GDP YoY
- ▲ 3.80%
- F500 in state
- 10
Industry mix (Fortune 500 HQ in AR)
| Industry | F500 HQs | Revenue |
|---|---|---|
| Retail | 1 | $681B |
|
||
| Food / Agriculture | 1 | $53B |
|
||
| Retail / Energy | 1 | $22B |
|
||
| Transportation / Logistics | 1 | $12B |
|
||
| Energy | 1 | $4B |
|
||
Price history
+566.7% since first listed4 events — show timeline
- 2026-06-12 Listing Removed — CARMLS
- 2026-05-03 Listed $120,000 CARMLS
- 2007-10-23 Sold (Public Records) $53,000 Public Records
- 2000-07-25 Sold (Public Records) $18,000 Public Records
Property tax history
+2.6%/yrLatest (2025): $395 · +0.0% YoY. Source: county tax records.
Cash-flow waterfall
monthlySold comps — $/sqft
last 12 mo · ≤1 miLoading sold comps…