1006 Hampstead Rd · Saw Creek, PA
Flood risk 1/10 · Minimal
- FEMA flood zone
- X (unshaded)
- Chance of flooding over 30 yrs
- 0.0%
- Est. flood insurance / yr
- $473 – $860
Fire risk 4/10 · Minor
- Est. fire insurance / yr
- $511 – $949
Heat risk 3/10 · Minor
- Hot days now (above 95°F)
- 7 days/yr
- Hot days in 30 yrs
- 15 days/yr
Wind risk 4/10 · Minor
- Chance of severe wind over 30 yrs
- 11.0%
Air-quality risk 2/10 · Minimal
- Unhealthy air days now
- 1 days/yr
- Unhealthy air days in 30 yrs
- 2 days/yr
Risk factors via First Street. Map © Google.
Why this score? — see what drove the C- grade
The composite is a weighted blend of 9 inputs, each scored 0–100. Each bar is that input's sub-score; the figure is the points it added to the 100-point composite (weight × sub-score).
- ARV discount +15.0/15.0
- Cash flow +12.3/30.0
- Appreciation +6.8/10.0
- 1% rule +5.5/10.0
- DSCR +3.7/10.0
- Schools +3.0/10.0
- Livability +3.0/5.0
- Rent growth +2.5/5.0
- Condition / age +2.5/5.0
$210,000
🖨 Deal sheet 📄 Offer letter ✓ Due diligence
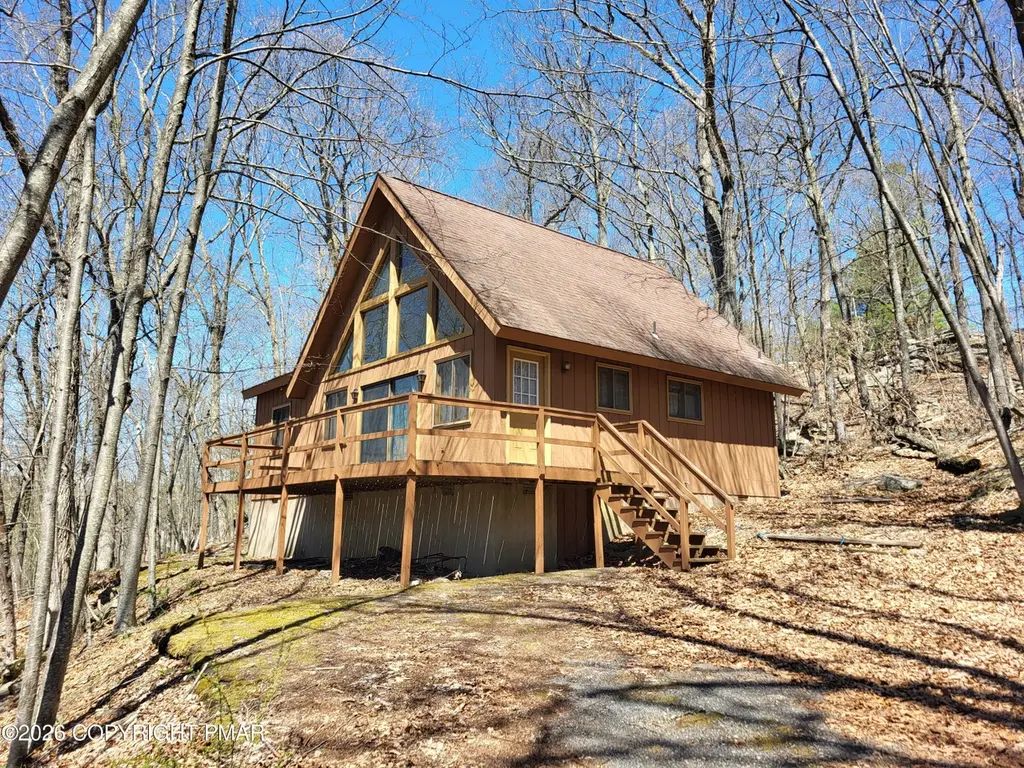
Listing remarks
(3)Bedroom (2)Full-Bath Chalet. . Large Primary Bedroom w/ Private Bath Having Large Spa-Tub. . Living Room w/ Double Hearth Wood-Burning Brickfaced Fireplace. 2nd Bedroom & 2nd Full-Bath on Main Floor as well. . Large Loft Area w/ Beautiful Mountain Scape Views, Could Serve as 3rd Private Bedroom/Loft Using Privacy Room Divider. . Large Front Deck (being elevated from the street) Offers Total Privacy. Vacant Lots on Either Side. .. Close Proximity to Top-of-The-World Restaurnt/Lounge, Indoor/Outdoor Pool, Indoor Tennis, Pickle Ball Courts, Racquet Ball Court, Fitness Room, Free-Weight Room, Snow Boarding Ski Slope w/ Snowmaking/Chair-Lift. .(beginner/intermediate trails). . All Servi
Key facts
- Large loft area
- Mountain scape views
- Private bath
Tags
Property features AI
Finance
- HOA & community: Homeowners association with annual fee; Association amenities include security, gated entry, clubhouse, indoor pool, outdoor pool, and ski access; Association fee covers trash, security, and grounds maintenance
Exterior
- Parking: Total of 6 parking spaces; 4 open parking spaces; Off-street paved parking
- Security: 24-hour security
- Utilities: Public water; Public sewer; 200+ amp electric service; Cable available
- Home design: Single-family house; Faces south; No shared/common walls
- Construction: Asphalt roof; Block foundation
- Exterior features: Deck; Has a view; Greenbelt, sloped and wooded lot; Public maintained paved road
Interior
- Kitchen: Electric oven; Self-cleaning oven; Range hood
- Bedrooms: Total of 5 rooms (bedroom count not separately listed)
- Flooring: Carpet; Ceramic tile; Vinyl
- Bathrooms: 2 full bathrooms
- Heating & cooling: Baseboard heating (electric); Ceiling fans; Window air conditioning units
- Interior features: Cathedral ceilings; Ceiling fans; Insulated windows; Wood-burning masonry fireplace in bedroom and living room; Unfurnished
- Laundry & utility: Washer and dryer included; Washer hookup; Electric dryer hookup on main level
Neighborhood map
What this means for you Summary
Snapshot
- This is a 3-bed/2.0-bath single-family listed at $210k.
Deal economics
- At list price, monthly cash flow is $-37 ($-445/yr) — negative.
- To cash-flow at today's rent, offer at most $203k (3.1% below list).
- Meets the 1% rule at list price ($2k rent vs $210k).
- Recommended offer: $203k (3.1% below list) — sets the bar for cash-flow.
- Cap rate 6.1% vs local median 4.3% in Saw Creek — top-decile yield for the area; either an underpriced asset or a hidden risk that comps aren't pricing in. Stress-test before assuming the spread holds.
Location & tenants
- Location reads 59/100 on livability (#1,538 in PA) — a working-class tenant base; expect higher turnover. Strengths: crime A+, cost of living A+, housing A+; Watch: employment C-, health & safety D, schools F.
- East Stroudsburg Area SD (rural): math 25% / reading 43% proficiency, ranked #413 of 539 in PA (top 77%) — families likely to look elsewhere, expect single-tenant / working-renter base with shorter leases.
- Market conditions: 290 active listings in the ZIP; 2 comparable units currently listed for rent nearby; 213 units permitted in Pike County in 2024 (0 in 5+ unit buildings).
Forward outlook
- In year one you build about $9k of equity ($1k loan paydown + $7k appreciation (3.5% local appreciation)).
- Pike County population projected at -25% by 2050 — secular population decline; favor cash flow + early exit over multi-decade hold.
- At projected returns (3.5% appreciation + 3.0% rent growth), your $59k cash investment doubles in ~6 years — after that, you're playing with house money.
- By year 5, paydown + projected appreciation supports a ~$38k cash-out refi (75% LTV) — recoverable capital for the next deal without selling this one.
Negotiation context
- It's been on market 36 days — a 3% lower offer ($204k) is reasonable based on typical stale-listing flexibility.
- 2 sale attempts with the ask held roughly flat each time — persistent listings suggest the price (not the market) is what's stuck; bring a comps-based counter.
- Current owner paid $70k; list at $210k implies a 200% gain — meaningful room to come down on a strong offer.
Questions for the listing agent
- What do current leases actually rent for vs. the listed asking? Can we see a recent rent roll and the last 12 months of T-12 income?
- It's been on market 36 days. Have you received any prior offers? Is the seller open to a 3% concession, seller financing, or rate buy-down credit?
- What does the HOA fee cover, when was the last increase, and are there any pending special assessments or reserve-fund shortfalls?
- Is there a deadline driving the sale (1031 exchange, divorce, estate, relocation)? That informs how much negotiation room exists.
- Schools are F-rated, which usually means shorter tenancies and higher turnover. Who's the typical renter profile here, and what's been the actual vacancy rate?
- What's the average days-on-market for RENTAL listings here right now (not sales)? A rising rental-DOM trend means longer vacancies and softer asking-rent achievability than the comps imply.
- What's the recent tenant-quality profile in this submarket — average credit score on applications, eviction rate, late-payment / NSF rate, and stable-employment percentage? A property-management company in the area should have these aggregated.
- How much new for-sale + rental construction is in the pipeline within 1–3 miles? Heavy new supply typically softens prices + rents 12–24 months out; constrained supply supports both.
Investment metrics
- 1% rule
- 1.05% ✓
- Cap rate
- 6.08%
- Cash-on-cash
- -0.76%
- DSCR
- 0.97
- GRM
- 8.0
CMA / ARV
- ARV (median comp)
- $260,105
- List price
- $210,000
- Delta
- -19.26%
- Verdict
- UNDERPRICED
- Comps
- 20 within 1.0 mi
Show comp detail 12 sales within ~0.75 mi
| Address | Dist | Beds/Ba | Sqft | Sold | Price | $/sf | Match |
|---|---|---|---|---|---|---|---|
| 6298 Decker Rd | 0.30mi | 3/2.0 | 1,638 (+2%) | 0mo | $340,000 | $208 | 82 |
| 155 Clifton Dr | 0.47mi | 3/2.0 | 1,656 (+3%) | 1mo | $260,000 | $157 | 72 |
| 113 Regent St | 0.23mi | 3/2.5 | 1,793 (+12%) | 1mo | $305,000 | $170 | 67 |
| 3216 Carlisle Ct | 0.59mi | 3/2.0 | 1,664 (+4%) | 3mo | $215,000 | $129 | 64 |
| 3220 Cherry Ridge Rd | 0.53mi | 3/2.5 | 1,760 (+10%) | 1mo | $330,000 | $188 | 57 |
| 150 Dover Dr | 0.55mi | 3/2.0 | 1,456 (-10%) | 5mo | $235,000 | $161 | 54 |
| 2096 Scarborough Way | 0.62mi | 4/2.0 (+1) | 1,504 (-6%) | 3mo | $249,000 | $166 | 53 |
| 5081 Woodbridge Dr E | 0.46mi | 3/2.0 | 1,820 (+13%) | 7mo | $263,500 | $145 | 50 |
| 121 Sterling Cir | 0.54mi | 4/3.0 (+1) | 1,718 (+7%) | 7mo | $340,000 | $198 | 48 |
| 5135 Woodbridge Dr E | 0.71mi | 3/2.0 | 1,788 (+11%) | 1mo | $330,000 | $185 | 48 |
| 6471 Decker Rd | 0.52mi | 3/2.0 | 1,372 (-15%) | 8mo | $265,000 | $193 | 45 |
| 143 Totteridge Rd | 0.74mi | 3/2.0 | 1,416 (-12%) | 4mo | $220,000 | $155 | 42 |
Match score weights: distance 35% · size 25% · config 20% · recency 20%. Top-matched comps best support the ARV.
Projected returns pro-forma
3.51% appreciation · 3.0% rent growth · sell at horizon
- IRR
- 8.3%
- Equity multiple
- 1.49×
- Total profit
- $28,843
- Equity at exit
- $100,465
- IRR
- 10.7%
- Equity multiple
- 2.69×
- Total profit
- $99,459
- Equity at exit
- $159,698
Cash invested: $58,800 (down + closing). Projections, not guarantees.
Landlord ↔ Tenant lean methodology
- Overall (STATE)
- 62 Landlord-Friendly
- State Pennsylvania
- 62 Landlord-Friendly · EVEN
- County
- — inherits STATE
- City
- — inherits STATE
ZIP-level market 18324
- Home prices YoY
- 1.5%
- Active inventory
- 290
- Price-to-rent
- 8.0×
Monthly cashflow live
- Estimated rent
- $2,200 medium interval (Pro) →
- Mortgage (P&I)
- −$1,101
- Tax from tax record
- −$405 /mo · $4,864/yr
- Insurance
- −$88
- HOA
- −$181
- Vacancy / Maint / Mgmt
- −$462
- Net cashflow
- $-37
Break-even live
UW: 25.0% down · 7.5% · 30yr · 1.5% tax · 5.0% vac · 8.0% maint · 8.0% mgmt
Financing live
Cash to close
- Down payment
- $52,500
- Closing costs
- $6,300
- Reserves months
- —
- Total cash needed
- —
Loan-product check · same deal, 3 products live
Conventional
25% down · 7.5% · 30yr
- Down + closing
- —
- Monthly P&I
- —
- Monthly cashflow
- —
- DSCR
- —
- Eligible?
- —
Personal DTI + credit; lowest rate.
DSCR
20% down · 8.5% · 30yr
- Down + closing
- —
- Monthly P&I
- —
- Monthly cashflow
- —
- DSCR
- —
- Eligible?
- —
No personal income docs; deal must DSCR.
Hard money
10% down · 12.0% · 12mo
- Down + closing
- —
- Monthly P&I
- —
- Monthly cashflow
- —
- DSCR
- —
- Eligible?
- —
Short-term bridge; refi at stabilization.
Rent comps 2 comps
| Address | Beds | Baths | Sqft | Rent | $/sqft | DOM | Units | Dist |
|---|---|---|---|---|---|---|---|---|
| 353 Saunders Dr Unit PA East Stroudsburg, PA | 3.0 | 2.0 | 1287 | $2,200 | $1.71 | 20d | 1 | 1.06mi |
| 272 Stafford Dr Bushkill, PA | 3.0 | 2.0 | 1218 | $2,200 | $1.81 | 1d | 1 | 1.27mi |
HOA detail
- Monthly dues
- $181 · $2,172/yr
- Likely covers
- pool
Listing history 19 events
-
2026-06-19days on market $210,000 Active 36 DOM
-
2026-06-18days on market $210,000 Active 35 DOM
-
2026-06-17days on market $210,000 Active 34 DOM
-
2026-06-16days on market $210,000 Active 33 DOM
-
2026-06-15days on market $210,000 Active 32 DOM
-
2026-06-14days on market $210,000 Active 30 DOM
-
2026-06-13days on market $210,000 Active 29 DOM
-
2026-06-10days on market $210,000 Active 27 DOM
-
2026-06-09days on market $210,000 Active 26 DOM
-
2026-06-08days on market $210,000 Active 25 DOM
-
2026-06-07days on market $210,000 Active 24 DOM
-
2026-06-05days on market $210,000 Active 21 DOM
-
2026-06-02days on market $210,000 Active 19 DOM
-
2026-06-01days on market $210,000 Active 18 DOM
-
2026-05-31days on market $210,000 Active 17 DOM
-
2026-05-30status $210,000 Active 16 DOM
-
2026-05-18status Pending 752-char remark
-
2026-05-02$210,000 Active 752-char remark
-
1983-12-27soldstatus $70,000
ⓘ Source: listings_history table (triggers on properties + properties_extension) + one-shot
backfill from property_details.listing_events for pre-trigger history.
Tax reassessment forecast PA · Partial reset (capped growth)
- Current annual tax
- $4,864 · $405/mo
- Projected year-2 tax
- $4,864 · $405/mo
- Expected delta
- $0/yr ($0/mo · 0.0%)
ⓘ Screening estimate from a state-policy table — verify with the county assessor before closing.
Climate risk First Street
- Flood 1/10 Low FEMA zone X (unshaded) · 0% chance over 30 yrs
- Wildfire 4/10 Moderate
- Heat 3/10 Moderate 7 d/yr ≥95°F today · 15 d/yr by 30 yrs out
- Wind 4/10 Moderate 11% chance of damaging wind over 30 yrs
- Air quality 2/10 Low 1 unhealthy d/yr today · 2 by 30 yrs out
Nearby sold comps map
Loading sold comps map…
Walkable amenities ~0.75 mi
Loading nearby amenities…
Taxation est. · year 1
- Rental income
- $26,400
- − Mortgage interest
- −$11,763
- − Property taxes
- −$4,864
- − Insurance
- −$1,050
- − Repairs & maintenance
- −$2,112
- − Management
- −$2,112
- − HOA
- −$2,172
- − Depreciation
- −$6,109
- Taxable loss
- −$3,783
- Est. tax savings @ 24.0%
- +$908
- After-tax cash flow
- $462/yr
For passive investors: Depreciation is non-cash, so a rental often shows a tax loss while cash-flowing — sheltering income. Rental losses are passive: they offset passive income freely, and up to $25,000/yr can offset ordinary (W-2) income if you actively participate and your MAGI is under $100k (phasing out to $0 by $150k); unused losses carry forward. On sale, claimed depreciation is recaptured at up to 25%, and gains may owe capital-gains tax (a 1031 exchange can defer both). Figures are a year-1 estimate at your 24.0% rate — not tax advice; consult a CPA.
Schools (NCES district)
- District
- East Stroudsburg Area SD
- NCES district ID
- 4208670
- Math proficiency
- 25% ▼ -11.00%
- Reading proficiency
- 43% ▼ -18.00%
- Median HH income
- $57,142
- Composite
- 30.13/100
- National rank
- #6332
- State rank
- #413 of 539 in PA
Livability — Saw Creek
- Score
- 59/100
- State rank
- #1538
- US rank
- #20241
Category grades
Schools grade is shown separately in the Schools card above.
Census & demographics
- Census place
- Saw Creek, PA
- Population (ZIP)
- 9,591
Population outlook (Pike County) Hauer SSP2
- Today (2025)
- 53,548 people
- By 2030
- 51,622 · -3.6%
- By 2040
- 46,490 · -13.2%
- By 2050
- 40,372 · -24.6%
- By 2075
- 31,951 · -40.3%
- By 2100
- 26,821 · -49.9%
Race, ethnicity, and origin ACS 2023
- Neighborhood character
- Diverse neighborhood (Simpson 0.67)
- Race & ethnicity
- White 47% Hispanic / Latino 26% Black 21% Two or more races 12% Asian 1%
- Hispanic origin (detail)
- Mexican 1% Puerto Rican 12% Cuban 3% Dominican 5%
- Common ancestry
- Romanian 2% Estonian 1% Lithuanian 1%
- Foreign-born
- 19% · Canada, South Korea
- Languages at home
- 69% English-only · Spanish 19% Russian/Polish/Slavic 4% French/Haitian/Cajun 3%
Political lean MEDSL · Pike
- 2024 margin
- Strong R (+24.1) · D 37.6% · R 61.6%
- 2008→2024 swing
- -19.8pp toward R · 2008: -4.2pp · 2024: -24.1pp
- All cycles
- 2024: R+24.1 2020: R+19.0 2016: R+26.0 2012: R+11.0 2008: R+4.2
Not yet ingested
- Civics
- —
Market trends
- HPI YoY
- ▲ 3.51%
- Current HPI
- 243.6754
- Rent YoY
- —
- Metro
- —
- State GDP YoY
- ▲ 1.68%
- F500 in state
- 34
Industry mix (Fortune 500 HQ in PA)
| Industry | F500 HQs | Revenue |
|---|---|---|
| Healthcare | 2 | $309B |
|
||
| Insurance | 2 | $27B |
|
||
| Telecommunications / Media | 1 | $124B |
|
||
| Industrial Distribution | 1 | $22B |
|
||
| Financial Services | 1 | $20B |
|
||
| Chemicals / Materials | 1 | $18B |
|
||
Price history
+200.0% since first listed4 events — show timeline
- 2026-05-30 Relisted — PMAR
- 2026-05-18 Pending — PMAR
- 2026-05-02 Listed $210,000 PMAR
- 1983-12-27 Sold (Public Records) $70,000 Public Records
Property tax history
+1.0%/yrLatest (2026): $4,864 · +1.6% YoY. Source: county tax records.
Cash-flow waterfall
monthlySold comps — $/sqft
last 12 mo · ≤1 miLoading sold comps…