 🏗️ New Construction
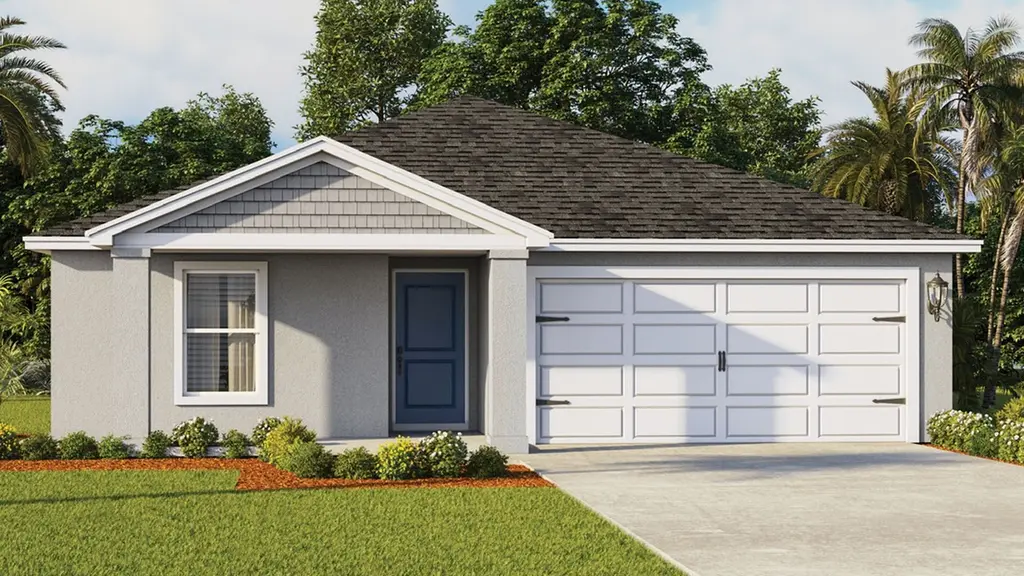
130 Heirloom Dr · Ormond Beach, FL
Flood risk No data
- FEMA flood zone
- —
- Chance of flooding over 30 yrs
- —
- Est. flood insurance / yr
- —
Fire risk No data
- Est. fire insurance / yr
- —
Heat risk No data
- Hot days now (above threshold)
- —
- Hot days in 30 yrs
- —
Wind risk No data
- Chance of severe wind over 30 yrs
- —
Air-quality risk No data
- Unhealthy air days now
- —
- Unhealthy air days in 30 yrs
- —
Risk factors via First Street. Map © Google.
Why this score? — see what drove the D- grade
The composite is a weighted blend of 9 inputs, each scored 0–100. Each bar is that input's sub-score; the figure is the points it added to the 100-point composite (weight × sub-score).
- Cash flow +9.5/30.0
- ARV discount +7.5/15.0
- Schools +4.6/10.0
- Livability +4.2/5.0
- Rent growth +2.9/5.0
- DSCR +2.7/10.0
- Condition / age +2.5/5.0
- 1% rule +2.1/10.0
- Appreciation +0.0/10.0
$349,990
🖨 Deal sheet (PDF) 📄 Offer letter ✓ Due diligence
Listing remarks MLS
The property is located at 130 Heirloom Drive ORMOND BEACH FL 32174 priced at 361990, the square foot and stories are 1708, 1.The number of bath is 2, halfbath is 0 there are 5 bedrooms and 2 garages. For more details please, call or email.
Key facts
- Dual sinks
- Walk-in closet
- Primary suite
Tags
Property features AI
Finance
- Other: Pets allowed: cats and dogs
- HOA & community: Homeowners association with a $55 monthly fee
Exterior
- Parking: Attached garage; 2 garage spaces
- Utilities: Public water; Public sewer; Electricity available; Cable available
- Home design: Single family residence; Residential property; One story; Under construction / New construction
- Construction: Block and stucco construction; Shingle roof; Slab foundation
- Exterior features: Patio; Paved road
Interior
- Kitchen: Electric range; Dishwasher; Disposal
- Bedrooms: Total rooms: 8
- Flooring: Carpet; Laminate
- Bathrooms: 2 full bathrooms
- Heating & cooling: Central heating; Electric heating; Heat pump; Central air conditioning; Electric cooling
- Interior features: Eat-in kitchen; Entrance foyer; Kitchen island; Open floorplan; Pantry; Walk-in closets
- Laundry & utility: Washer hookup; Electric dryer hookup
Neighborhood map
What this means for you Summary
Snapshot
- This is a 5-bed/2.0-bath land listed at $350k.
Deal economics
- At list price, monthly cash flow is $-243 ($-3k/yr) — negative.
- To cash-flow at today's rent, offer at most $307k (12.3% below list).
- To meet the 1% rule (rent ≥ 1% of price), the offer needs to be $247k (29.5% below list).
- Recommended offer: $247k (29.5% below list) — sets the bar for 1% rule.
- Cap rate 5.5% vs local median 3.8% in Ormond Beach — top-decile yield for the area; either an underpriced asset or a hidden risk that comps aren't pricing in. Stress-test before assuming the spread holds.
Location & tenants
- Location reads 83/100 on livability (#55 in FL, #965 nationally) — a professional / high-income tenant draw. Strengths: amenities A+, housing A+, health & safety A+; Watch: commute F.
- Flagler (rural): math 53% / reading 56% proficiency, ranked #20 of 73 in FL (top 27%) — acceptable for families but not a draw, mixed tenant base, ~2y average lease.
- Zoned schools: Bunnell Elementary School (math 42% / reading 44%, grade F, #1,366 of 2,144 statewide, top 64%, 1,080 students, 73% FRL); Buddy Taylor Middle School (math 50% / reading 45%, grade C-, #288 of 571 statewide, top 51%, 1,343 students, 63% FRL); Flagler-Palm Coast High School (math 36% / reading 51%, grade F, #248 of 667 statewide, top 38%, 2,523 students, 52% FRL).
- Market conditions: Rents rising (+1.6%/yr); 989 active listings in the ZIP; 2,588 units permitted in Flagler County in 2024 (0 in 5+ unit buildings).
- This rent runs 42% of the median local income ($71k/yr) — at the standard rent-burdened threshold; future hikes will face affordability resistance.
Forward outlook
- Local home prices are declining (-3.0%/yr); year-one equity from $2k of loan paydown is wiped out by about $10k of value loss. Plan a longer hold.
- Flagler County population projected at +28% by 2050 — long-run rental-demand tailwind backs the buy-and-hold thesis.
Negotiation context
- It's been on market 79 days — a 6% lower offer ($329k) is reasonable based on typical stale-listing flexibility.
- 2 sale attempts with the ask held roughly flat each time — persistent listings suggest the price (not the market) is what's stuck; bring a comps-based counter.
Questions for the listing agent
- What do current leases actually rent for vs. the listed asking? Can we see a recent rent roll and the last 12 months of T-12 income?
- It's been on market 79 days. Have you received any prior offers? Is the seller open to a 29% concession, seller financing, or rate buy-down credit?
- What does the HOA fee cover, when was the last increase, and are there any pending special assessments or reserve-fund shortfalls?
- Why hasn't it sold? Are there any deal-killer items the seller is aware of (foundation, flood, title, zoning, code violations)?
- Is there a deadline driving the sale (1031 exchange, divorce, estate, relocation)? That informs how much negotiation room exists.
- Schools are B-rated — typically a magnet for longer-tenancy family renters. What's the average tenant stay here, and is there a school-zone premium baked into asking?
- The area grade is low — what's the realistic commute time and amenity access for the typical tenant pool here? Any planned neighborhood developments (good or bad) we should know about?
- What's the average days-on-market for RENTAL listings here right now (not sales)? A rising rental-DOM trend means longer vacancies and softer asking-rent achievability than the comps imply.
- What's the recent tenant-quality profile in this submarket — average credit score on applications, eviction rate, late-payment / NSF rate, and stable-employment percentage? A property-management company in the area should have these aggregated.
- How much new for-sale + rental construction is in the pipeline within 1–3 miles? Heavy new supply typically softens prices + rents 12–24 months out; constrained supply supports both.
Investment metrics
- 1% rule
- 0.71% ✗
- Cap rate
- 5.46%
- Cash-on-cash
- -2.98%
- DSCR
- 0.87
- GRM
- 11.8
CMA / ARV
No comps found within radius.
Projected returns pro-forma
-3.0% appreciation · 1.64% rent growth · sell at horizon
- IRR
- -22.7%
- Equity multiple
- 0.23×
- Total profit
- $-75,632
- Equity at exit
- $52,185
- IRR
- -20.5%
- Equity multiple
- -0.02×
- Total profit
- $-99,517
- Equity at exit
- $30,261
Cash invested: $97,997 (down + closing). Projections, not guarantees.
Landlord ↔ Tenant lean methodology
- Overall (STATE)
- 87 Strongly Landlord-Friendly
- State Florida
- 87 Strongly Landlord-Friendly · R+3
- County
- — inherits STATE
- City
- — inherits STATE
ZIP-level market 32174
- Rents YoY
- 1.6%
- Active inventory
- 989
- Price-to-rent
- 11.8×
Monthly cashflow live
- Estimated rent
- $2,469 medium interval (Pro) →
- Mortgage (P&I)
- −$1,835
- Tax from tax record
- −$157 /mo · $1,888/yr
- Insurance
- −$146
- HOA
- −$55
- Vacancy / Maint / Mgmt
- −$518
- Net cashflow
- $-243
Break-even live
Sensitivity live
| Price | -10% $-45 | -5% $-144 | +0% $-243 | +5% $-342 | +10% $-441 |
|---|---|---|---|---|---|
| Rent | -10% $-438 | -5% $-341 | +0% $-243 | +5% $-146 | +10% $-48 |
| Rate | -1.0pp $-67 | -0.5pp $-154 | base $-243 | +0.5pp $-334 | +1.0pp $-426 |
UW: 25.0% down · 7.5% · 30yr · 1.5% tax · 5.0% vac · 8.0% maint · 8.0% mgmt
Financing live
Cash to close
- Down payment
- $87,498
- Closing costs
- $10,500
- Reserves months
- —
- Total cash needed
- —
Loan-product check · same deal, 3 products live
Conventional
25% down · 7.5% · 30yr
- Down + closing
- —
- Monthly P&I
- —
- Monthly cashflow
- —
- DSCR
- —
- Eligible?
- —
Personal DTI + credit; lowest rate.
DSCR
20% down · 8.5% · 30yr
- Down + closing
- —
- Monthly P&I
- —
- Monthly cashflow
- —
- DSCR
- —
- Eligible?
- —
No personal income docs; deal must DSCR.
Hard money
10% down · 12.0% · 12mo
- Down + closing
- —
- Monthly P&I
- —
- Monthly cashflow
- —
- DSCR
- —
- Eligible?
- —
Short-term bridge; refi at stabilization.
HOA detail
- Monthly dues
- $55 · $660/yr
Listing history 23 events
-
2026-06-21days on market $349,990 Active 79 DOM
-
2026-06-18days on market $349,990 Active 76 DOM
-
2026-06-17price $349,990 Active 75 DOM
-
2026-06-17days on market $358,990 Active 75 DOM
-
2026-06-16days on market $358,990 Active 74 DOM
-
2026-06-15days on market $358,990 Active 73 DOM
-
2026-06-14days on market $358,990 Active 71 DOM
-
2026-06-13days on market $358,990 Active 70 DOM
-
2026-06-10days on market $358,990 Active 68 DOM
-
2026-06-09days on market $358,990 Active 67 DOM
-
2026-06-08days on market $358,990 Active 66 DOM
-
2026-06-07days on market $358,990 Active 65 DOM
-
2026-06-03days on market $358,990 Active 61 DOM
-
2026-06-02days on market $358,990 Active 60 DOM
-
2026-06-01days on market $358,990 Active 59 DOM
-
2026-05-31days on market $358,990 Active 58 DOM
-
2026-05-12price $361,990
Show marketing remark (240 chars)
The property is located at 130 Heirloom Drive ORMOND BEACH FL 32174 priced at 361990, the square foot and stories are 1708, 1.The number of bath is 2, halfbath is 0 there are 5 bedrooms and 2 garages. For more details please, call or email.
-
2026-05-12price $361,990 240-char remark
Show marketing remark (240 chars)
The property is located at 130 Heirloom Drive ORMOND BEACH FL 32174 priced at 361990, the square foot and stories are 1708, 1.The number of bath is 2, halfbath is 0 there are 5 bedrooms and 2 garages. For more details please, call or email.
-
2026-05-01price $359,990 240-char remark
Show marketing remark (240 chars)
The property is located at 130 Heirloom Drive ORMOND BEACH FL 32174 priced at 361990, the square foot and stories are 1708, 1.The number of bath is 2, halfbath is 0 there are 5 bedrooms and 2 garages. For more details please, call or email.
-
2026-04-30price $359,990
-
2026-04-16$363,990 Active 240-char remark
Show marketing remark (240 chars)
The property is located at 130 Heirloom Drive ORMOND BEACH FL 32174 priced at 361990, the square foot and stories are 1708, 1.The number of bath is 2, halfbath is 0 there are 5 bedrooms and 2 garages. For more details please, call or email.
-
2026-04-03$363,990 Active
-
2025-01-24soldstatus $4,171,200
ⓘ Source: listings_history table (triggers on properties + properties_extension) + one-shot
backfill from property_details.listing_events for pre-trigger history.
Tax reassessment forecast FL · Resets to sale price
- Current annual tax
- $1,888 · $157/mo
- Projected year-2 tax
- $2,905 · $242/mo
- Expected delta
- +$1,017/yr (+$85/mo · 53.9%)
ⓘ Screening estimate from a state-policy table — verify with the county assessor before closing.
Nearby sold comps map
Loading sold comps map…
Walkable amenities ~0.75 mi
Loading nearby amenities…
Taxation est. · year 1
- Rental income
- $29,627
- − Mortgage interest
- −$19,605
- − Property taxes
- −$1,888
- − Insurance
- −$1,750
- − Repairs & maintenance
- −$2,370
- − Management
- −$2,370
- − HOA
- −$660
- − Depreciation
- −$10,182
- Taxable loss
- −$9,198
- Est. tax savings @ 24.0%
- +$2,207
- After-tax cash flow
- $-710/yr
For passive investors: Depreciation is non-cash, so a rental often shows a tax loss while cash-flowing — sheltering income. Rental losses are passive: they offset passive income freely, and up to $25,000/yr can offset ordinary (W-2) income if you actively participate and your MAGI is under $100k (phasing out to $0 by $150k); unused losses carry forward. On sale, claimed depreciation is recaptured at up to 25%, and gains may owe capital-gains tax (a 1031 exchange can defer both). Figures are a year-1 estimate at your 24.0% rate — not tax advice; consult a CPA.
Schools (NCES district)
- District
- Flagler
- NCES district ID
- 1200540
- Math proficiency
- 53% ▼ -9.00%
- Reading proficiency
- 56% ▼ -4.00%
- Median HH income
- $48,354
- Composite
- 46.35/100
- National rank
- #2464
- State rank
- #20 of 73 in FL
Livability — Ormond Beach
- Score
- 83/100
- State rank
- #55
- US rank
- #965
Category grades
Schools grade is shown separately in the Schools card above.
Census & demographics
- County
- Volusia County · 556,871 people
- City population
- 69,624
- Metro
- Deltona-Daytona Beach-Ormond Beach, FL
- Population (ZIP)
- 54,783
- Household income
- $71,011
- Rent vs Own
- Severe rent burden
- 1158.0
Population outlook (Flagler County) Hauer SSP2
- Today (2025)
- 123,474 people
- By 2030
- 131,864 · +6.8%
- By 2040
- 146,176 · +18.4%
- By 2050
- 157,398 · +27.5%
- By 2075
- 177,990 · +44.2%
- By 2100
- 183,381 · +48.5%
Race, ethnicity, and origin ACS 2023
- Neighborhood character
- Predominantly White (82%)
- Race & ethnicity
- White 82% Black 6% Hispanic / Latino 5% Two or more races 5% Asian 3%
- Hispanic origin (detail)
- Puerto Rican 2%
- Common ancestry
- Romanian 4% Lithuanian 3% Slovak 3%
- Foreign-born
- 7% · Canada, China
- Languages at home
- 91% English-only · Spanish 3% Other Indo-European 1% German/W. Germanic 1%
Political lean MEDSL · Flagler
- 2024 margin
- Strong R (+28.2) · D 35.6% · R 63.8%
- 2008→2024 swing
- -29.8pp toward R · 2008: 1.6pp · 2024: -28.2pp
- All cycles
- 2024: R+28.2 2020: R+20.8 2016: R+20.6 2012: R+7.4 2008: D+1.6
Not yet ingested
- Civics
- —
Market trends
- HPI YoY
- ▼ -327.97%
- Current HPI
- 271.92
- Rent YoY
- ▲ 1.64%
- Metro
- Deltona-Daytona Beach-Ormond Beach, FL
- State GDP YoY
- ▲ 3.28%
- F500 in state
- 36
Industry mix (Fortune 500 HQ in FL)
| Industry | F500 HQs | Revenue |
|---|---|---|
| Industrial Technology | 2 | $29B |
|
||
| Insurance | 2 | $17B |
|
||
| Retail | 1 | $60B |
|
||
| Technology Distribution | 1 | $58B |
|
||
| Homebuilding | 1 | $35B |
|
||
| Technology Manufacturing | 1 | $35B |
|
||
Price history
-91.3% since first listed7 events — show timeline
- 2026-05-12 Price Changed $361,990 Daytona MLS
- 2026-05-12 Price Changed $361,990 Zillow
- 2026-05-01 Price Changed $359,990 Zillow
- 2026-04-30 Price Changed $359,990 Daytona MLS
- 2026-04-16 Listed $363,990 Zillow
- 2026-04-03 Listed $363,990 Daytona MLS
- 2025-01-24 Sold (Public Records) $4,171,200 Public Records
Property tax history
+76.9%/yrLatest (2025): $1,888 · +76.9% YoY. Source: county tax records.
Cash-flow waterfall
monthlySold comps — $/sqft
last 12 mo · ≤1 miLoading sold comps…