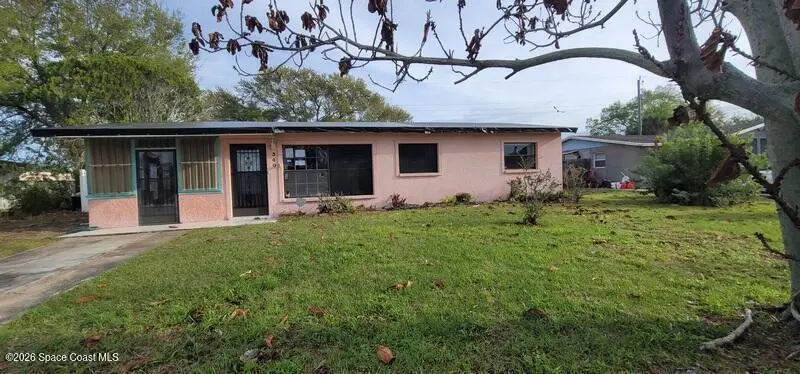
340 Fisher Ln · Tropical Park, FL
Flood risk 4/10 · Minor
- FEMA flood zone
- X (unshaded)
- Chance of flooding over 30 yrs
- 0.22%
- Est. flood insurance / yr
- $507 – $1,088
Fire risk 2/10 · Minimal
- Est. fire insurance / yr
- $947 – $1,759
Heat risk 10/10 · Severe
- Hot days now (above 106°F)
- 7 days/yr
- Hot days in 30 yrs
- 23 days/yr
Wind risk 10/10 · Severe
- Chance of severe wind over 30 yrs
- 99.0%
Air-quality risk 1/10 · Minimal
- Unhealthy air days now
- 0 days/yr
- Unhealthy air days in 30 yrs
- 0 days/yr
Risk factors via First Street. Map © Google.
Why this score? — see what drove the B- grade
The composite is a weighted blend of 9 inputs, each scored 0–100. Each bar is that input's sub-score; the figure is the points it added to the 100-point composite (weight × sub-score).
- Cash flow +30.0/30.0
- DSCR +10.0/10.0
- 1% rule +8.6/10.0
- ARV discount +7.5/15.0
- Schools +4.7/10.0
- Rent growth +3.0/5.0
- Livability +2.5/5.0
- Condition / age +2.5/5.0
- Appreciation +0.0/10.0
$120,000
🖨 Deal sheet (PDF) 📄 Offer letter ✓ Due diligence
Listing remarks
Many financing options available ! Located on a limited access street close to amenities with enclosed porch and spacious private fenced backyard . Priced to sell . Have a look today and start packing ! Room sizes estimated . Multi offers exist . Please submit highest and best offer prior to expiration 4pm est 04/09/2026 . Multi offers exist . Please submit highest and best offer by 5pm est Tues 04/21/2026 .
Key facts
- Enclosed porch
- 7,405 sq ft lot
- Built 1963
Tags
Property features AI
Finance
- Financial info: Annual tax information reported
Exterior
- Parking: Off-street parking
- Utilities: Public sewer; Electricity available; Sewer available; Water available
- Home design: Single family residence; One story; Residential use
- Construction: Block and concrete construction; Other construction materials noted; Building area reported (1,464 total; living area 1,224); Additional parcel referenced
- Exterior features: Covered rear and side porches; Privacy vinyl fencing; Shingle roof; Property faces north; Located on a dead-end county road with paved frontage
Interior
- Kitchen: No appliances included
- Bedrooms: Three bedrooms (all on the main level)
- Bathrooms: Two bathrooms (one full, one half)
- Heating & cooling: Central heating (electric); Central air conditioning (electric)
- Interior features: Seven total rooms; Other interior features
- Laundry & utility: Unfurnished (no built-in appliances listed)
Neighborhood map
What this means for you Summary
Snapshot
- This is a 2-bed/1.0-bath single-family listed at $120k.
Deal economics
- At list price, monthly cash flow is $461 ($6k/yr) — positive.
- The deal already cash-flows at list — no discount required.
- Meets the 1% rule at list price ($2k rent vs $120k).
- Recommended offer: $116k (3.0% below list) — sets the bar for market timing.
Location & tenants
- Location reads: area grade B — affects rentability + tenant quality, not the cash-flow math above.
- Brevard (suburban): math 53% / reading 57% proficiency, ranked #19 of 73 in FL (top 26%) — acceptable for families but not a draw, mixed tenant base, ~2y average lease.
- Zoned schools: Mila Elementary School (math 37% / reading 46%, grade F, #1,437 of 2,144 statewide, top 68%, 433 students, 70% FRL); Thomas Jefferson Middle School (math 63% / reading 55%, grade B, #144 of 571 statewide, top 26%, 608 students, 43% FRL); Merritt Island High School (math 32% / reading 55%, grade F, #248 of 667 statewide, top 38%, 1,546 students, 35% FRL).
- Market conditions: Rents rising (+2.1%/yr); 221 active listings in the ZIP; 7 comparable units currently listed for rent nearby; rentals at typical pace (median 26d on market — plan ~3-4 weeks tenant-placement turnaround); solid renter incomes; 4,602 units permitted in Brevard County in 2024 (702 in 5+ unit buildings).
Forward outlook
- Local home prices are declining (-3.0%/yr); year-one equity from $830 of loan paydown is wiped out by about $4k of value loss. Plan a longer hold.
- Brevard County population projected at +15% by 2050 — modest demand growth; plan on rents tracking national, not racing it.
- At projected returns (-3.0% appreciation + 2.1% rent growth), your $34k cash investment doubles in ~8 years — after that, you're playing with house money.
Negotiation context
- It's been on market 43 days — a 3% lower offer ($116k) is reasonable based on typical stale-listing flexibility.
- 2 sale attempts with the ask held roughly flat each time — persistent listings suggest the price (not the market) is what's stuck; bring a comps-based counter.
Risks & watch-outs
- Climate carrying-cost: severe wind risk, 99% chance of damaging wind over 30y; extreme-heat days projected 7→23/yr by 2055 (HVAC capex compounding) — expect insurance premiums to compound above CPI over the hold.
Questions for the listing agent
- It's been on market 43 days. Have you received any prior offers? Is the seller open to a 3% concession, seller financing, or rate buy-down credit?
- Built in 1963 — when were the roof, HVAC, electrical panel, plumbing, and water heater last replaced?
- Is there a deadline driving the sale (1031 exchange, divorce, estate, relocation)? That informs how much negotiation room exists.
- What's the average days-on-market for RENTAL listings here right now (not sales)? A rising rental-DOM trend means longer vacancies and softer asking-rent achievability than the comps imply.
- What's the recent tenant-quality profile in this submarket — average credit score on applications, eviction rate, late-payment / NSF rate, and stable-employment percentage? A property-management company in the area should have these aggregated.
- How much new for-sale + rental construction is in the pipeline within 1–3 miles? Heavy new supply typically softens prices + rents 12–24 months out; constrained supply supports both.
Investment metrics
- 1% rule
- 1.36% ✓
- Cap rate
- 10.90%
- Cash-on-cash
- 16.46%
- DSCR
- 1.73
- GRM
- 6.1
CMA / ARV
No comps found within radius.
Projected returns pro-forma
-3.0% appreciation · 2.12% rent growth · sell at horizon
- IRR
- 6.6%
- Equity multiple
- 1.25×
- Total profit
- $8,511
- Equity at exit
- $17,892
- IRR
- 15.1%
- Equity multiple
- 2.18×
- Total profit
- $39,549
- Equity at exit
- $10,375
Cash invested: $33,600 (down + closing). Projections, not guarantees.
Landlord ↔ Tenant lean methodology
- Overall (STATE)
- 87 Strongly Landlord-Friendly
- State Florida
- 87 Strongly Landlord-Friendly · R+3
- County
- — inherits STATE
- City
- — inherits STATE
ZIP-level market 32953
- Home prices YoY
- -34.5%
- Rents YoY
- 2.1%
- Active inventory
- 221
- Price-to-rent
- 6.1×
Monthly cashflow live
- Estimated rent
- $1,627 high interval (Pro) →
- Mortgage (P&I)
- −$629
- Tax from tax record
- −$145 /mo · $1,743/yr
- Insurance
- −$50
- HOA
- −$0
- Vacancy / Maint / Mgmt
- −$342
- Net cashflow
- $461
Break-even live
Sensitivity live
| Price | -10% $529 | -5% $495 | +0% $461 | +5% $427 | +10% $393 |
|---|---|---|---|---|---|
| Rent | -10% $332 | -5% $397 | +0% $461 | +5% $525 | +10% $590 |
| Rate | -1.0pp $521 | -0.5pp $492 | base $461 | +0.5pp $430 | +1.0pp $398 |
UW: 25.0% down · 7.5% · 30yr · 1.5% tax · 5.0% vac · 8.0% maint · 8.0% mgmt
Financing live
Cash to close
- Down payment
- $30,000
- Closing costs
- $3,600
- Reserves months
- —
- Total cash needed
- —
Loan-product check · same deal, 3 products live
Conventional
25% down · 7.5% · 30yr
- Down + closing
- —
- Monthly P&I
- —
- Monthly cashflow
- —
- DSCR
- —
- Eligible?
- —
Personal DTI + credit; lowest rate.
DSCR
20% down · 8.5% · 30yr
- Down + closing
- —
- Monthly P&I
- —
- Monthly cashflow
- —
- DSCR
- —
- Eligible?
- —
No personal income docs; deal must DSCR.
Hard money
10% down · 12.0% · 12mo
- Down + closing
- —
- Monthly P&I
- —
- Monthly cashflow
- —
- DSCR
- —
- Eligible?
- —
Short-term bridge; refi at stabilization.
Rent comps 7 comps
| Address | Beds | Baths | Sqft | Rent | $/sqft | DOM | Units | Dist |
|---|---|---|---|---|---|---|---|---|
| 360 Schoolhouse Ln Merritt Island, FL | 3.0 | 2.0 | 953 | $1,500 | $1.57 | 25d | 1 | 0.07mi |
| 1155 N Courtenay Pkwy Merritt Island, FL | 2.0 | 1.0 | 750 | $1,434 | $1.91 | 25d | 1 | 0.69mi |
| 225 Ligustrum Ln Merritt Island, FL | 1.0–2.0 | 1.0 | 640 | $1,275 | $1.99 | 21d | 1 | 0.80mi |
| 100 Summer Pl #8 Merritt Island, FL | 2.0 | 2.0 | 1037 | $2,500 | $2.41 | 25d | 1 | 1.03mi |
| 2610 Via Napoli Ct Merritt Island, FL | 3.0 | 2.0 | 1123 | $2,400 | $2.14 | 16d | 1 | 1.21mi |
| 630 Kurek Ct Merritt Island, FL | 1.0 | 1.0 | 475 | $1,199 | $2.52 | 25d | 1 | 1.35mi |
| 140 Minna Ln Merritt Island, FL | 2.0 | 1.0 | 775 | $1,250 | $1.61 | 16d | 1 | 1.38mi |
Listing history 6 events
-
2026-04-30status Pending
-
2026-04-24historical Active Under Contract
-
2026-03-17$120,000 Active
-
2026-01-27status Pending
-
2026-01-27$100,000 Active
-
2026-01-27historical
ⓘ Source: listings_history table (triggers on properties + properties_extension) + one-shot
backfill from property_details.listing_events for pre-trigger history.
Tax reassessment forecast FL · Resets to sale price
- Current annual tax
- $1,743 · $145/mo
- Projected year-2 tax
- $1,743 · $145/mo
- Expected delta
- $0/yr ($0/mo · 0.0%)
ⓘ Screening estimate from a state-policy table — verify with the county assessor before closing.
Climate risk First Street
- Flood 4/10 Moderate FEMA zone X (unshaded) · 22% chance over 30 yrs
- Wildfire 2/10 Low
- Heat 10/10 Extreme 7 d/yr ≥106°F today · 23 d/yr by 30 yrs out
- Wind 10/10 Extreme 99% chance of damaging wind over 30 yrs
- Air quality 1/10 Low 0 unhealthy d/yr today · 0 by 30 yrs out
Nearby sold comps map
Loading sold comps map…
Walkable amenities ~0.75 mi
Loading nearby amenities…
Taxation est. · year 1
- Rental income
- $19,527
- − Mortgage interest
- −$6,722
- − Property taxes
- −$1,743
- − Insurance
- −$600
- − Repairs & maintenance
- −$1,562
- − Management
- −$1,562
- − Depreciation
- −$3,491
- Taxable income
- $3,847
- Est. tax owed @ 24.0%
- −$923
- After-tax cash flow
- $4,609/yr
For passive investors: Depreciation is non-cash, so a rental often shows a tax loss while cash-flowing — sheltering income. Rental losses are passive: they offset passive income freely, and up to $25,000/yr can offset ordinary (W-2) income if you actively participate and your MAGI is under $100k (phasing out to $0 by $150k); unused losses carry forward. On sale, claimed depreciation is recaptured at up to 25%, and gains may owe capital-gains tax (a 1031 exchange can defer both). Figures are a year-1 estimate at your 24.0% rate — not tax advice; consult a CPA.
Schools (NCES district)
- District
- Brevard
- NCES district ID
- 1200150
- Math proficiency
- 53% ▼ -9.00%
- Reading proficiency
- 57% ▼ -4.00%
- Median HH income
- $49,426
- Composite
- 46.86/100
- National rank
- #2370
- State rank
- #19 of 73 in FL
Livability — Tropical Park
No livability data for this city. (Only ~50 U.S. cities are tracked.)
Census & demographics
- Census place
- Tropical Park, FL
- County
- Brevard County · 602,871 people
- Metro
- Palm Bay-Melbourne-Titusville, FL
- Population (ZIP)
- 24,759
- Household income
- $87,262
- Rent vs Own
- Severe rent burden
- 849.0
Population outlook (Brevard County) Hauer SSP2
- Today (2025)
- 623,254 people
- By 2030
- 648,420 · +4.0%
- By 2040
- 690,009 · +10.7%
- By 2050
- 715,669 · +14.8%
- By 2075
- 775,744 · +24.5%
- By 2100
- 776,687 · +24.6%
Race, ethnicity, and origin ACS 2023
- Neighborhood character
- Predominantly White (77%)
- Race & ethnicity
- White 77% Hispanic / Latino 13% Two or more races 7% Black 4% Asian 3%
- Hispanic origin (detail)
- Mexican 2% Puerto Rican 6%
- Common ancestry
- Slovak 3% Romanian 3% Lithuanian 3%
- Foreign-born
- 9% · Canada, China, Jamaica
- Languages at home
- 87% English-only · Spanish 8% Tagalog/Filipino 2% French/Haitian/Cajun 1%
Political lean MEDSL · Brevard
- 2024 margin
- Strong R (+20.8) · D 39.1% · R 59.9% · Other 1.0%
- 2008→2024 swing
- -10.4pp toward R · 2008: -10.4pp · 2024: -20.8pp
- All cycles
- 2024: R+20.8 2020: R+16.4 2016: R+19.8 2012: R+12.7 2008: R+10.4
Not yet ingested
- Civics
- —
Market trends
- HPI YoY
- ▼ -168.76%
- Current HPI
- 320.1966
- Rent YoY
- ▲ 2.12%
- Metro
- Palm Bay-Melbourne-Titusville, FL
- State GDP YoY
- ▲ 3.28%
- F500 in state
- 36
Industry mix (Fortune 500 HQ in FL)
| Industry | F500 HQs | Revenue |
|---|---|---|
| Industrial Technology | 2 | $29B |
|
||
| Insurance | 2 | $17B |
|
||
| Retail | 1 | $60B |
|
||
| Technology Distribution | 1 | $58B |
|
||
| Homebuilding | 1 | $35B |
|
||
| Technology Manufacturing | 1 | $35B |
|
||
Price history
+20.0% since first listed6 events — show timeline
- 2026-04-30 Pending — SCMLS
- 2026-04-24 Contingent — SCMLS
- 2026-03-17 Listed $120,000 SCMLS
- 2026-01-27 Pending — Stellar MLS as Distributed by MLS Grid
- 2026-01-27 Listing Removed — Stellar MLS as Distributed by MLS Grid
- 2026-01-27 Listed $100,000 Stellar MLS as Distributed by MLS Grid
Property tax history
+13.7%/yrLatest (2025): $1,743 · -0.2% YoY. Source: county tax records.
Cash-flow waterfall
monthlySold comps — $/sqft
last 12 mo · ≤1 miLoading sold comps…