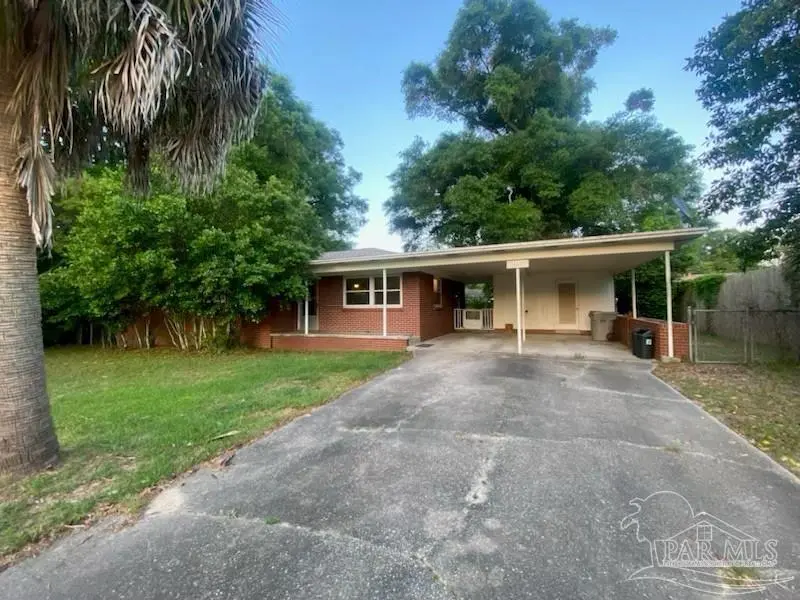
310 N 58th Ave · Myrtle Grove, FL
Flood risk 4/10 · Minor
- FEMA flood zone
- X (unshaded)
- Chance of flooding over 30 yrs
- 0.22%
- Est. flood insurance / yr
- $507 – $1,088
Fire risk 1/10 · Minimal
- Est. fire insurance / yr
- $947 – $1,759
Heat risk 10/10 · Severe
- Hot days now (above 105°F)
- 7 days/yr
- Hot days in 30 yrs
- 23 days/yr
Wind risk 9/10 · Severe
- Chance of severe wind over 30 yrs
- 99.0%
Air-quality risk 1/10 · Minimal
- Unhealthy air days now
- 0 days/yr
- Unhealthy air days in 30 yrs
- 0 days/yr
Risk factors via First Street. Map © Google.
Why this score? — see what drove the D grade
The composite is a weighted blend of 9 inputs, each scored 0–100. Each bar is that input's sub-score; the figure is the points it added to the 100-point composite (weight × sub-score).
- Cash flow +13.6/30.0
- ARV discount +8.5/15.0
- DSCR +4.1/10.0
- Schools +3.6/10.0
- Rent growth +3.5/5.0
- 1% rule +3.4/10.0
- Livability +3.2/5.0
- Condition / age +2.5/5.0
- Appreciation +0.0/10.0
$185,700
🖨 Deal sheet (PDF) 📄 Offer letter ✓ Due diligence
Listing remarks
Welcome home to this charming all-brick ranch nestled on a quiet dead-end street — the perfect setting for families looking for space, comfort, and a place to make lasting memories. Featuring 3 bedrooms, 2 bathrooms, and a spacious two-car carport, this home offers a functional layout with plenty of room to grow. Step outside and enjoy the large backyard, ideal for kids to play, family gatherings, weekend cookouts, or creating your dream outdoor oasis. Inside, the home has been well cared for and offers the perfect opportunity for new owners to add their own personal style and modern touches over time. Whether you’re a first-time homebuyer, growing family, or someone looking for
Key facts
- All-brick ranch
- Large backyard
- Functional layout
Tags
Property features AI
Finance
- Other: County-maintained road; Lot size approximately 0.24 acres
- HOA & community: No homeowners association
Exterior
- Parking: 2 covered parking spaces; 2-car carport
- Utilities: Electric with circuit breakers; Septic tank sewer; Public water
- Home design: Single-story brick home; Off-grade foundation; Composition roof; Resale property; Not attached to another property; Homestead exempt (yes)
- Construction: Brick construction; Built on an off-grade foundation; Composition roof; One level
- Exterior features: Rain gutters; Porch; Back yard fencing; Cul-de-sac location; Public water
Interior
- Kitchen: Dishwasher; Refrigerator; Oven; Gas water heater; ENERGY STAR qualified dishwasher; ENERGY STAR qualified refrigerator; ENERGY STAR qualified appliances; ENERGY STAR qualified water heater
- Flooring: Hardwood; Tile; Vinyl
- Bathrooms: 2 full bathrooms
- Heating & cooling: Natural gas heating; Central air conditioning; Ceiling fans; ENERGY STAR qualified HVAC / wall or window units
- Interior features: Baseboards; Ceiling fans; ENERGY STAR qualified doors; Double-pane windows
Neighborhood map
What this means for you Summary
Snapshot
- This is a 3-bed/2.0-bath single-family listed at $186k.
Deal economics
- At list price, monthly cash flow is $10 ($122/yr) — positive.
- The deal already cash-flows at list — no discount required.
- To meet the 1% rule (rent ≥ 1% of price), the offer needs to be $156k (16.1% below list).
- Recommended offer: $156k (16.1% below list) — sets the bar for 1% rule.
- Cap rate 6.4% vs local median 5.1% in Myrtle Grove — meaningfully above typical; check what's discounted (condition, days-on-market, listing class) to confirm the premium yield is real.
Location & tenants
- Location reads 64/100 on livability (#701 in FL) — a middle-class / working-renter tenant base. Strengths: cost of living A+, housing A+, health & safety B+; Watch: schools D-, amenities F, commute F.
- Escambia (suburban): math 40% / reading 45% proficiency, ranked #56 of 73 in FL (top 77%) — families likely to look elsewhere, expect single-tenant / working-renter base with shorter leases.
- Market conditions: Rents rising (+3.9%/yr); 270 active listings in the ZIP; 13 comparable units currently listed for rent nearby; rentals at typical pace (median 25d on market — plan ~3-4 weeks tenant-placement turnaround); 1,479 units permitted in Escambia County in 2024 (0 in 5+ unit buildings).
Forward outlook
- Local home prices are declining (-3.0%/yr); year-one equity from $1k of loan paydown is wiped out by about $6k of value loss. Plan a longer hold.
- Escambia County population projected at +13% by 2050 — modest demand growth; plan on rents tracking national, not racing it.
Negotiation context
- It's been on market 22 days — a 2% lower offer ($183k) is reasonable based on typical stale-listing flexibility.
- 2 sale attempts since 19y ago with the ask held roughly flat each time — persistent listings suggest the price (not the market) is what's stuck; bring a comps-based counter.
- Current owner paid $44k; list at $186k implies a 323% gain — meaningful room to come down on a strong offer.
Risks & watch-outs
- Climate carrying-cost: severe wind risk, 99% chance of damaging wind over 30y; extreme-heat days projected 7→23/yr by 2055 (HVAC capex compounding) — expect insurance premiums to compound above CPI over the hold.
Questions for the listing agent
- Built in 1960 — when were the roof, HVAC, electrical panel, plumbing, and water heater last replaced?
- Is there a deadline driving the sale (1031 exchange, divorce, estate, relocation)? That informs how much negotiation room exists.
- Schools are D-rated, which usually means shorter tenancies and higher turnover. Who's the typical renter profile here, and what's been the actual vacancy rate?
- The area grade is low — what's the realistic commute time and amenity access for the typical tenant pool here? Any planned neighborhood developments (good or bad) we should know about?
- What's the average days-on-market for RENTAL listings here right now (not sales)? A rising rental-DOM trend means longer vacancies and softer asking-rent achievability than the comps imply.
- What's the recent tenant-quality profile in this submarket — average credit score on applications, eviction rate, late-payment / NSF rate, and stable-employment percentage? A property-management company in the area should have these aggregated.
- How much new for-sale + rental construction is in the pipeline within 1–3 miles? Heavy new supply typically softens prices + rents 12–24 months out; constrained supply supports both.
Investment metrics
- 1% rule
- 0.84% ✗
- Cap rate
- 6.36%
- Cash-on-cash
- 0.24%
- DSCR
- 1.01
- GRM
- 9.9
CMA / ARV
- ARV (on-the-fly)
- $189,800
- Comps found
- 12
Show comp detail 12 sales within ~0.75 mi
| Address | Dist | Beds/Ba | Sqft | Sold | Price | $/sf | Match |
|---|---|---|---|---|---|---|---|
| 6020 W Jackson St | 0.33mi | 3/2.5 | 1,320 (+2%) | 2mo | $156,000 | $118 | 79 |
| 5535 Mayfair Cir | 0.09mi | 3/1.0 | 1,421 (+9%) | 1mo | $165,000 | $116 | 75 |
| 6825 Malvern St | 0.65mi | 3/2.0 | 1,312 (+1%) | 0mo | $192,000 | $146 | 68 |
| 5236 W Jackson St | 0.47mi | 3/1.5 | 1,358 (+4%) | 3mo | $122,000 | $90 | 66 |
| 307 N 59th Ave | 0.12mi | 3/1.5 | 1,108 (-15%) | 2mo | $190,000 | $171 | 66 |
| 522 S Edgewood Cir | 0.52mi | 3/1.0 | 1,355 (+4%) | 1mo | $208,500 | $154 | 64 |
| 100 Teakwood Cir | 0.34mi | 3/2.0 | 1,150 (-12%) | 1mo | $155,000 | $135 | 64 |
| 15 Janet St | 0.42mi | 4/1.5 (+1) | 1,252 (-4%) | 5mo | $86,000 | $69 | 63 |
| 132 Elm St | 0.65mi | 2/1.0 (-1) | 1,336 (+3%) | 3mo | $170,000 | $127 | 54 |
| 6457 Myrtle Hill Cir | 0.42mi | 2/2.0 (-1) | 1,115 (-14%) | 3mo | $249,000 | $223 | 50 |
| 6875 Malvern St | 0.71mi | 3/1.0 | 1,161 (-11%) | 6mo | $174,000 | $150 | 40 |
| 249 Willow St | 0.65mi | 2/2.0 (-1) | 1,137 (-12%) | 5mo | $184,000 | $162 | 40 |
Match score weights: distance 35% · size 25% · config 20% · recency 20%. Top-matched comps best support the ARV.
Projected returns pro-forma
-3.0% appreciation · 3.85% rent growth · sell at horizon
- IRR
- -15.0%
- Equity multiple
- 0.46×
- Total profit
- $-28,112
- Equity at exit
- $27,688
- IRR
- -5.1%
- Equity multiple
- 0.65×
- Total profit
- $-18,089
- Equity at exit
- $16,056
Cash invested: $51,996 (down + closing). Projections, not guarantees.
Landlord ↔ Tenant lean methodology
- Overall (STATE)
- 87 Strongly Landlord-Friendly
- State Florida
- 87 Strongly Landlord-Friendly · R+3
- County
- — inherits STATE
- City
- — inherits STATE
ZIP-level market 32506
- Home prices YoY
- -22.5%
- Rents YoY
- 3.9%
- Active inventory
- 270
- Price-to-rent
- 9.9×
Monthly cashflow live
- Estimated rent
- $1,559 high interval (Pro) →
- Mortgage (P&I)
- −$974
- Tax from tax record
- −$170 /mo · $2,041/yr
- Insurance
- −$77
- HOA
- −$0
- Vacancy / Maint / Mgmt
- −$327
- Net cashflow
- $10
Break-even live
Sensitivity live
| Price | -10% $115 | -5% $63 | +0% $10 | +5% $-42 | +10% $-95 |
|---|---|---|---|---|---|
| Rent | -10% $-113 | -5% $-51 | +0% $10 | +5% $72 | +10% $133 |
| Rate | -1.0pp $104 | -0.5pp $57 | base $10 | +0.5pp $-38 | +1.0pp $-87 |
UW: 25.0% down · 7.5% · 30yr · 1.5% tax · 5.0% vac · 8.0% maint · 8.0% mgmt
Financing live
Cash to close
- Down payment
- $46,425
- Closing costs
- $5,571
- Reserves months
- —
- Total cash needed
- —
Loan-product check · same deal, 3 products live
Conventional
25% down · 7.5% · 30yr
- Down + closing
- —
- Monthly P&I
- —
- Monthly cashflow
- —
- DSCR
- —
- Eligible?
- —
Personal DTI + credit; lowest rate.
DSCR
20% down · 8.5% · 30yr
- Down + closing
- —
- Monthly P&I
- —
- Monthly cashflow
- —
- DSCR
- —
- Eligible?
- —
No personal income docs; deal must DSCR.
Hard money
10% down · 12.0% · 12mo
- Down + closing
- —
- Monthly P&I
- —
- Monthly cashflow
- —
- DSCR
- —
- Eligible?
- —
Short-term bridge; refi at stabilization.
Rent comps 13 comps
| Address | Beds | Baths | Sqft | Rent | $/sqft | DOM | Units | Dist |
|---|---|---|---|---|---|---|---|---|
| 5501 Mayfair Dr Pensacola, FL | 3.0 | 1.0 | 912 | $1,295 | $1.42 | 24d | 1 | 0.33mi |
| 316 Teakwood Cir Pensacola, FL | 2.0 | 1.5 | 1024 | $1,350 | $1.32 | 14d | 1 | 0.43mi |
| 6700 Lake Charlene Dr Pensacola, FL | 4.0 | 2.5 | 1823 | $2,100 | $1.15 | 24d | 1 | 0.71mi |
| 4600 Twin Oaks Dr Pensacola, FL | 1.0–2.0 | 1.0 | 838 | $1,499 | $1.79 | 14d | 29 | 0.81mi |
| 346 Quigley Rd Pensacola, FL | 3.0 | 2.0 | 1021 | $1,500 | $1.47 | 24d | 1 | 1.09mi |
| 542 S 72nd Ave Unit C Pensacola, FL | 3.0 | 2.0 | 1300 | $1,400 | $1.08 | 24d | 1 | 1.13mi |
| 4519 Martha Ave Pensacola, FL | 3.0 | 1.0 | 1104 | $1,600 | $1.45 | 24d | 1 | 1.15mi |
| 7071 Lake Joanne Dr Unit 2C Pensacola, FL | 3.0 | 2.0 | 1300 | $1,400 | $1.08 | 14d | 1 | 1.16mi |
| 7071 Lake Joanne Dr Unit 2A Pensacola, FL | 3.0 | 2.0 | 1300 | $1,400 | $1.08 | 24d | 1 | 1.16mi |
| 585 S 72nd Ave Pensacola, FL | 1.0–2.0 | 1.0 | 862 | $1,300 | $1.51 | 24d | 3 | 1.16mi |
| 190 N Old Corry Field Rd Pensacola, FL | 1.0–2.0 | 1.0–2.0 | 915 | $1,174 | $1.28 | 14d | 3 | 1.20mi |
| 570 Quigley Rd Pensacola, FL | 3.0 | 2.0 | 1190 | $1,525 | $1.28 | 24d | 1 | 1.24mi |
| 101 Vanderbilt Rd Pensacola, FL | 3.0 | 2.0 | 1104 | $1,850 | $1.68 | 22d | 1 | 1.50mi |
Listing history 21 events
-
2026-06-18days on market $185,700 Active 22 DOM
-
2026-06-17days on market $185,700 Active 21 DOM
-
2026-06-16days on market $185,700 Active 20 DOM
-
2026-06-15days on market $185,700 Active 19 DOM
-
2026-06-14days on market $185,700 Active 17 DOM
-
2026-06-10days on market $185,700 Active 14 DOM
-
2026-06-09days on market $185,700 Active 13 DOM
-
2026-06-08days on market $185,700 Active 12 DOM
-
2026-06-07days on market $185,700 Active 11 DOM
-
2026-06-03days on market $185,700 Active 7 DOM
-
2026-06-02days on market $185,700 Active 6 DOM
-
2026-06-01days on market $185,700 Active 5 DOM
-
2026-05-31days on market $185,700 Active 4 DOM
-
2026-05-31days on market $185,700 Active 3 DOM
-
2026-05-27$185,700 Active
-
2007-12-30historical
-
2007-08-02$116,900
-
1996-08-29soldstatus $43,900
-
1992-10-01soldstatus $50,000
-
1983-07-01soldstatus $34,000
-
1976-01-01soldstatus $36,000
ⓘ Source: listings_history table (triggers on properties + properties_extension) + one-shot
backfill from property_details.listing_events for pre-trigger history.
Tax reassessment forecast FL · Resets to sale price
- Current annual tax
- $2,041 · $170/mo
- Projected year-2 tax
- $2,041 · $170/mo
- Expected delta
- $0/yr ($0/mo · 0.0%)
ⓘ Screening estimate from a state-policy table — verify with the county assessor before closing.
Climate risk First Street
- Flood 4/10 Moderate FEMA zone X (unshaded) · 22% chance over 30 yrs
- Wildfire 1/10 Low
- Heat 10/10 Extreme 7 d/yr ≥105°F today · 23 d/yr by 30 yrs out
- Wind 9/10 Extreme 99% chance of damaging wind over 30 yrs
- Air quality 1/10 Low 0 unhealthy d/yr today · 0 by 30 yrs out
Nearby sold comps map
Loading sold comps map…
Walkable amenities ~0.75 mi
Loading nearby amenities…
Taxation est. · year 1
- Rental income
- $18,706
- − Mortgage interest
- −$10,402
- − Property taxes
- −$2,041
- − Insurance
- −$928
- − Repairs & maintenance
- −$1,496
- − Management
- −$1,496
- − Depreciation
- −$5,402
- Taxable loss
- −$3,061
- Est. tax savings @ 24.0%
- +$735
- After-tax cash flow
- $857/yr
For passive investors: Depreciation is non-cash, so a rental often shows a tax loss while cash-flowing — sheltering income. Rental losses are passive: they offset passive income freely, and up to $25,000/yr can offset ordinary (W-2) income if you actively participate and your MAGI is under $100k (phasing out to $0 by $150k); unused losses carry forward. On sale, claimed depreciation is recaptured at up to 25%, and gains may owe capital-gains tax (a 1031 exchange can defer both). Figures are a year-1 estimate at your 24.0% rate — not tax advice; consult a CPA.
Schools (NCES district)
- District
- Escambia
- NCES district ID
- 1200510
- Math proficiency
- 40% ▼ -9.00%
- Reading proficiency
- 45% ▼ -4.00%
- Median HH income
- $44,649
- Composite
- 36.04/100
- National rank
- #4773
- State rank
- #56 of 73 in FL
Livability — Myrtle Grove
- Score
- 64/100
- State rank
- #701
- US rank
- #14805
Category grades
Schools grade is shown separately in the Schools card above.
Census & demographics
- Census place
- Myrtle Grove, FL
- County
- Escambia County · 301,722 people
- City population
- 1,170
- Metro
- Pensacola-Ferry Pass-Brent, FL
- Population (ZIP)
- 34,549
- Household income
- $62,486
- Rent vs Own
- Severe rent burden
- 1359.0
Population outlook (Escambia County) Hauer SSP2
- Today (2025)
- 334,637 people
- By 2030
- 345,779 · +3.3%
- By 2040
- 364,828 · +9.0%
- By 2050
- 378,514 · +13.1%
- By 2075
- 403,220 · +20.5%
- By 2100
- 386,125 · +15.4%
Race, ethnicity, and origin ACS 2023
- Neighborhood character
- Diverse neighborhood (Simpson 0.60)
- Race & ethnicity
- White 60% Black 18% Two or more races 11% Hispanic / Latino 6% Asian 6%
- Hispanic origin (detail)
- Mexican 3%
- Common ancestry
- Lithuanian 4% Slovak 2% Italian 2%
- Foreign-born
- 9% · Canada, China, Vietnam
- Languages at home
- 89% English-only · Spanish 4% Tagalog/Filipino 2% Other Indo-European 1%
Political lean MEDSL · Escambia
- 2024 margin
- R (+19.5) · D 39.7% · R 59.2% · Other 1.1%
- 2008→2024 swing
- -0.2pp no change · 2008: -19.3pp · 2024: -19.5pp
- All cycles
- 2024: R+19.5 2020: R+15.1 2016: R+20.6 2012: R+20.6 2008: R+19.3
Not yet ingested
- Civics
- —
Market trends
- HPI YoY
- ▼ -71.86%
- Current HPI
- 247.6085
- Rent YoY
- ▲ 3.85%
- Metro
- Pensacola-Ferry Pass-Brent, FL
- State GDP YoY
- ▲ 3.28%
- F500 in state
- 36
Industry mix (Fortune 500 HQ in FL)
| Industry | F500 HQs | Revenue |
|---|---|---|
| Industrial Technology | 2 | $29B |
|
||
| Insurance | 2 | $17B |
|
||
| Retail | 1 | $60B |
|
||
| Technology Distribution | 1 | $58B |
|
||
| Homebuilding | 1 | $35B |
|
||
| Technology Manufacturing | 1 | $35B |
|
||
Price history
+415.8% since first listed7 events — show timeline
- 2026-05-27 Listed $185,700 PARMLS
- 2007-12-30 Listing Removed — PARMLS
- 2007-08-02 Listed $116,900 PARMLS
- 1996-08-29 Sold (Public Records) $43,900 Public Records
- 1992-10-01 Sold (Public Records) $50,000 Public Records
- 1983-07-01 Sold (Public Records) $34,000 Public Records
- 1976-01-01 Sold (Public Records) $36,000 Public Records
Property tax history
+6.6%/yrLatest (2025): $2,041 · +15.6% YoY. Source: county tax records.
Cash-flow waterfall
monthlySold comps — $/sqft
last 12 mo · ≤1 miLoading sold comps…