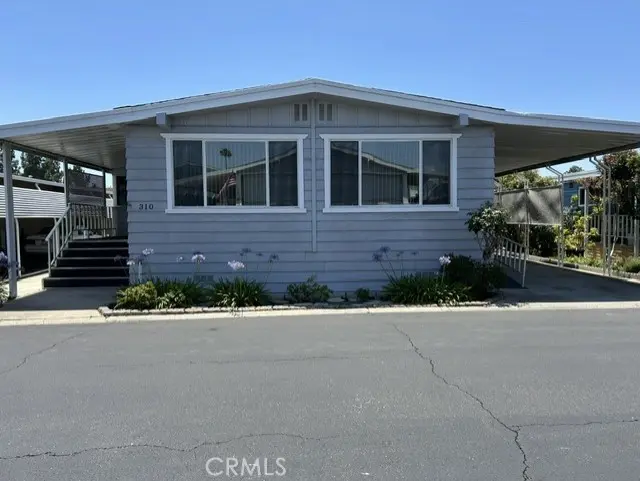
24001 Muirlands #310 · Lake Forest, CA
Flood risk 1/10 · Minimal
- FEMA flood zone
- X (unshaded)
- Chance of flooding over 30 yrs
- 0.0%
- Est. flood insurance / yr
- $507 – $1,088
Fire risk 1/10 · Minimal
- Est. fire insurance / yr
- $659 – $1,223
Heat risk 5/10 · Moderate
- Hot days now (above 91°F)
- 6 days/yr
- Hot days in 30 yrs
- 19 days/yr
Wind risk 1/10 · Minimal
- Chance of severe wind over 30 yrs
- —
Air-quality risk 4/10 · Minor
- Unhealthy air days now
- 4 days/yr
- Unhealthy air days in 30 yrs
- 5 days/yr
Risk factors via First Street. Map © Google.
Why this score? — see what drove the B+ grade
The composite is a weighted blend of 9 inputs, each scored 0–100. Each bar is that input's sub-score; the figure is the points it added to the 100-point composite (weight × sub-score).
- Cash flow +30.0/30.0
- ARV discount +15.0/15.0
- 1% rule +10.0/10.0
- DSCR +10.0/10.0
- Schools +5.6/10.0
- Livability +3.2/5.0
- Rent growth +3.1/5.0
- Condition / age +2.5/5.0
- Appreciation +0.0/10.0
$230,000
🖨 Deal sheet 📄 Offer letter ✓ Due diligence
Listing remarks
This is a beautifully remodeled home with 2 bedrooms and 2 bathrooms Double wide with an extended addition. The owners added a 7.5' by 23' 8" room attached to the family room. The room addition could be used as an office or a den area. The mobile home is in a senior park 55+ and has security gates that close in every night. The community of Forest Gardens has community pool, spa, billiard's room, club house and a lake. The living room, open to dining room please note the crown molding and the low pile carpet that a wheelchair could easily move across. There is a built-in chine cabinet in the dining room area. The family room also has crown molding and low pile carpet as well as built i
Key facts
- Extended addition
- Community pool
- Community spa
Tags
Property features AI
Finance
- Other: Park name: Forest Gardens; Living area source: public records; Mobile home dimensions: 24 by 60; Number of sheds: 1; Directions available
- Financial info: Land lease arrangement
- HOA & community: Senior community; Association amenities: pool, clubhouse, spa; Community features: curbs, biking, park; Land lease ($1,295 monthly); Manager approval required
Exterior
- Parking: Attached carport for 2 cars; Has parking
- Security: Automatic gate
- Utilities: Natural gas connected; Sewer connected (public sewer); Cable connected; Telephone on property
- Home design: Mobile home (24' x 60') remains on site; Double body type; One story; Entry at front door
- Construction: Aluminum exterior construction
- Exterior features: Covered front porch; Patio; Garden; Shed (1); Aluminum skirting
Interior
- Kitchen: Remodeled kitchen; Kitchen open to family room; Free standing range; Gas & electric range; Water line to refrigerator; Ice maker; Refrigerator; Garbage disposal; Dishwasher; Microwave
- Bedrooms: Primary bedroom on main floor; All bedrooms on main floor; Main floor bedroom(s)
- Flooring: Vinyl flooring; Carpet
- Bathrooms: Two 3/4 bathrooms; Upgraded and remodeled bathrooms; Walk-in shower; Shower; Granite counters in bathrooms
- Heating & cooling: Forced air heating; Central gas cooling
- Interior features: Ceiling fan; Storage space; Formica counters; Granite counters; Blinds; Automatic gate; Front door entry; One level (single story); Turnkey condition; Additions/alterations; Ramp to main level; Has spa (association, in-ground, heated)
- Laundry & utility: Individual laundry room; Washer hookup; Gas & electric dryer hookup; 220V in laundry
Neighborhood map
What this means for you Summary
Snapshot
- This is a 2-bed/2.0-bath manufactured listed at $230k.
Deal economics
- At list price, monthly cash flow is $2k ($21k/yr) — positive.
- The deal already cash-flows at list — no discount required.
- Meets the 1% rule at list price ($4k rent vs $230k).
- Cap rate 15.2% vs local median 2.1% in Lake Forest — top-decile yield for the area; either an underpriced asset or a hidden risk that comps aren't pricing in. Stress-test before assuming the spread holds.
Location & tenants
- Location reads 65/100 on livability (#387 in CA) — a middle-class / working-renter tenant base. Strengths: crime A+, employment A+, housing B; Watch: commute C-, amenities F, cost of living F.
- Saddleback Valley Unified (suburban): math 51% / reading 73% proficiency, ranked #67 of 517 in CA (top 13%) — acceptable for families but not a draw, mixed tenant base, ~2y average lease.
- Market conditions: Rents rising (+2.5%/yr); 205 active listings in the ZIP; 13 comparable units currently listed for rent nearby; rentals at typical pace (median 19d on market — plan ~3-4 weeks tenant-placement turnaround); high-income renter base; 6,974 units permitted in Orange County in 2024 (3,839 in 5+ unit buildings).
- This rent runs 40% of the median local income ($126k/yr) — at the standard rent-burdened threshold; future hikes will face affordability resistance.
Forward outlook
- Local home prices are declining (-3.0%/yr); year-one equity from $2k of loan paydown is wiped out by about $7k of value loss. Plan a longer hold.
- Orange County population projected at +14% by 2050 — modest demand growth; plan on rents tracking national, not racing it.
- At projected returns (-3.0% appreciation + 2.5% rent growth), your $64k cash investment doubles in ~4 years — after that, you're playing with house money.
Negotiation context
- Only 12 days on market — expect competitive offers; lowballing is unlikely to land.
Risks & watch-outs
- Climate carrying-cost: extreme-heat days projected 6→19/yr by 2055 (HVAC capex compounding) — expect insurance premiums to compound above CPI over the hold.
Questions for the listing agent
- Built in 1972 — when were the roof, HVAC, electrical panel, plumbing, and water heater last replaced?
- Is there a deadline driving the sale (1031 exchange, divorce, estate, relocation)? That informs how much negotiation room exists.
- Schools are B-rated — typically a magnet for longer-tenancy family renters. What's the average tenant stay here, and is there a school-zone premium baked into asking?
- What's the average days-on-market for RENTAL listings here right now (not sales)? A rising rental-DOM trend means longer vacancies and softer asking-rent achievability than the comps imply.
- What's the recent tenant-quality profile in this submarket — average credit score on applications, eviction rate, late-payment / NSF rate, and stable-employment percentage? A property-management company in the area should have these aggregated.
- How much new for-sale + rental construction is in the pipeline within 1–3 miles? Heavy new supply typically softens prices + rents 12–24 months out; constrained supply supports both.
Investment metrics
- 1% rule
- 1.82% ✓
- Cap rate
- 15.23%
- Cash-on-cash
- 31.92%
- DSCR
- 2.42
- GRM
- 4.6
CMA / ARV
- ARV (on-the-fly)
- $343,016
- Comps found
- 12
Show comp detail 12 sales within ~0.75 mi
| Address | Dist | Beds/Ba | Sqft | Sold | Price | $/sf | Match |
|---|---|---|---|---|---|---|---|
| 24001 Muirlands Blvd #62 | 0.00mi | 3/2.0 (+1) | 1,620 (+0%) | 8mo | $449,000 | $277 | 88 |
| 24001 Muirlands #352 | 0.00mi | 3/2.0 (+1) | 1,525 (-6%) | 2mo | $352,500 | $231 | 83 |
| 24001 Muirlands #11 | 0.00mi | 2/2.0 | 1,440 (-11%) | 2mo | $165,000 | $115 | 80 |
| 24001 Muirlands Blvd #147 | 0.00mi | 2/2.0 | 1,440 (-11%) | 3mo | $359,000 | $249 | 79 |
| 24001 Muirlands Blvd #315 | 0.05mi | 2/2.0 | 1,440 (-11%) | 2mo | $305,000 | $212 | 78 |
| 24001 Muirlands Blvd #221 | 0.00mi | 2/2.0 | 1,440 (-11%) | 5mo | $280,000 | $194 | 78 |
| 24001 Muirlands Blvd #329 | 0.00mi | 2/2.0 | 1,440 (-11%) | 5mo | $380,000 | $264 | 78 |
| 24001 Muirlands #47 | 0.00mi | 2/2.0 | 1,440 (-11%) | 6mo | $195,000 | $135 | 77 |
| 24001 Muirlands Blvd #347 | 0.00mi | 2/2.0 | 1,440 (-11%) | 6mo | $197,000 | $137 | 76 |
| 24001 Muirlands #185 | 0.00mi | 2/2.0 | 1,440 (-11%) | 7mo | $295,000 | $205 | 76 |
| 24001 Muirlands Dr #81 | 0.12mi | 2/2.0 | 1,488 (-8%) | 8mo | $230,000 | $155 | 74 |
| 24001 Muirlands Blvd #268 | 0.00mi | 3/2.0 (+1) | 1,420 (-12%) | 8mo | $335,000 | $236 | 68 |
Match score weights: distance 35% · size 25% · config 20% · recency 20%. Top-matched comps best support the ARV.
Projected returns pro-forma
-3.0% appreciation · 2.51% rent growth · sell at horizon
- IRR
- 26.3%
- Equity multiple
- 2.08×
- Total profit
- $69,855
- Equity at exit
- $34,294
- IRR
- 33.7%
- Equity multiple
- 4.00×
- Total profit
- $193,251
- Equity at exit
- $19,886
Cash invested: $64,400 (down + closing). Projections, not guarantees.
Landlord ↔ Tenant lean methodology
- Overall (STATE)
- 18 Strongly Tenant-Friendly
- State California
- 18 Strongly Tenant-Friendly · D+13
- County
- — inherits STATE
- City
- — inherits STATE
ZIP-level market 92630
- Rents YoY
- 2.5%
- Active inventory
- 205
- Price-to-rent
- 4.6×
Monthly cashflow live
- Estimated rent
- $4,181 high interval (Pro) →
- Mortgage (P&I)
- −$1,206
- Tax est. 1.5%
- −$288 /mo · $3,450/yr
- Insurance
- −$96
- HOA
- −$0
- Vacancy / Maint / Mgmt
- −$878
- Net cashflow
- $1,713
Break-even live
UW: 25.0% down · 7.5% · 30yr · 1.5% tax · 5.0% vac · 8.0% maint · 8.0% mgmt
Financing live
Cash to close
- Down payment
- $57,500
- Closing costs
- $6,900
- Reserves months
- —
- Total cash needed
- —
Loan-product check · same deal, 3 products live
Conventional
25% down · 7.5% · 30yr
- Down + closing
- —
- Monthly P&I
- —
- Monthly cashflow
- —
- DSCR
- —
- Eligible?
- —
Personal DTI + credit; lowest rate.
DSCR
20% down · 8.5% · 30yr
- Down + closing
- —
- Monthly P&I
- —
- Monthly cashflow
- —
- DSCR
- —
- Eligible?
- —
No personal income docs; deal must DSCR.
Hard money
10% down · 12.0% · 12mo
- Down + closing
- —
- Monthly P&I
- —
- Monthly cashflow
- —
- DSCR
- —
- Eligible?
- —
Short-term bridge; refi at stabilization.
Rent comps 13 comps
| Address | Beds | Baths | Sqft | Rent | $/sqft | DOM | Units | Dist |
|---|---|---|---|---|---|---|---|---|
| 24362 Woodwalk Rd Lake Forest, CA | 3.0 | 2.0 | 2047 | $4,795 | $2.34 | 12d | 1 | 0.33mi |
| 24362 Woodwalk Rd Lake Forest, CA | 3.0 | 2.5 | 2047 | $4,995 | $2.44 | 4d | 1 | 0.33mi |
| 22700 Lake Forest Dr Lake Forest, CA | 1.0–3.0 | 1.0–2.0 | 1008 | $3,248 | $3.22 | 4d | 1 | 0.39mi |
| 22602 Cottonwood Cir Lake Forest, CA | 3.0 | 2.0 | 1301 | $4,250 | $3.27 | 43d | 1 | 0.47mi |
| 22835 Islamare Ln Lake Forest, CA | 3.0 | 2.5 | 1860 | $6,600 | $3.55 | 12d | 1 | 0.56mi |
| 22892 Plainview Cir Lake Forest, CA | 3.0 | 2.0 | 1836 | $5,400 | $2.94 | 43d | 1 | 0.60mi |
| 24621 Overlake Dr Lake Forest, CA | 3.0 | 2.0 | 1677 | $4,350 | $2.59 | 24d | 1 | 0.75mi |
| 25092 Farthing St Lake Forest, CA | 1.0–2.0 | 1.0–2.0 | 881 | $3,303 | $3.75 | 3d | 5 | 1.27mi |
| 2369 Via Mariposa E Unit 3H Laguna Woods, CA | 3.0 | 3.0 | 1663 | $3,750 | $2.25 | 43d | 1 | 1.38mi |
| 2369 Via Mariposa E Unit 1B Laguna Woods, CA | 2.0 | 2.0 | 1340 | $2,950 | $2.20 | 43d | 1 | 1.38mi |
| 2370 Via Mariposa W Unit 3D Laguna Woods, CA | 3.0 | 3.0 | 1663 | $3,300 | $1.98 | 18d | 1 | 1.43mi |
| 2293 Via Puerta Unit O Laguna Woods, CA | 2.0 | 2.0 | 1057 | $3,100 | $2.93 | 18d | 1 | 1.48mi |
| 2269 Via Puerta Unit N Laguna Woods, CA | 2.0 | 2.0 | 1057 | $2,700 | $2.55 | 18d | 1 | 1.48mi |
Listing history 10 events
-
2026-06-18days on market $230,000 Active 12 DOM
-
2026-06-17days on market $230,000 Active 11 DOM
-
2026-06-16days on market $230,000 Active 10 DOM
-
2026-06-15days on market $230,000 Active 9 DOM
-
2026-06-13days on market $230,000 Active 7 DOM
-
2026-06-13days on market $230,000 Active 6 DOM
-
2026-06-09days on market $230,000 Active 3 DOM
-
2026-06-08days on market $230,000 Active 2 DOM
-
2026-06-07remarks 694-char remark
-
2026-06-07$230,000 Active 1 DOM
ⓘ Source: listings_history table (triggers on properties + properties_extension) + one-shot
backfill from property_details.listing_events for pre-trigger history.
Climate risk First Street
- Flood 1/10 Low FEMA zone X (unshaded) · 0% chance over 30 yrs
- Wildfire 1/10 Low
- Heat 5/10 Major 6 d/yr ≥91°F today · 19 d/yr by 30 yrs out
- Wind 1/10 Low
- Air quality 4/10 Moderate 4 unhealthy d/yr today · 5 by 30 yrs out
Nearby sold comps map
Loading sold comps map…
Walkable amenities ~0.75 mi
Loading nearby amenities…
Taxation est. · year 1
- Rental income
- $50,167
- − Mortgage interest
- −$12,884
- − Property taxes
- −$3,450
- − Insurance
- −$1,150
- − Repairs & maintenance
- −$4,013
- − Management
- −$4,013
- − Depreciation
- −$6,691
- Taxable income
- $17,966
- Est. tax owed @ 24.0%
- −$4,312
- After-tax cash flow
- $16,246/yr
For passive investors: Depreciation is non-cash, so a rental often shows a tax loss while cash-flowing — sheltering income. Rental losses are passive: they offset passive income freely, and up to $25,000/yr can offset ordinary (W-2) income if you actively participate and your MAGI is under $100k (phasing out to $0 by $150k); unused losses carry forward. On sale, claimed depreciation is recaptured at up to 25%, and gains may owe capital-gains tax (a 1031 exchange can defer both). Figures are a year-1 estimate at your 24.0% rate — not tax advice; consult a CPA.
Schools (NCES district)
- District
- Saddleback Valley Unified
- NCES district ID
- 0633860
- Math proficiency
- 51% ▼ -2.00%
- Reading proficiency
- 73% ▲ 9.00%
- Median HH income
- $85,577
- Composite
- 56.05/100
- National rank
- #1185
- State rank
- #67 of 517 in CA
Livability — Lake Forest
- Score
- 65/100
- State rank
- #387
- US rank
- #13130
Category grades
Schools grade is shown separately in the Schools card above.
Census & demographics
- Census place
- Lake Forest, CA
- County
- Orange County · 3,096,323 people
- City population
- 80,019
- Metro
- Los Angeles-Long Beach-Anaheim, CA
- Population (ZIP)
- 67,152
- Household income
- $125,853
- Rent vs Own
- Severe rent burden
- 2412.0
Population outlook (Orange County) Hauer SSP2
- Today (2025)
- 3,477,456 people
- By 2030
- 3,613,117 · +3.9%
- By 2040
- 3,835,945 · +10.3%
- By 2050
- 3,968,736 · +14.1%
- By 2075
- 4,097,053 · +17.8%
- By 2100
- 3,903,633 · +12.3%
Race, ethnicity, and origin ACS 2023
- Neighborhood character
- Diverse neighborhood (Simpson 0.67)
- Race & ethnicity
- White 47% Hispanic / Latino 27% Asian 19% Two or more races 16% Black 2% Native American 1%
- Hispanic origin (detail)
- Mexican 21%
- Common ancestry
- Slovak 2% Lithuanian 2% Romanian 2%
- Foreign-born
- 28% · Canada, China, Vietnam
- Languages at home
- 62% English-only · Spanish 18% Chinese 4% Other Indo-European 4%
Political lean MEDSL · Orange
- 2024 margin
- Toss-up / Even · D 49.7% · R 47.1% · Other 3.2%
- 2008→2024 swing
- +5.2pp toward D · 2008: -2.6pp · 2024: 2.6pp
- All cycles
- 2024: D+2.6 2020: D+9.0 2016: D+7.7 2012: R+8.3 2008: R+2.6
Not yet ingested
- Civics
- —
Market trends
- HPI YoY
- ▼ -866.99%
- Current HPI
- 436.6189
- Rent YoY
- ▲ 2.51%
- Metro
- Los Angeles-Long Beach-Anaheim, CA
- State GDP YoY
- ▲ 3.21%
- F500 in state
- 116
Industry mix (Fortune 500 HQ in CA)
| Industry | F500 HQs | Revenue |
|---|---|---|
| Technology | 27 | $1,492B |
|
||
| Financial Services | 3 | $174B |
|
||
| Retail | 3 | $44B |
|
||
| Insurance | 3 | $26B |
|
||
| Media / Entertainment | 2 | $115B |
|
||
| Pharmaceuticals / Biotech | 2 | $62B |
|
||
Price history
1 event — show timeline
- 2026-06-06 Listed $230,000 CRMLS
Property tax history
-1.3%/yrLatest (2025): $32 · -0.2% YoY. Source: county tax records.
Cash-flow waterfall
monthlySold comps — $/sqft
last 12 mo · ≤1 miLoading sold comps…