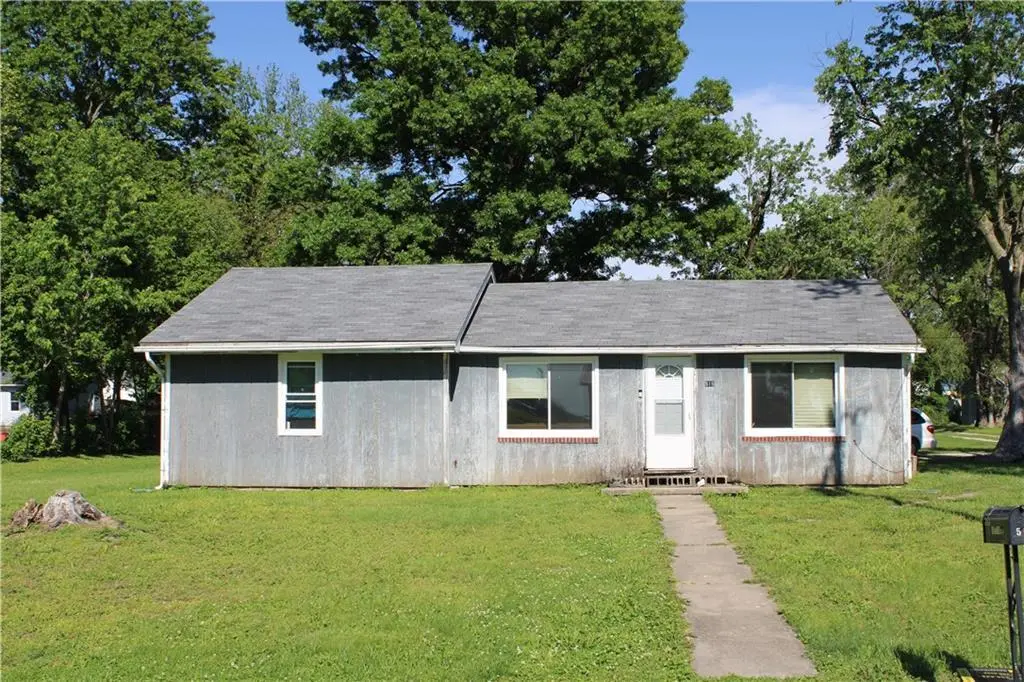
515 NW 5th St · Hardin, MO
Flood risk 1/10 · Minimal
- FEMA flood zone
- AE
- Chance of flooding over 30 yrs
- 0.0%
- Est. flood insurance / yr
- $2,026 – $9,024
Fire risk 1/10 · Minimal
- Est. fire insurance / yr
- $1,054 – $1,958
Heat risk 4/10 · Minor
- Hot days now (above 108°F)
- 7 days/yr
- Hot days in 30 yrs
- 16 days/yr
Wind risk 2/10 · Minimal
- Chance of severe wind over 30 yrs
- —
Air-quality risk 2/10 · Minimal
- Unhealthy air days now
- 1 days/yr
- Unhealthy air days in 30 yrs
- 2 days/yr
Risk factors via First Street. Map © Google.
Why this score? — see what drove the A grade
The composite is a weighted blend of 9 inputs, each scored 0–100. Each bar is that input's sub-score; the figure is the points it added to the 100-point composite (weight × sub-score).
- Cash flow +30.0/30.0
- ARV discount +15.0/15.0
- DSCR +10.0/10.0
- Appreciation +10.0/10.0
- 1% rule +7.9/10.0
- Schools +4.0/10.0
- Livability +3.2/5.0
- Rent growth +2.5/5.0
- Condition / age +2.5/5.0
$95,000
🖨 Deal sheet 📄 Offer letter ✓ Due diligence
Listing remarks
Welcome to peaceful, small-town living! Located in the heart of Hardin, Missouri, this 3-bedroom, 1-bathroom home offers 1,278 square feet of living space situated on a sprawling 0.55-acre lot. Whether you are an investor looking to add a solid property to your portfolio or a buyer eager to bring your personal touch to a classic home, this rural retreat is full of potential. Inside, you will find spacious living areas featuring cozy wood paneling and a unique stone-look accent wall. The kitchen offers ample wood cabinetry, a double sink, and a large window that lets in plenty of natural light. Outside, the expansive half-acre property boasts mature shade trees, a level yard with a fenced ba
Key facts
- 0.55 acre lot
- Garage
- Built 1965
Property features AI
Finance
- Other: Above-grade finished area recorded from public records; Basement present — concrete and other features
Exterior
- Parking: Detached garage facing side; 1-car garage
- Security: Smoke detector(s)
- Utilities: Public water; Public sewer; Cable available; High-speed internet available
- Home design: Single-family residence; Ranch floor plan; Faces south
- Construction: Wood siding; Composition roof; Garage(s) on property; Home is 51–75 years old
- Exterior features: Metal fencing; City limits location; Level lot; Paved road with public maintenance; Property in a flood plain
Interior
- Kitchen: Dishwasher; Disposal; Microwave; Refrigerator; Eat-in kitchen / kitchen-dining combo
- Bedrooms: 3 bedrooms on the main/first floor
- Flooring: Carpet; Vinyl; Wood
- Bathrooms: 1 full bathroom
- Heating & cooling: Propane heating; Electric cooling
- Interior features: Stained cabinets; Storm door(s); Smoke detector(s)
- Laundry & utility: Laundry on main level and in basement
Neighborhood map
What this means for you Summary
Snapshot
- This is a 3-bed/1.0-bath single-family listed at $95k.
Deal economics
- At list price, monthly cash flow is $-87 ($-1k/yr) — negative.
- To cash-flow at today's rent, offer at most $80k (16.2% below list).
- Meets the 1% rule at list price ($1k rent vs $95k).
- Recommended offer: $80k (16.2% below list) — sets the bar for cash-flow.
Location & tenants
- Location reads 65/100 on livability (#258 in MO) — a middle-class / working-renter tenant base. Strengths: crime A+, cost of living A+, housing A+; Watch: schools C-, employment D+, amenities F.
- Hardin-Central C-2 (rural): math 40% / reading 45% proficiency, ranked #217 of 535 in MO (top 41%) — families likely to look elsewhere, expect single-tenant / working-renter base with shorter leases.
- Market conditions: 4 active listings in the ZIP; 56 units permitted in Ray County in 2024 (0 in 5+ unit buildings).
Forward outlook
- In year one you build about $10k of equity ($657 loan paydown + $10k appreciation (10.0% local appreciation)).
- Ray County population projected at -23% by 2050 — secular population decline; favor cash flow + early exit over multi-decade hold.
- By year 4, paydown + projected appreciation supports a ~$36k cash-out refi (75% LTV) — recoverable capital for the next deal without selling this one.
Negotiation context
- It's been on market 38 days — a 3% lower offer ($92k) is reasonable based on typical stale-listing flexibility.
Risks & watch-outs
- Watch-outs: flood insurance adds $460/mo.
- Climate carrying-cost: in FEMA flood zone AE (mandatory federal flood insurance) — expect insurance premiums to compound above CPI over the hold.
Questions for the listing agent
- What do current leases actually rent for vs. the listed asking? Can we see a recent rent roll and the last 12 months of T-12 income?
- It's been on market 38 days. Have you received any prior offers? Is the seller open to a 16% concession, seller financing, or rate buy-down credit?
- Built in 1965 — when were the roof, HVAC, electrical panel, plumbing, and water heater last replaced?
- What's the actual annual flood-insurance premium (NFIP or private), and is the property in a SFHA with mandatory coverage?
- Is there a deadline driving the sale (1031 exchange, divorce, estate, relocation)? That informs how much negotiation room exists.
- What's the average days-on-market for RENTAL listings here right now (not sales)? A rising rental-DOM trend means longer vacancies and softer asking-rent achievability than the comps imply.
- What's the recent tenant-quality profile in this submarket — average credit score on applications, eviction rate, late-payment / NSF rate, and stable-employment percentage? A property-management company in the area should have these aggregated.
- How much new for-sale + rental construction is in the pipeline within 1–3 miles? Heavy new supply typically softens prices + rents 12–24 months out; constrained supply supports both.
Investment metrics
- 1% rule
- 1.29% ✓
- Cap rate
- 11.01%
- Cash-on-cash
- 16.84%
- DSCR
- 1.75
- GRM
- 6.4
CMA / ARV
- ARV (median comp)
- $143,929
- List price
- $95,000
- Delta
- -34.00%
- Verdict
- UNDERPRICED
- Comps
- 20 within 1.0 mi
Show comp detail 5 sales within ~0.75 mi
| Address | Dist | Beds/Ba | Sqft | Sold | Price | $/sf | Match |
|---|---|---|---|---|---|---|---|
| 407 Parkway N/A | 0.18mi | 3/1.0 | 1,206 (-6%) | 4mo | $74,900 | $62 | 78 |
| 323 Parkway St | 0.21mi | 4/1.5 (+1) | 1,282 (+0%) | 8mo | $179,000 | $140 | 76 |
| 213 W Elm St | 0.35mi | 2/1.0 (-1) | 1,201 (-6%) | 5mo | $160,000 | $133 | 65 |
| 206 E Elm St | 0.54mi | 3/1.0 | 1,310 (+2%) | 13mo | $139,500 | $106 | 60 |
| 309 W Elm St | 0.32mi | 2/1.0 (-1) | 1,152 (-10%) | 11mo | $139,500 | $121 | 55 |
Match score weights: distance 35% · size 25% · config 20% · recency 20%. Top-matched comps best support the ARV.
Projected returns pro-forma
10.0% appreciation · 3.0% rent growth · sell at horizon
- IRR
- 21.6%
- Equity multiple
- 2.75×
- Total profit
- $46,461
- Equity at exit
- $85,584
- IRR
- 19.6%
- Equity multiple
- 6.33×
- Total profit
- $141,706
- Equity at exit
- $184,564
Cash invested: $26,600 (down + closing). Projections, not guarantees.
Landlord ↔ Tenant lean methodology
- Overall (STATE)
- 81 Strongly Landlord-Friendly
- State Missouri
- 81 Strongly Landlord-Friendly · R+10
- County
- — inherits STATE
- City
- — inherits STATE
ZIP-level market 64035
- Home prices YoY
- 3.3%
- Active inventory
- 4
- Price-to-rent
- 6.4×
Monthly cashflow live
- Estimated rent
- $1,228 medium interval (Pro) →
- Mortgage (P&I)
- −$498
- Tax from tax record
- −$59 /mo · $709/yr
- Insurance
- −$40
- Flood insurance flood zone
- −$460 /mo · $5,525/yr
- HOA
- −$0
- Vacancy / Maint / Mgmt
- −$258
- Net cashflow
- $-87
Break-even live
UW: 25.0% down · 7.5% · 30yr · 1.5% tax · 5.0% vac · 8.0% maint · 8.0% mgmt
Financing live
Cash to close
- Down payment
- $23,750
- Closing costs
- $2,850
- Reserves months
- —
- Total cash needed
- —
Loan-product check · same deal, 3 products live
Conventional
25% down · 7.5% · 30yr
- Down + closing
- —
- Monthly P&I
- —
- Monthly cashflow
- —
- DSCR
- —
- Eligible?
- —
Personal DTI + credit; lowest rate.
DSCR
20% down · 8.5% · 30yr
- Down + closing
- —
- Monthly P&I
- —
- Monthly cashflow
- —
- DSCR
- —
- Eligible?
- —
No personal income docs; deal must DSCR.
Hard money
10% down · 12.0% · 12mo
- Down + closing
- —
- Monthly P&I
- —
- Monthly cashflow
- —
- DSCR
- —
- Eligible?
- —
Short-term bridge; refi at stabilization.
Listing history 17 events
-
2026-06-18days on market $95,000 Active 38 DOM
-
2026-06-17days on market $95,000 Active 37 DOM
-
2026-06-16days on market $95,000 Active 36 DOM
-
2026-06-15days on market $95,000 Active 35 DOM
-
2026-06-13days on market $95,000 Active 33 DOM
-
2026-06-12days on market $95,000 Active 32 DOM
-
2026-06-09days on market $95,000 Active 29 DOM
-
2026-06-08days on market $95,000 Active 28 DOM
-
2026-06-07days on market $95,000 Active 27 DOM
-
2026-06-05days on market $95,000 Active 25 DOM
-
2026-06-04days on market $95,000 Active 23 DOM
-
2026-06-02days on market $95,000 Active 22 DOM
-
2026-06-01days on market $95,000 Active 21 DOM
-
2026-05-31days on market $95,000 Active 20 DOM
-
2026-05-12$100,000 Active 1197-char remark
-
2026-05-11price $100,000 1197-char remark
-
2026-05-11historical $10,000 1197-char remark
ⓘ Source: listings_history table (triggers on properties + properties_extension) + one-shot
backfill from property_details.listing_events for pre-trigger history.
Tax reassessment forecast MO · Resets to sale price
- Current annual tax
- $709 · $59/mo
- Projected year-2 tax
- $922 · $77/mo
- Expected delta
- +$213/yr (+$18/mo · 30.0%)
ⓘ Screening estimate from a state-policy table — verify with the county assessor before closing.
Climate risk First Street
- Flood 1/10 Low FEMA zone AE · 0% chance over 30 yrs
- Wildfire 1/10 Low
- Heat 4/10 Moderate 7 d/yr ≥108°F today · 16 d/yr by 30 yrs out
- Wind 2/10 Low
- Air quality 2/10 Low 1 unhealthy d/yr today · 2 by 30 yrs out
Nearby sold comps map
Loading sold comps map…
Walkable amenities ~0.75 mi
Loading nearby amenities…
Taxation est. · year 1
- Rental income
- $14,738
- − Mortgage interest
- −$5,321
- − Property taxes
- −$709
- − Insurance
- −$6,000
- − Repairs & maintenance
- −$1,179
- − Management
- −$1,179
- − Depreciation
- −$2,764
- Taxable loss
- −$2,414
- Est. tax savings @ 24.0%
- +$579
- After-tax cash flow
- $-465/yr
For passive investors: Depreciation is non-cash, so a rental often shows a tax loss while cash-flowing — sheltering income. Rental losses are passive: they offset passive income freely, and up to $25,000/yr can offset ordinary (W-2) income if you actively participate and your MAGI is under $100k (phasing out to $0 by $150k); unused losses carry forward. On sale, claimed depreciation is recaptured at up to 25%, and gains may owe capital-gains tax (a 1031 exchange can defer both). Figures are a year-1 estimate at your 24.0% rate — not tax advice; consult a CPA.
Schools (NCES district)
- District
- Hardin-Central C-2
- NCES district ID
- 2913680
- Math proficiency
- 40% ▲ 5.00%
- Reading proficiency
- 45% ▲ 5.00%
- Median HH income
- $58,076
- Composite
- 39.65/100
- National rank
- #8043
- State rank
- #217 of 535 in MO
Livability — Hardin
- Score
- 65/100
- State rank
- #258
- US rank
- #12440
Category grades
Schools grade is shown separately in the Schools card above.
Census & demographics
- Census place
- Hardin, MO
- Population (ZIP)
- 1,157
Population outlook (Ray County) Hauer SSP2
- Today (2025)
- 21,420 people
- By 2030
- 20,507 · -4.3%
- By 2040
- 18,550 · -13.4%
- By 2050
- 16,516 · -22.9%
- By 2075
- 12,899 · -39.8%
- By 2100
- 10,413 · -51.4%
Race, ethnicity, and origin ACS 2023
- Neighborhood character
- Predominantly White (97%)
- Race & ethnicity
- White 97% Hispanic / Latino 2% Two or more races 2%
- Common ancestry
- Serbian 2% Italian 2% Slovak 2%
- Languages at home
- 99% English-only · Spanish 1%
Political lean MEDSL · Ray
- 2024 margin
- Solid R (+48.7) · D 25.1% · R 73.8% · Other 1.1%
- 2008→2024 swing
- -45.5pp toward R · 2008: -3.2pp · 2024: -48.7pp
- All cycles
- 2024: R+48.7 2020: R+45.0 2016: R+37.1 2012: R+14.9 2008: R+3.2
Not yet ingested
- Civics
- —
Market trends
- HPI YoY
- ▲ 14.23%
- Current HPI
- 443.0517
- Rent YoY
- —
- Metro
- —
- State GDP YoY
- ▲ 1.84%
- F500 in state
- 20
Industry mix (Fortune 500 HQ in MO)
| Industry | F500 HQs | Revenue |
|---|---|---|
| Healthcare | 1 | $163B |
|
||
| Insurance | 1 | $21B |
|
||
| Industrial Technology | 1 | $17B |
|
||
| Retail | 1 | $16B |
|
||
| Industrial Distribution | 1 | $10B |
|
||
| Utilities | 1 | $9B |
|
||
Price history
+850.0% since first listed4 events — show timeline
- 2026-05-27 Price Changed $95,000 Heartland MLS as Distributed by MLS Grid
- 2026-05-12 Listed $100,000 Heartland MLS as Distributed by MLS Grid
- 2026-05-11 Price Changed $100,000 Heartland MLS as Distributed by MLS Grid
- 2026-05-11 Coming Soon $10,000 Heartland MLS as Distributed by MLS Grid
Property tax history
+2.6%/yrLatest (2025): $709 · +5.0% YoY. Source: county tax records.
Cash-flow waterfall
monthlySold comps — $/sqft
last 12 mo · ≤1 miLoading sold comps…