10350 W Bay Harbor Dr Unit 5E · Bay Harbor Islands, FL
Flood risk 8/10 · Major
- FEMA flood zone
- X
- Chance of flooding over 30 yrs
- 0.98%
- Est. flood insurance / yr
- $507 – $1,088
Fire risk 1/10 · Minimal
- Est. fire insurance / yr
- $947 – $1,759
Heat risk 10/10 · Severe
- Hot days now (above 103°F)
- 7 days/yr
- Hot days in 30 yrs
- 27 days/yr
Wind risk 10/10 · Severe
- Chance of severe wind over 30 yrs
- 99.0%
Air-quality risk 2/10 · Minimal
- Unhealthy air days now
- 1 days/yr
- Unhealthy air days in 30 yrs
- 2 days/yr
Risk factors via First Street. Map © Google.
Why this score? — see what drove the D grade
The composite is a weighted blend of 9 inputs, each scored 0–100. Each bar is that input's sub-score; the figure is the points it added to the 100-point composite (weight × sub-score).
- Appreciation +8.1/10.0
- ARV discount +7.5/15.0
- Cash flow +6.7/30.0
- 1% rule +6.5/10.0
- Schools +5.0/10.0
- Livability +4.3/5.0
- Condition / age +2.5/5.0
- Rent growth +2.2/5.0
- DSCR +1.0/10.0
$349,000
🖨 Deal sheet (PDF) 📄 Offer letter ✓ Due diligence
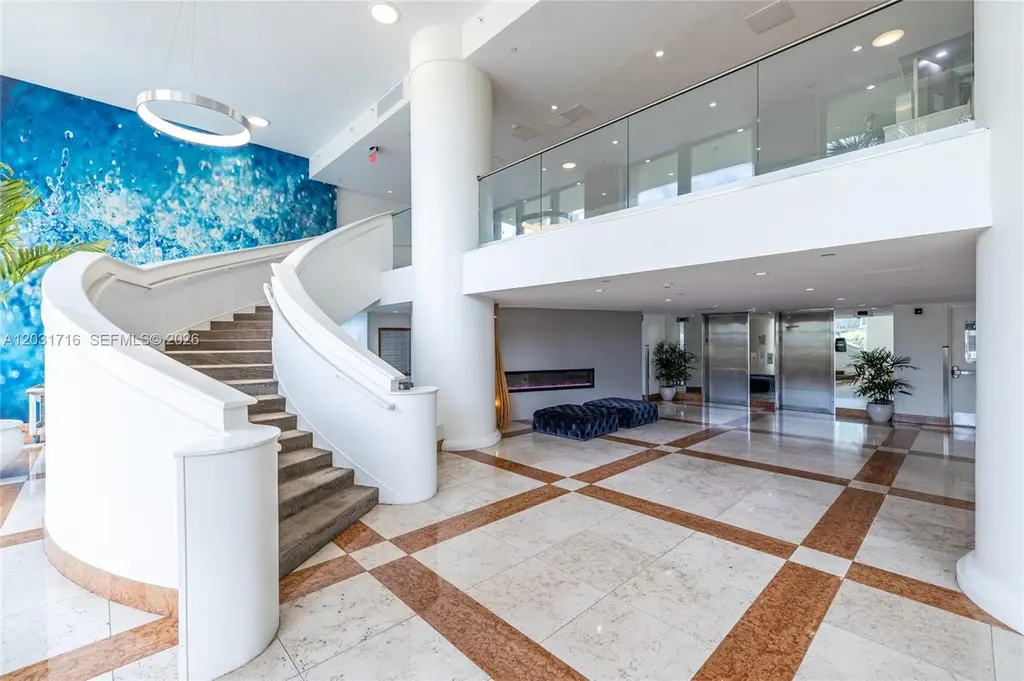
Listing remarks
Best building on Bay Harbor Islands , Chic unit with lots of LIGHT , Oversized 1-bedroom in the Heart of Bay Harbor Islands featuring expansive living spaces, Updated bath, and new applainces, a private balcony, and an unbeatable location just minutes from Bal Harbour Shops and the beach. Building has reserves and very stable financially , Can rent right away and amazing part of By harbor islands, , pool, gym, 24 hr security. Unit includes a storage unit.
Key facts
- Updated bath
- Private balcony
- New appliances
Tags
Property features AI
Finance
- Financial info: Pets allowed
- HOA & community: Monthly association fee of $1,300; Association covers management, amenities, common areas, cable TV, insurance, internet, grounds maintenance, pest control, pools, reserve fund, sewer, security, trash and water; Community amenities include clubhouse, community kitchen, fitness center, laundry, pool, storage and elevators
Exterior
- Parking: One assigned parking space
- Security: Doorman; Lobby secured; Security guard; Security/high impact doors
- Utilities: Has cooling
- Home design: Condominium in an 11-story building; Entry on level 5; Has attached property; Bay front waterfront with views
- Construction: Block construction
- Exterior features: Balcony; Open balcony/patio; Fence; High-impact doors
Interior
- Kitchen: Dishwasher; Electric range; Self-cleaning oven; Microwave; Refrigerator; Icemaker; Breakfast area / Eat-in kitchen
- Bedrooms: Bedroom on main level
- Flooring: Ceramic tile
- Bathrooms: 1 full bathroom
- Heating & cooling: Ceiling fan(s); Electric cooling
- Interior features: Partially furnished; Bedroom on main level; Breakfast area; Eat-in kitchen; Elevated living/dining room; Elevator access
- Laundry & utility: Washer and dryer included; Common area laundry available
Neighborhood map
What this means for you Summary
Snapshot
- This is a 1-bed/1.0-bath condo listed at $349k.
Deal economics
- At list price, monthly cash flow is $-620 ($-7k/yr) — negative.
- To cash-flow at today's rent, offer at most $240k (31.4% below list).
- Meets the 1% rule at list price ($4k rent vs $349k).
- Recommended offer: $240k (31.4% below list) — sets the bar for cash-flow.
Location & tenants
- Location reads 86/100 on livability (#13 in FL, #362 nationally) — a professional / high-income tenant draw. Strengths: crime A+, commute A+, employment A+; Watch: amenities F, cost of living F.
- Zoned schools: Ruth K. Broad Bay Harbor K-8 Center (math 76% / reading 76%, grade A, #198 of 2,144 statewide, top 10%, 1,249 students, 29% FRL); Miami Beach Nautilus Middle School (math 46% / reading 58%, grade C+, #217 of 571 statewide, top 40%, 918 students, 44% FRL); Miami Beach Senior High School (math 21% / reading 48%, grade F, #386 of 667 statewide, top 59%, 2,175 students, 40% FRL).
- Market conditions: Rents soft (-1.3%/yr); 523 active listings in the ZIP; 2 comparable units currently listed for rent nearby; solid renter incomes; 10,051 units permitted in Miami-Dade County in 2024 (7,758 in 5+ unit buildings).
- At $4,003/mo this rent would consume 54% of the median local household income ($90k/yr) (locally 774% of renters already pay >50% of income on rent) — very limited rent-growth headroom before tenants either downsize or default.
Forward outlook
- In year one you build about $24k of equity ($2k loan paydown + $21k appreciation (6.1% local appreciation)).
- Miami-Dade County population projected at +28% by 2050 — long-run rental-demand tailwind backs the buy-and-hold thesis.
- By year 2, paydown + projected appreciation supports a ~$38k cash-out refi (75% LTV) — recoverable capital for the next deal without selling this one.
Negotiation context
- It's been on market 16 days — a 2% lower offer ($344k) is reasonable based on typical stale-listing flexibility.
- 6 sale attempts with the ask held roughly flat each time — persistent listings suggest the price (not the market) is what's stuck; bring a comps-based counter.
Risks & watch-outs
- Watch-outs: flood insurance adds $66/mo; HOA is 32% of rent.
- Climate carrying-cost: severe flood risk; severe wind risk, 99% chance of damaging wind over 30y; extreme-heat days projected 7→27/yr by 2055 (HVAC capex compounding) — expect insurance premiums to compound above CPI over the hold.
Questions for the listing agent
- What do current leases actually rent for vs. the listed asking? Can we see a recent rent roll and the last 12 months of T-12 income?
- Built in 1966 — when were the roof, HVAC, electrical panel, plumbing, and water heater last replaced?
- What's the actual annual flood-insurance premium (NFIP or private), and is the property in a SFHA with mandatory coverage?
- What does the HOA fee cover, when was the last increase, and are there any pending special assessments or reserve-fund shortfalls?
- Any open or pending special assessments — roof, HVAC, plumbing, elevator, façade? What's the per-unit balance and payoff schedule, and is the seller paying it off at close or rolling it to the buyer?
- Is there a deadline driving the sale (1031 exchange, divorce, estate, relocation)? That informs how much negotiation room exists.
- Schools are A-rated — typically a magnet for longer-tenancy family renters. What's the average tenant stay here, and is there a school-zone premium baked into asking?
- The area grade is low — what's the realistic commute time and amenity access for the typical tenant pool here? Any planned neighborhood developments (good or bad) we should know about?
- What's the average days-on-market for RENTAL listings here right now (not sales)? A rising rental-DOM trend means longer vacancies and softer asking-rent achievability than the comps imply.
- What's the recent tenant-quality profile in this submarket — average credit score on applications, eviction rate, late-payment / NSF rate, and stable-employment percentage? A property-management company in the area should have these aggregated.
- How much new apartment / multifamily construction is in the pipeline within 1–3 miles? Heavy new supply (>2% of stock underway) typically softens rents 12–24 months out; light construction supports rent growth.
Investment metrics
- 1% rule
- 1.15% ✓
- Cap rate
- 4.39%
- Cash-on-cash
- -6.79%
- DSCR
- 0.70
- GRM
- 7.3
CMA / ARV
No comps found within radius.
Projected returns pro-forma
6.12% appreciation · 0.0% rent growth · sell at horizon
- IRR
- 8.0%
- Equity multiple
- 1.54×
- Total profit
- $53,053
- Equity at exit
- $222,138
- IRR
- 8.5%
- Equity multiple
- 2.71×
- Total profit
- $167,032
- Equity at exit
- $405,224
Cash invested: $97,720 (down + closing). Projections, not guarantees.
Landlord ↔ Tenant lean methodology
- Overall (STATE)
- 87 Strongly Landlord-Friendly
- State Florida
- 87 Strongly Landlord-Friendly · R+3
- County
- — inherits STATE
- City
- — inherits STATE
ZIP-level market 33154
- Home prices YoY
- 1.4%
- Rents YoY
- -1.3%
- Active inventory
- 523
- Price-to-rent
- 7.3×
Monthly cashflow live
- Estimated rent
- $4,003 medium interval (Pro) →
- Mortgage (P&I)
- −$1,830
- Tax from tax record
- −$440 /mo · $5,274/yr
- Insurance
- −$145
- Flood insurance flood zone
- −$66 /mo · $798/yr
- HOA
- −$1,300
- Vacancy / Maint / Mgmt
- −$841
- Net cashflow
- $-620
Break-even live
Sensitivity live
| Price | -10% $-422 | -5% $-521 | +0% $-620 | +5% $-718 | +10% $-817 |
|---|---|---|---|---|---|
| Rent | -10% $-936 | -5% $-778 | +0% $-620 | +5% $-461 | +10% $-303 |
| Rate | -1.0pp $-444 | -0.5pp $-531 | base $-620 | +0.5pp $-710 | +1.0pp $-802 |
UW: 25.0% down · 7.5% · 30yr · 1.5% tax · 5.0% vac · 8.0% maint · 8.0% mgmt
Financing live
Cash to close
- Down payment
- $87,250
- Closing costs
- $10,470
- Reserves months
- —
- Total cash needed
- —
Loan-product check · same deal, 3 products live
Conventional
25% down · 7.5% · 30yr
- Down + closing
- —
- Monthly P&I
- —
- Monthly cashflow
- —
- DSCR
- —
- Eligible?
- —
Personal DTI + credit; lowest rate.
DSCR
20% down · 8.5% · 30yr
- Down + closing
- —
- Monthly P&I
- —
- Monthly cashflow
- —
- DSCR
- —
- Eligible?
- —
No personal income docs; deal must DSCR.
Hard money
10% down · 12.0% · 12mo
- Down + closing
- —
- Monthly P&I
- —
- Monthly cashflow
- —
- DSCR
- —
- Eligible?
- —
Short-term bridge; refi at stabilization.
Rent comps 2 comps
| Address | Beds | Baths | Sqft | Rent | $/sqft | DOM | Units | Dist |
|---|---|---|---|---|---|---|---|---|
| 2020 NE 135th St #904 North Miami, FL | 2.0 | 2.0 | 963 | $23,509 | $24.41 | 17d | 1 | 1.35mi |
| 2020 NE 135th St North Miami, FL | 2.0 | 2.0 | 963 | $23,509 | $24.41 | 15d | 1 | 1.35mi |
HOA detail condo
- Monthly dues
- $1,300 · $15,600/yr
- Likely covers
- poolgymsecurity
- Assessments
- None detected in remarks — confirm with the listing agent.
Listing history 10 events
-
2026-06-21days on market $349,000 Active 16 DOM
-
2026-06-18days on market $349,000 Active 13 DOM
-
2026-06-17days on market $349,000 Active 12 DOM
-
2026-06-16days on market $349,000 Active 11 DOM
-
2026-06-15days on market $349,000 Active 10 DOM
-
2026-06-13days on market $349,000 Active 8 DOM
-
2026-06-09days on market $349,000 Active 4 DOM
-
2026-06-08days on market $349,000 Active 3 DOM
-
2026-06-07remarks 462-char remark
-
2026-06-07$349,000 Active 2 DOM
ⓘ Source: listings_history table (triggers on properties + properties_extension) + one-shot
backfill from property_details.listing_events for pre-trigger history.
Tax reassessment forecast FL · Resets to sale price
- Current annual tax
- $5,274 · $440/mo
- Projected year-2 tax
- $5,274 · $440/mo
- Expected delta
- $0/yr ($0/mo · 0.0%)
ⓘ Screening estimate from a state-policy table — verify with the county assessor before closing.
Climate risk First Street
- Flood 8/10 Severe FEMA zone X · 98% chance over 30 yrs
- Wildfire 1/10 Low
- Heat 10/10 Extreme 7 d/yr ≥103°F today · 27 d/yr by 30 yrs out
- Wind 10/10 Extreme 99% chance of damaging wind over 30 yrs
- Air quality 2/10 Low 1 unhealthy d/yr today · 2 by 30 yrs out
Nearby sold comps map
Loading sold comps map…
Walkable amenities ~0.75 mi
Loading nearby amenities…
Taxation est. · year 1
- Rental income
- $48,031
- − Mortgage interest
- −$19,549
- − Property taxes
- −$5,274
- − Insurance
- −$2,542
- − Repairs & maintenance
- −$3,842
- − Management
- −$3,842
- − HOA
- −$15,600
- − Depreciation
- −$10,153
- Taxable loss
- −$12,773
- Est. tax savings @ 24.0%
- +$3,066
- After-tax cash flow
- $-4,369/yr
For passive investors: Depreciation is non-cash, so a rental often shows a tax loss while cash-flowing — sheltering income. Rental losses are passive: they offset passive income freely, and up to $25,000/yr can offset ordinary (W-2) income if you actively participate and your MAGI is under $100k (phasing out to $0 by $150k); unused losses carry forward. On sale, claimed depreciation is recaptured at up to 25%, and gains may owe capital-gains tax (a 1031 exchange can defer both). Figures are a year-1 estimate at your 24.0% rate — not tax advice; consult a CPA.
Schools (NCES district)
No district data.
Livability — Bay Harbor Islands
- Score
- 86/100
- State rank
- #13
- US rank
- #362
Category grades
Schools grade is shown separately in the Schools card above.
Census & demographics
- Census place
- Bay Harbor Islands, FL
- County
- Miami-Dade County · 2,697,751 people
- City population
- 14,435
- Metro
- Miami-Fort Lauderdale-Pompano Beach, FL
- Population (ZIP)
- 14,572
- Household income
- $89,563
- Rent vs Own
- Severe rent burden
- 774.0
Population outlook (Miami-Dade County) Hauer SSP2
- Today (2025)
- 3,126,439 people
- By 2030
- 3,325,765 · +6.4%
- By 2040
- 3,697,561 · +18.3%
- By 2050
- 4,012,134 · +28.3%
- By 2075
- 4,605,612 · +47.3%
- By 2100
- 4,866,598 · +55.7%
Race, ethnicity, and origin ACS 2023
- Neighborhood character
- Majority White (53%)
- Race & ethnicity
- White 53% Hispanic / Latino 41% Two or more races 25% Black 2%
- Hispanic origin (detail)
- Puerto Rican 2% Cuban 12% Salvadoran 2%
- Common ancestry
- Scotch-Irish 7% Romanian 5% Lithuanian 4%
- Foreign-born
- 46% · Canada, Jamaica, Dominican Republic
- Languages at home
- 36% English-only · Spanish 41% French/Haitian/Cajun 7% Other Indo-European 5%
Political lean MEDSL · Miami-Dade
- 2024 margin
- R (+11.4) · D 43.9% · R 55.4%
- 2008→2024 swing
- -27.6pp toward R · 2008: 16.1pp · 2024: -11.4pp
- All cycles
- 2024: R+11.4 2020: D+7.3 2016: D+29.6 2012: D+23.7 2008: D+16.1
Not yet ingested
- Civics
- —
Market trends
- HPI YoY
- ▲ 6.12%
- Current HPI
- 454.1747
- Rent YoY
- ▼ -1.30%
- Metro
- Miami-Fort Lauderdale-Pompano Beach, FL
- State GDP YoY
- ▲ 3.28%
- F500 in state
- 36
Industry mix (Fortune 500 HQ in FL)
| Industry | F500 HQs | Revenue |
|---|---|---|
| Industrial Technology | 2 | $29B |
|
||
| Insurance | 2 | $17B |
|
||
| Retail | 1 | $60B |
|
||
| Technology Distribution | 1 | $58B |
|
||
| Homebuilding | 1 | $35B |
|
||
| Technology Manufacturing | 1 | $35B |
|
||
Price history
-12.5% since first listed11 events — show timeline
- 2026-06-04 Listed $349,000 MARMLS
- 2025-12-01 Listed $379,000 MARMLS
- 2025-11-30 Listing Removed — MARMLS
- 2025-11-30 Relisted — MARMLS
- 2025-09-30 Relisted — MARMLS
- 2025-07-21 Price Changed $389,000 MARMLS
- 2025-03-24 Rental Removed $2,550 MARMLS
- 2025-03-04 Price Changed $2,550 MARMLS
- 2025-01-30 Price Changed $2,750 MARMLS
- 2025-01-04 Listed for Rent $2,850 MARMLS
- 2025-01-02 Listed $399,000 MARMLS
Property tax history
+5.1%/yrLatest (2025): $5,274 · +7.3% YoY. Source: county tax records.
Cash-flow waterfall
monthlySold comps — $/sqft
last 12 mo · ≤1 miLoading sold comps…