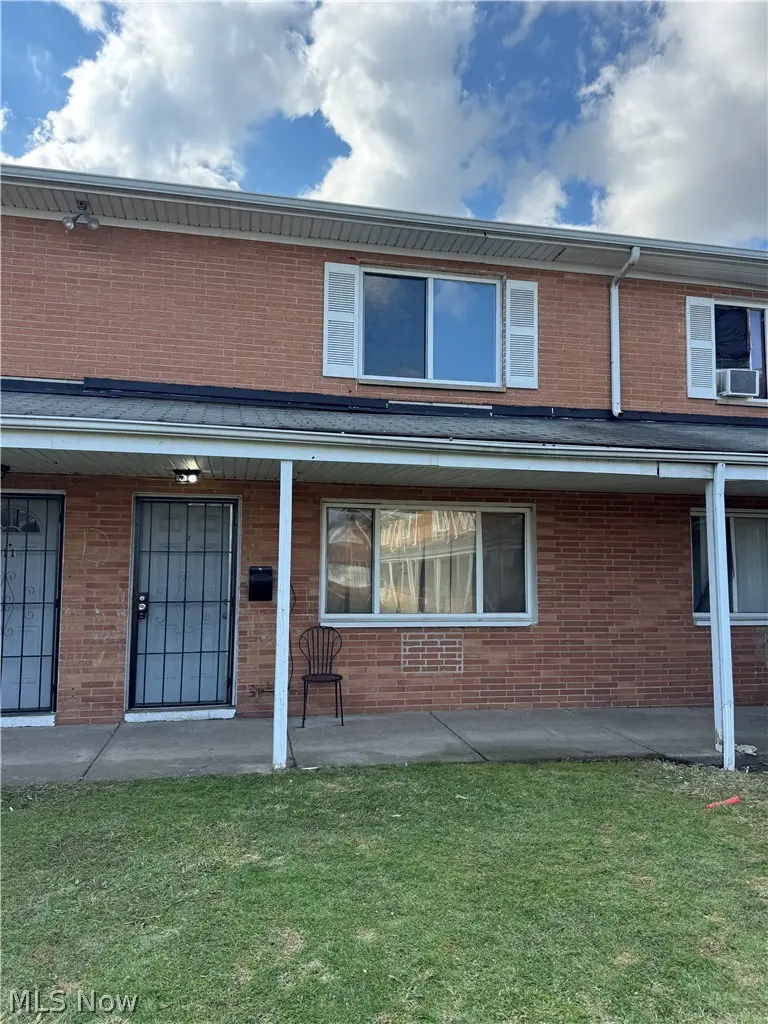
4878 Banbury Ct #12 · Warrensville Heights, OH
Flood risk No data
- FEMA flood zone
- —
- Chance of flooding over 30 yrs
- —
- Est. flood insurance / yr
- —
Fire risk No data
- Est. fire insurance / yr
- —
Heat risk No data
- Hot days now (above threshold)
- —
- Hot days in 30 yrs
- —
Wind risk No data
- Chance of severe wind over 30 yrs
- —
Air-quality risk No data
- Unhealthy air days now
- —
- Unhealthy air days in 30 yrs
- —
Risk factors via First Street. Map © Google.
Why this score? — see what drove the C+ grade
The composite is a weighted blend of 9 inputs, each scored 0–100. Each bar is that input's sub-score; the figure is the points it added to the 100-point composite (weight × sub-score).
- Cash flow +30.0/30.0
- 1% rule +10.0/10.0
- DSCR +10.0/10.0
- Rent growth +5.0/5.0
- Livability +3.7/5.0
- Condition / age +2.5/5.0
- Schools +2.1/10.0
- ARV discount +0.0/15.0
- Appreciation +0.0/10.0
$72,900
🖨 Deal sheet 📄 Offer letter ✓ Due diligence
Listing remarks MLS
Welcome to Miles Landing! This move-in ready condo in Warrensville Heights offers 2-bedrooms & 1.5 bathroom. Ready for its next occupant. Schedule your showing today!
Key facts
- $125 HOA
- Built 1963
- Listed 79 days
Neighborhood map
What this means for you Summary
Snapshot
- This is a 2-bed/1.5-bath condo listed at $73k.
Deal economics
- At list price, monthly cash flow is $323 ($4k/yr) — positive.
- The deal already cash-flows at list — no discount required.
- Meets the 1% rule at list price ($1k rent vs $73k).
- Recommended offer: $69k (6.0% below list) — sets the bar for market timing.
Location & tenants
- Location reads 73/100 on livability (#316 in OH) — a middle-class / working-renter tenant base. Strengths: cost of living A+, housing A+; Watch: crime C-, health & safety D, commute D-.
- Warrensville Heights City (suburban): math 22% / reading 29% proficiency, ranked #604 of 656 in OH (top 92%) — low school quality limits family demand, transient renter base, plan for 1-2y turnover; 84% free/reduced lunch — lower-income household profile, screen leases tightly.
- Market conditions: Rents rising fast (+12.0%/yr); 32 active listings in the ZIP; 17 comparable units currently listed for rent nearby; rentals at typical pace (median 16d on market — plan ~3-4 weeks tenant-placement turnaround); 47% of comp listings sitting > 30 days — soft ceiling on asking rent; lower-income renter base — watch delinquency; 1,441 units permitted in Cuyahoga County in 2024 (700 in 5+ unit buildings).
- This rent runs 33% of the median local income ($44k/yr) — at the standard rent-burdened threshold; future hikes will face affordability resistance.
Forward outlook
- Local home prices are declining (-3.0%/yr); year-one equity from $504 of loan paydown is wiped out by about $2k of value loss. Plan a longer hold.
- Cuyahoga County population projected to shrink 8% by 2050 — rents likely to lag national; underwrite the cash flow, not the appreciation.
- At projected returns (-3.0% appreciation + 8.0% rent growth), your $20k cash investment doubles in ~5 years — after that, you're playing with house money.
Negotiation context
- It's been on market 79 days — a 6% lower offer ($69k) is reasonable based on typical stale-listing flexibility.
- Current owner paid $38k; list at $73k implies a 90% gain — meaningful room to come down on a strong offer.
Questions for the listing agent
- It's been on market 79 days. Have you received any prior offers? Is the seller open to a 6% concession, seller financing, or rate buy-down credit?
- Built in 1963 — when were the roof, HVAC, electrical panel, plumbing, and water heater last replaced?
- What does the HOA fee cover, when was the last increase, and are there any pending special assessments or reserve-fund shortfalls?
- Any open or pending special assessments — roof, HVAC, plumbing, elevator, façade? What's the per-unit balance and payoff schedule, and is the seller paying it off at close or rolling it to the buyer?
- Why hasn't it sold? Are there any deal-killer items the seller is aware of (foundation, flood, title, zoning, code violations)?
- Is there a deadline driving the sale (1031 exchange, divorce, estate, relocation)? That informs how much negotiation room exists.
- What's the average days-on-market for RENTAL listings here right now (not sales)? A rising rental-DOM trend means longer vacancies and softer asking-rent achievability than the comps imply.
- What's the recent tenant-quality profile in this submarket — average credit score on applications, eviction rate, late-payment / NSF rate, and stable-employment percentage? A property-management company in the area should have these aggregated.
- How much new apartment / multifamily construction is in the pipeline within 1–3 miles? Heavy new supply (>2% of stock underway) typically softens rents 12–24 months out; light construction supports rent growth.
Investment metrics
- 1% rule
- 1.65% ✓
- Cap rate
- 11.61%
- Cash-on-cash
- 18.98%
- DSCR
- 1.84
- GRM
- 5.1
CMA / ARV
- ARV (median comp)
- $55,079
- List price
- $72,900
- Delta
- 32.35%
- Verdict
- OVERPRICED
- Comps
- 20 within 1.0 mi
Projected returns pro-forma
-3.0% appreciation · 8.0% rent growth · sell at horizon
- IRR
- 17.2%
- Equity multiple
- 1.74×
- Total profit
- $15,194
- Equity at exit
- $10,870
- IRR
- 29.5%
- Equity multiple
- 4.38×
- Total profit
- $68,992
- Equity at exit
- $6,303
Cash invested: $20,412 (down + closing). Projections, not guarantees.
Landlord ↔ Tenant lean methodology
- Overall (STATE)
- 73 Landlord-Friendly
- State Ohio
- 73 Landlord-Friendly · R+6
- County
- — inherits STATE
- City
- — inherits STATE
ZIP-level market 44128
- Rents YoY
- 12.0%
- Active inventory
- 32
- Price-to-rent
- 5.1×
Monthly cashflow live
- Estimated rent
- $1,202 high interval (Pro) →
- Mortgage (P&I)
- −$382
- Tax from tax record
- −$89 /mo · $1,065/yr
- Insurance
- −$30
- HOA
- −$125
- Vacancy / Maint / Mgmt
- −$252
- Net cashflow
- $323
Break-even live
UW: 25.0% down · 7.5% · 30yr · 1.5% tax · 5.0% vac · 8.0% maint · 8.0% mgmt
Financing live
Cash to close
- Down payment
- $18,225
- Closing costs
- $2,187
- Reserves months
- —
- Total cash needed
- —
Loan-product check · same deal, 3 products live
Conventional
25% down · 7.5% · 30yr
- Down + closing
- —
- Monthly P&I
- —
- Monthly cashflow
- —
- DSCR
- —
- Eligible?
- —
Personal DTI + credit; lowest rate.
DSCR
20% down · 8.5% · 30yr
- Down + closing
- —
- Monthly P&I
- —
- Monthly cashflow
- —
- DSCR
- —
- Eligible?
- —
No personal income docs; deal must DSCR.
Hard money
10% down · 12.0% · 12mo
- Down + closing
- —
- Monthly P&I
- —
- Monthly cashflow
- —
- DSCR
- —
- Eligible?
- —
Short-term bridge; refi at stabilization.
Rent comps 17 comps
| Address | Beds | Baths | Sqft | Rent | $/sqft | DOM | Units | Dist |
|---|---|---|---|---|---|---|---|---|
| 4889 Banbury Ct Warrensville Heights, OH | 2.0 | 2.0 | 1116 | $1,075 | $0.96 | 16d | 1 | 0.05mi |
| 23755 Banbury Cir #10 Cleveland, OH | 2.0 | 1.5 | 1116 | $1,075 | $0.96 | 16d | 1 | 0.08mi |
| 21418 Raymond St Maple Heights, OH | 3.0 | 2.0 | 1158 | $1,695 | $1.46 | 14d | 1 | 1.06mi |
| 5303 Northfield Rd Bedford Heights, OH | 2.0 | 1.0–2.0 | 712 | $1,210 | $1.70 | 2d | 28 | 1.12mi |
| 21111 Raymond St Maple Heights, OH | 3.0 | 1.0 | 1100 | $1,275 | $1.16 | 43d | 1 | 1.18mi |
| 5327 Northfield Rd Bedford, OH | 2.0 | 1.5 | 850 | $950 | $1.12 | 16d | 1 | 1.18mi |
| 4340 Clarkwood Pkwy Cleveland, OH | 1.0–4.0 | 1.0–2.0 | 1007 | $917 | $0.91 | 1d | 487 | 1.19mi |
| 21206 Hillgrove Ave Maple Heights, OH | 3.0 | 1.5 | 1056 | $1,375 | $1.30 | 43d | 1 | 1.19mi |
| 21303 Kenyon Dr Maple Heights, OH | 3.0 | 1.0 | 1215 | $1,400 | $1.15 | 43d | 1 | 1.20mi |
| 21106 Gardenview Dr Maple Heights, OH | 3.0 | 2.0 | 1188 | $1,600 | $1.35 | 1d | 1 | 1.31mi |
| 4360 Northfield Rd Warrensville Heights, OH | 2.0 | 1.0 | 842 | $1,099 | $1.31 | 43d | 1 | 1.35mi |
| 4340 Northfield Rd Warrensville Heights, OH | 2.0 | 1.0 | 778 | $1,019 | $1.31 | 43d | 1 | 1.37mi |
| 20600 Watson Rd Maple Heights, OH | 3.0 | 1.5 | 1092 | $1,953 | $1.79 | 1d | 1 | 1.38mi |
| 25400 Rockside Rd Bedford Heights, OH | 1.0–3.0 | 1.0–2.0 | 870 | $1,182 | $1.36 | 1d | 6 | 1.39mi |
| 21597 Ellacott Pkwy Warrensville Heights, OH | 2.0 | 1.0 | 842 | $1,099 | $1.31 | 43d | 1 | 1.41mi |
| 4326 Northfield Rd Warrensville Heights, OH | 2.0 | 1.0 | 778 | $969 | $1.25 | 43d | 1 | 1.42mi |
| 20517 Mountville Dr Maple Heights, OH | 3.0 | 3.0 | 1329 | $1,731 | $1.30 | 43d | 1 | 1.49mi |
HOA detail condo
- Monthly dues
- $125 · $1,500/yr
- Assessments
- None detected in remarks — confirm with the listing agent.
Listing history 5 events
-
2026-03-09$72,900 Active 172-char remark
Show marketing remark (172 chars)
Welcome to Miles Landing! This move-in ready condo in Warrensville Heights offers 2-bedrooms & 1.5 bathroom. Ready for its next occupant. Schedule your showing today!
-
2013-03-05soldstatus $38,300
-
2013-02-06soldstatus $300,000
-
2011-06-22soldstatus $267,734
-
1999-06-09soldstatus $3,050,000
ⓘ Source: listings_history table (triggers on properties + properties_extension) + one-shot
backfill from property_details.listing_events for pre-trigger history.
Tax reassessment forecast OH · Partial reset (capped growth)
- Current annual tax
- $1,065 · $89/mo
- Projected year-2 tax
- $1,101 · $92/mo
- Expected delta
- +$36/yr (+$3/mo · 3.4%)
ⓘ Screening estimate from a state-policy table — verify with the county assessor before closing.
Nearby sold comps map
Loading sold comps map…
Walkable amenities ~0.75 mi
Loading nearby amenities…
Taxation est. · year 1
- Rental income
- $14,420
- − Mortgage interest
- −$4,084
- − Property taxes
- −$1,065
- − Insurance
- −$364
- − Repairs & maintenance
- −$1,154
- − Management
- −$1,154
- − HOA
- −$1,500
- − Depreciation
- −$2,121
- Taxable income
- $2,979
- Est. tax owed @ 24.0%
- −$715
- After-tax cash flow
- $3,159/yr
For passive investors: Depreciation is non-cash, so a rental often shows a tax loss while cash-flowing — sheltering income. Rental losses are passive: they offset passive income freely, and up to $25,000/yr can offset ordinary (W-2) income if you actively participate and your MAGI is under $100k (phasing out to $0 by $150k); unused losses carry forward. On sale, claimed depreciation is recaptured at up to 25%, and gains may owe capital-gains tax (a 1031 exchange can defer both). Figures are a year-1 estimate at your 24.0% rate — not tax advice; consult a CPA.
Schools (NCES district)
- District
- Warrensville Heights City
- NCES district ID
- 3904500
- Math proficiency
- 22% ▼ -16.00%
- Reading proficiency
- 29% ▼ -15.00%
- Median HH income
- $34,622
- Composite
- 20.98/100
- National rank
- #8467
- State rank
- #604 of 656 in OH
Livability — Warrensville Heights
- Score
- 73/100
- State rank
- #316
- US rank
- #5173
Category grades
Schools grade is shown separately in the Schools card above.
Census & demographics
- Census place
- Warrensville Heights, OH
- County
- Cuyahoga County · 1,090,369 people
- City population
- 27,122
- Metro
- Cleveland-Elyria, OH
- Population (ZIP)
- 27,122
- Household income
- $43,993
- Rent vs Own
- Severe rent burden
- 2088.0
Population outlook (Cuyahoga County) Hauer SSP2
- Today (2025)
- 1,244,621 people
- By 2030
- 1,230,093 · -1.2%
- By 2040
- 1,189,108 · -4.5%
- By 2050
- 1,145,706 · -7.9%
- By 2075
- 1,076,557 · -13.5%
- By 2100
- 978,987 · -21.3%
Race, ethnicity, and origin ACS 2023
- Neighborhood character
- Predominantly Black (93%)
- Race & ethnicity
- Black 93% White 3% Two or more races 2% Hispanic / Latino 1%
- Common ancestry
- Romanian 1%
- Foreign-born
- 2% · Canada
- Languages at home
- 95% English-only · Spanish 4% French/Haitian/Cajun 1%
Political lean MEDSL · Cuyahoga
- 2024 margin
- Solid D (+31.5) · D 65.4% · R 33.9%
- 2008→2024 swing
- -7.4pp toward R · 2008: 38.9pp · 2024: 31.5pp
- All cycles
- 2024: D+31.5 2020: D+34.1 2016: D+35.0 2012: D+38.7 2008: D+38.9
Not yet ingested
- Civics
- —
Market trends
- HPI YoY
- ▼ -83.42%
- Current HPI
- 114.0877
- Rent YoY
- ▲ 11.96%
- Metro
- Cleveland-Elyria, OH
- State GDP YoY
- ▲ 1.98%
- F500 in state
- 48
Industry mix (Fortune 500 HQ in OH)
| Industry | F500 HQs | Revenue |
|---|---|---|
| Insurance | 3 | $145B |
|
||
| Industrial Machinery | 3 | $49B |
|
||
| Financial Services | 3 | $24B |
|
||
| Consumer Goods | 2 | $93B |
|
||
| Aerospace / Defense | 2 | $47B |
|
||
| Utilities | 2 | $33B |
|
||
Price history
-97.6% since first listed5 events — show timeline
- 2026-03-09 Listed $72,900 MLSNOW
- 2013-03-05 Sold (Public Records) $38,300 Public Records
- 2013-02-06 Sold (Public Records) $300,000 Public Records
- 2011-06-22 Sold (Public Records) $267,734 Public Records
- 1999-06-09 Sold (Public Records) $3,050,000 Public Records
Property tax history
+6.6%/yrLatest (2025): $1,065 · -7.7% YoY. Source: county tax records.
Cash-flow waterfall
monthlySold comps — $/sqft
last 12 mo · ≤1 miLoading sold comps…