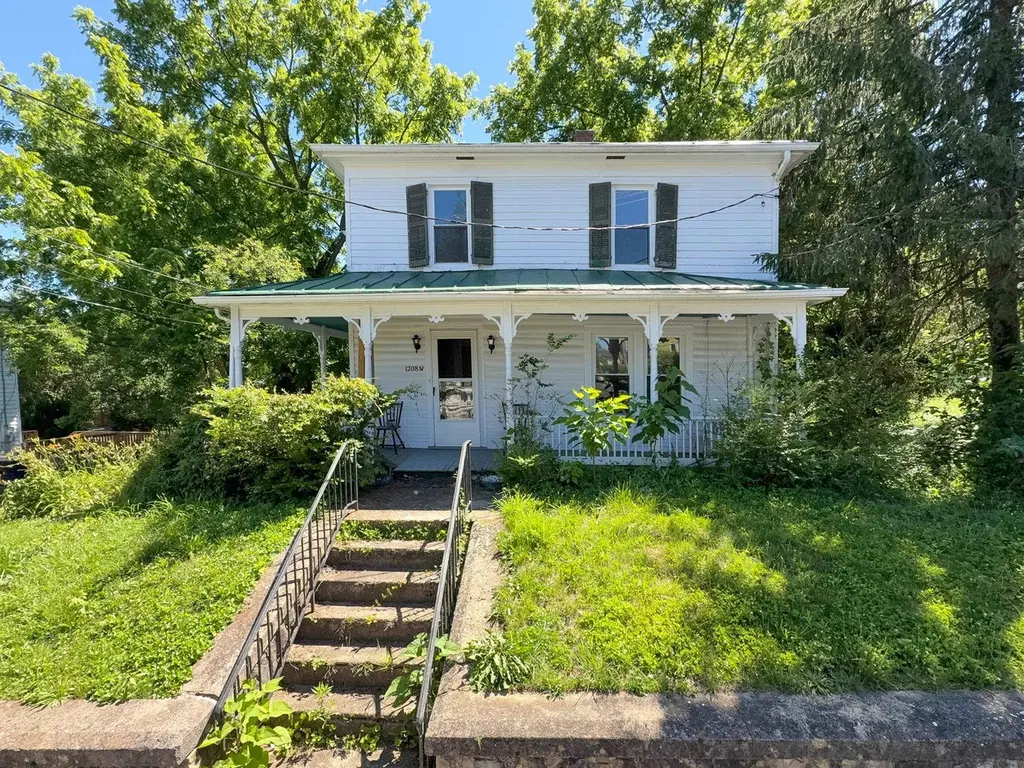
1208 Beverly St W · Staunton, VA
Flood risk 1/10 · Minimal
- FEMA flood zone
- X (unshaded)
- Chance of flooding over 30 yrs
- 0.0%
- Est. flood insurance / yr
- $473 – $860
Fire risk 3/10 · Minor
- Est. fire insurance / yr
- $666 – $1,236
Heat risk 4/10 · Minor
- Hot days now (above 100°F)
- 7 days/yr
- Hot days in 30 yrs
- 18 days/yr
Wind risk 2/10 · Minimal
- Chance of severe wind over 30 yrs
- 1.0%
Air-quality risk 1/10 · Minimal
- Unhealthy air days now
- 0 days/yr
- Unhealthy air days in 30 yrs
- 0 days/yr
Risk factors via First Street. Map © Google.
Why this score? — see what drove the D+ grade
The composite is a weighted blend of 9 inputs, each scored 0–100. Each bar is that input's sub-score; the figure is the points it added to the 100-point composite (weight × sub-score).
- Cash flow +13.5/30.0
- ARV discount +12.0/15.0
- Schools +4.8/10.0
- DSCR +4.1/10.0
- Livability +4.0/5.0
- Rent growth +3.9/5.0
- 1% rule +3.2/10.0
- Condition / age +2.5/5.0
- Appreciation +0.0/10.0
$230,000
🖨 Deal sheet (PDF) 📄 Offer letter ✓ Due diligence
Listing remarks MLS
4 bedroom home in good condition with wrap around porch! Hardwood floors, central AC, 2 car detached garage, unfinished basement! Eat-in kitchen, formal dining room. Priced for quick sale
Key facts
- 0.26 acre lot
- 2 garage spots
- Built 1900
Property features AI
Exterior
- Parking: Detached garage with electricity and rear-facing garage door; Garage has 2 spaces and a garage door opener
- Utilities: Public water; Public sewer; Cable available; Fiber optic available
- Home design: Detached two-story home; Entry level information not provided; Facing direction not provided
- Construction: Stick-built construction; Stone and slab foundation; Year built not provided; Roof information not provided
- Exterior features: Lot approximately 0.26 acres; Cable and fiber optic available; Public water and public sewer
Interior
- Bathrooms: One full bathroom; One half bathroom
- Heating & cooling: Heat pump and natural gas heating; Central air conditioning
- Interior features: Unfinished interior basement with interior entry
Neighborhood map
What this means for you Summary
Snapshot
- This is a 3-bed/1.5-bath single-family listed at $230k.
Deal economics
- At list price, monthly cash flow is $6 ($78/yr) — positive.
- The deal already cash-flows at list — no discount required.
- To meet the 1% rule (rent ≥ 1% of price), the offer needs to be $188k (18.4% below list).
- Recommended offer: $188k (18.4% below list) — sets the bar for 1% rule.
- Cap rate 6.3% vs local median 3.0% in Staunton — top-decile yield for the area; either an underpriced asset or a hidden risk that comps aren't pricing in. Stress-test before assuming the spread holds.
Location & tenants
- Location reads 81/100 on livability (#56 in VA, #1,524 nationally) — a professional / high-income tenant draw. Strengths: cost of living A+, housing A+, health & safety A+; Watch: commute F.
- Staunton City Public School District (urban): math 48% / reading 67% proficiency, ranked #73 of 131 in VA (top 56%) — acceptable for families but not a draw, mixed tenant base, ~2y average lease.
- Zoned schools: Bessie Weller Elementary (math 42% / reading 57%, grade D, #742 of 1,108 statewide, top 70%, 369 students, 99% FRL); Shelburne Middle (math 43% / reading 66%, grade B-, #194 of 342 statewide, top 60%, 574 students, 99% FRL); Staunton High (math 48% / reading 77%, grade B-, #226 of 319 statewide, top 72%, 822 students, 99% FRL) — zoned schools average 99% FRL vs 47% district-wide (52 pts higher); higher-poverty schools than district average — tighter screening recommended.
- Market conditions: Rents rising fast (+5.8%/yr); 303 active listings in the ZIP; 4 comparable units currently listed for rent nearby; rentals lingering (median 46d on market — plan ~5-8 weeks vacancy on turnover, expect pricing pressure); 100% of comp listings sitting > 30 days — soft ceiling on asking rent; 71 units permitted in Staunton city in 2024 (20 in 5+ unit buildings).
- This rent runs 34% of the median local income ($66k/yr) — at the standard rent-burdened threshold; future hikes will face affordability resistance.
Forward outlook
- Local home prices are declining (-3.0%/yr); year-one equity from $2k of loan paydown is wiped out by about $7k of value loss. Plan a longer hold.
- Staunton County population projected at +9% by 2050 — modest demand growth; plan on rents tracking national, not racing it.
Negotiation context
- Only 1 days on market — expect competitive offers; lowballing is unlikely to land.
- 2 sale attempts since 9y ago with the ask held roughly flat each time — persistent listings suggest the price (not the market) is what's stuck; bring a comps-based counter.
- Current owner paid $125k; list at $230k implies a 84% gain — meaningful room to come down on a strong offer.
Risks & watch-outs
- Watch-outs: built in 1900 — expect roof / HVAC / electrical / plumbing capex.
Questions for the listing agent
- Built in 1900 — when were the roof, HVAC, electrical panel, plumbing, and water heater last replaced?
- Is there a deadline driving the sale (1031 exchange, divorce, estate, relocation)? That informs how much negotiation room exists.
- Schools are A-rated — typically a magnet for longer-tenancy family renters. What's the average tenant stay here, and is there a school-zone premium baked into asking?
- The area grade is low — what's the realistic commute time and amenity access for the typical tenant pool here? Any planned neighborhood developments (good or bad) we should know about?
- What's the average days-on-market for RENTAL listings here right now (not sales)? A rising rental-DOM trend means longer vacancies and softer asking-rent achievability than the comps imply.
- What's the recent tenant-quality profile in this submarket — average credit score on applications, eviction rate, late-payment / NSF rate, and stable-employment percentage? A property-management company in the area should have these aggregated.
- How much new for-sale + rental construction is in the pipeline within 1–3 miles? Heavy new supply typically softens prices + rents 12–24 months out; constrained supply supports both.
Investment metrics
- 1% rule
- 0.82% ✗
- Cap rate
- 6.33%
- Cash-on-cash
- 0.12%
- DSCR
- 1.01
- GRM
- 10.2
CMA / ARV
- ARV (on-the-fly)
- $255,600
- Comps found
- 12
Show comp detail 12 sales within ~0.75 mi
| Address | Dist | Beds/Ba | Sqft | Sold | Price | $/sf | Match |
|---|---|---|---|---|---|---|---|
| 940 Beverley St W | 0.29mi | 3/3.0 | 1,690 (-1%) | 8mo | $250,000 | $148 | 73 |
| 207 Reservoir St | 0.44mi | 3/1.5 | 1,776 (+4%) | 3mo | $249,900 | $141 | 70 |
| 718 Alleghany Ave | 0.34mi | 3/2.0 | 1,852 (+9%) | 2mo | $395,000 | $213 | 66 |
| 815 Sudbury St | 0.26mi | 3/2.5 | 1,586 (-7%) | 9mo | $308,000 | $194 | 65 |
| 805 Sudbury St | 0.30mi | 4/1.5 (+1) | 1,560 (-8%) | 7mo | $189,900 | $122 | 61 |
| 1105 Johnson W | 0.39mi | 4/2.0 (+1) | 1,608 (-6%) | 8mo | $66,000 | $41 | 59 |
| 317 Madison St N | 0.48mi | 3/2.0 | 1,872 (+10%) | 2mo | $420,000 | $224 | 58 |
| 1111 Maple St | 0.66mi | 3/2.0 | 1,752 (+3%) | 8mo | $200,000 | $114 | 56 |
| 312 Waverly St N | 0.51mi | 3/2.0 | 1,840 (+8%) | 6mo | $329,900 | $179 | 56 |
| 3 Sullivan St | 0.72mi | 3/2.0 | 1,808 (+6%) | 1mo | $325,000 | $180 | 54 |
| 909 Maple St | 0.62mi | 3/2.0 | 1,853 (+9%) | 8mo | $260,000 | $140 | 48 |
| 511 Bowling St | 0.60mi | 3/1.0 | 1,530 (-10%) | 8mo | $229,500 | $150 | 47 |
Match score weights: distance 35% · size 25% · config 20% · recency 20%. Top-matched comps best support the ARV.
Projected returns pro-forma
-3.0% appreciation · 5.77% rent growth · sell at horizon
- IRR
- -13.3%
- Equity multiple
- 0.51×
- Total profit
- $-31,519
- Equity at exit
- $34,294
- IRR
- -0.8%
- Equity multiple
- 0.94×
- Total profit
- $-3,719
- Equity at exit
- $19,886
Cash invested: $64,400 (down + closing). Projections, not guarantees.
Landlord ↔ Tenant lean methodology
- Overall (STATE)
- 55 Moderately Landlord-Leaning
- State Virginia
- 55 Moderately Landlord-Leaning · D+2
- County
- — inherits STATE
- City
- — inherits STATE
ZIP-level market 24401
- Rents YoY
- 5.8%
- Active inventory
- 303
- Price-to-rent
- 10.2×
Monthly cashflow live
- Estimated rent
- $1,878 medium interval (Pro) →
- Mortgage (P&I)
- −$1,206
- Tax from tax record
- −$175 /mo · $2,099/yr
- Insurance
- −$96
- HOA
- −$0
- Vacancy / Maint / Mgmt
- −$394
- Net cashflow
- $6
Break-even live
Sensitivity live
| Price | -10% $137 | -5% $72 | +0% $6 | +5% $-59 | +10% $-124 |
|---|---|---|---|---|---|
| Rent | -10% $-142 | -5% $-68 | +0% $6 | +5% $81 | +10% $155 |
| Rate | -1.0pp $122 | -0.5pp $65 | base $6 | +0.5pp $-53 | +1.0pp $-114 |
UW: 25.0% down · 7.5% · 30yr · 1.5% tax · 5.0% vac · 8.0% maint · 8.0% mgmt
Financing live
Cash to close
- Down payment
- $57,500
- Closing costs
- $6,900
- Reserves months
- —
- Total cash needed
- —
Loan-product check · same deal, 3 products live
Conventional
25% down · 7.5% · 30yr
- Down + closing
- —
- Monthly P&I
- —
- Monthly cashflow
- —
- DSCR
- —
- Eligible?
- —
Personal DTI + credit; lowest rate.
DSCR
20% down · 8.5% · 30yr
- Down + closing
- —
- Monthly P&I
- —
- Monthly cashflow
- —
- DSCR
- —
- Eligible?
- —
No personal income docs; deal must DSCR.
Hard money
10% down · 12.0% · 12mo
- Down + closing
- —
- Monthly P&I
- —
- Monthly cashflow
- —
- DSCR
- —
- Eligible?
- —
Short-term bridge; refi at stabilization.
Rent comps 4 comps
| Address | Beds | Baths | Sqft | Rent | $/sqft | DOM | Units | Dist |
|---|---|---|---|---|---|---|---|---|
| 1013 Seth Dr Unit 702 Staunton, VA | 3.0 | 2.0 | 1300 | $1,800 | $1.38 | 45d | 1 | 0.62mi |
| 1013 Seth Dr Unit 701 Staunton, VA | 3.0 | 2.0 | 1680 | $1,900 | $1.13 | 45d | 1 | 0.62mi |
| 1008 Seth Dr Staunton, VA | 3.0 | 2.0 | 1300 | $1,750 | $1.35 | 45d | 1 | 0.80mi |
| 818 N Augusta St Staunton, VA | 2.0 | 2.0 | 1280 | $1,995 | $1.56 | 45d | 1 | 0.88mi |
Listing history 2 events
-
2026-06-09status $230,000 Pending 1 DOM
-
2026-06-08$230,000 Active 1 DOM
ⓘ Source: listings_history table (triggers on properties + properties_extension) + one-shot
backfill from property_details.listing_events for pre-trigger history.
Tax reassessment forecast VA · Resets to sale price
- Current annual tax
- $2,099 · $175/mo
- Projected year-2 tax
- $2,099 · $175/mo
- Expected delta
- $0/yr ($0/mo · 0.0%)
ⓘ Screening estimate from a state-policy table — verify with the county assessor before closing.
Climate risk First Street
- Flood 1/10 Low FEMA zone X (unshaded) · 0% chance over 30 yrs
- Wildfire 3/10 Moderate
- Heat 4/10 Moderate 7 d/yr ≥100°F today · 18 d/yr by 30 yrs out
- Wind 2/10 Low 100% chance of damaging wind over 30 yrs
- Air quality 1/10 Low 0 unhealthy d/yr today · 0 by 30 yrs out
Nearby sold comps map
Loading sold comps map…
Walkable amenities ~0.75 mi
Loading nearby amenities…
Taxation est. · year 1
- Rental income
- $22,533
- − Mortgage interest
- −$12,884
- − Property taxes
- −$2,099
- − Insurance
- −$1,150
- − Repairs & maintenance
- −$1,803
- − Management
- −$1,803
- − Depreciation
- −$6,691
- Taxable loss
- −$3,896
- Est. tax savings @ 24.0%
- +$935
- After-tax cash flow
- $1,013/yr
For passive investors: Depreciation is non-cash, so a rental often shows a tax loss while cash-flowing — sheltering income. Rental losses are passive: they offset passive income freely, and up to $25,000/yr can offset ordinary (W-2) income if you actively participate and your MAGI is under $100k (phasing out to $0 by $150k); unused losses carry forward. On sale, claimed depreciation is recaptured at up to 25%, and gains may owe capital-gains tax (a 1031 exchange can defer both). Figures are a year-1 estimate at your 24.0% rate — not tax advice; consult a CPA.
Schools (NCES district)
- District
- Staunton City Public School District
- NCES district ID
- 5103690
- Math proficiency
- 48% ▼ -33.00%
- Reading proficiency
- 67% ▼ -6.00%
- Median HH income
- $42,712
- Composite
- 48.23/100
- National rank
- #2163
- State rank
- #73 of 131 in VA
Livability — Staunton
- Score
- 81/100
- State rank
- #56
- US rank
- #1524
Category grades
Schools grade is shown separately in the Schools card above.
Census & demographics
- Census place
- Staunton, VA
- County
- Staunton City · 38,756 people
- City population
- 38,756
- Metro
- Staunton, VA
- Population (ZIP)
- 38,756
- Household income
- $66,300
- Rent vs Own
- Severe rent burden
- 1306.0
Population outlook (Staunton County) Hauer SSP2
- Today (2025)
- 25,515 people
- By 2030
- 26,060 · +2.1%
- By 2040
- 27,024 · +5.9%
- By 2050
- 27,926 · +9.4%
- By 2075
- 29,334 · +15.0%
- By 2100
- 29,046 · +13.8%
Race, ethnicity, and origin ACS 2023
- Neighborhood character
- Predominantly White (83%)
- Race & ethnicity
- White 83% Black 8% Two or more races 5% Hispanic / Latino 4% Asian 1%
- Common ancestry
- Italian 3% Serbian 3% Slovak 2%
- Foreign-born
- 3% · Canada
- Languages at home
- 95% English-only · Spanish 3% Other Indo-European 1% French/Haitian/Cajun 0%
Political lean MEDSL · Staunton
- 2024 margin
- D (+13.4) · D 56.0% · R 42.6% · Other 1.4%
- 2008→2024 swing
- +11.2pp toward D · 2008: 2.2pp · 2024: 13.4pp
- All cycles
- 2024: D+13.4 2020: D+9.9 2016: D+1.8 2012: D+4.1 2008: D+2.2
Not yet ingested
- Civics
- —
Market trends
- HPI YoY
- ▼ -283.01%
- Current HPI
- 210.049
- Rent YoY
- ▲ 5.77%
- Metro
- Staunton, VA
- State GDP YoY
- ▲ 2.40%
- F500 in state
- 50
Industry mix (Fortune 500 HQ in VA)
| Industry | F500 HQs | Revenue |
|---|---|---|
| Aerospace / Defense | 4 | $236B |
|
||
| Technology / Defense | 3 | $32B |
|
||
| Financial Services | 2 | $176B |
|
||
| Utilities | 2 | $27B |
|
||
| Insurance | 2 | $25B |
|
||
| Technology | 2 | $15B |
|
||
Price history
+84.0% since first listed4 events — show timeline
- 2026-06-04 Listed $230,000 GAAR
- 2017-10-11 Sold (Public Records) $125,100 Public Records
- 2017-10-11 Sold (MLS) $125,000 GAAR
- 2017-08-03 Listed $125,000 GAAR
Property tax history
+5.1%/yrLatest (2025): $2,099 · +17.1% YoY. Source: county tax records.
Cash-flow waterfall
monthlySold comps — $/sqft
last 12 mo · ≤1 miLoading sold comps…