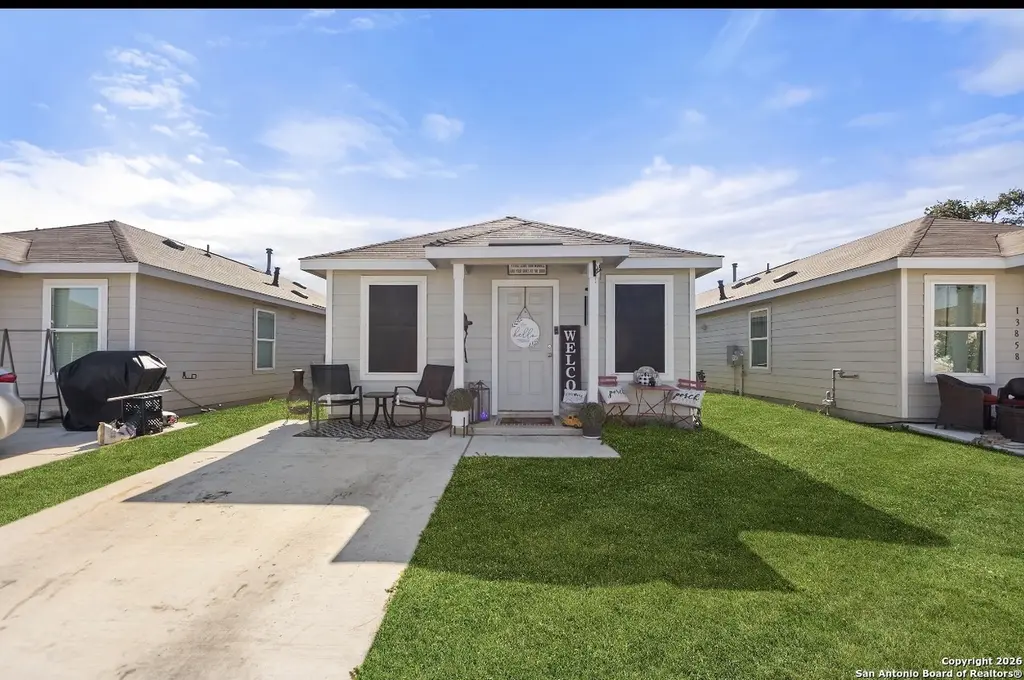
13854 Llama Pl · San Antonio, TX
Flood risk 1/10 · Minimal
- FEMA flood zone
- X (unshaded)
- Chance of flooding over 30 yrs
- 0.0%
- Est. flood insurance / yr
- $507 – $1,088
Fire risk 5/10 · Moderate
- Est. fire insurance / yr
- $1,222 – $2,270
Heat risk 8/10 · Major
- Hot days now (above 109°F)
- 7 days/yr
- Hot days in 30 yrs
- 22 days/yr
Wind risk 8/10 · Major
- Chance of severe wind over 30 yrs
- 80.0%
Air-quality risk 2/10 · Minimal
- Unhealthy air days now
- 0 days/yr
- Unhealthy air days in 30 yrs
- 1 days/yr
Risk factors via First Street. Map © Google.
Why this score? — see what drove the D+ grade
The composite is a weighted blend of 9 inputs, each scored 0–100. Each bar is that input's sub-score; the figure is the points it added to the 100-point composite (weight × sub-score).
- Cash flow +11.7/30.0
- ARV discount +11.4/15.0
- Appreciation +5.0/10.0
- Schools +4.4/10.0
- Livability +4.0/5.0
- DSCR +3.4/10.0
- 1% rule +2.9/10.0
- Condition / age +2.5/5.0
- Rent growth +2.1/5.0
$207,500
🖨 Deal sheet 📄 Offer letter ✓ Due diligence
Listing remarks MLS
A SINGLE - STORY HOME FEATURING AN OPEN LIVING AREA WITH A KITCHENETTE AND A FULL BATHROOM IN THE BACK OF THE HOME. GROWING AREA RIGHT OUTSIDE 1604 AND ALL SHOPPING AREAS. MINUTES AWAY FROM CASTROVILLE AND DOWNTOWN SAN ANTONIO. HOME COMES WITH ENDLESS POTENTIAL FOR PASSIVE INCOME OR JUST FOR A HOME.
Key facts
- Kitchenette
- Full bathroom
- Open living area
Tags
Neighborhood map
What this means for you Summary
Snapshot
- This is a 3-bed/2.0-bath single-family listed at $208k.
Deal economics
- At list price, monthly cash flow is $-63 ($-750/yr) — negative.
- To cash-flow at today's rent, offer at most $196k (5.3% below list).
- To meet the 1% rule (rent ≥ 1% of price), the offer needs to be $165k (20.7% below list).
- Recommended offer: $165k (20.7% below list) — sets the bar for 1% rule.
- Cap rate 5.9% vs local median 3.8% in San Antonio — top-decile yield for the area; either an underpriced asset or a hidden risk that comps aren't pricing in. Stress-test before assuming the spread holds.
Location & tenants
- Location reads 80/100 on livability (#31 in TX, #1,616 nationally) — a professional / high-income tenant draw. Strengths: amenities A+, commute A+, cost of living A+; Watch: schools C-, crime F.
- Medina Valley ISD (rural): math 48% / reading 53% proficiency, ranked #148 of 826 in TX (top 18%) — acceptable for families but not a draw, mixed tenant base, ~2y average lease.
- Market conditions: Rents soft (-1.7%/yr); 537 active listings in the ZIP; 34 comparable units currently listed for rent nearby; rentals at typical pace (median 24d on market — plan ~3-4 weeks tenant-placement turnaround); solid renter incomes; 8,308 units permitted in Bexar County in 2024 (2,506 in 5+ unit buildings).
Forward outlook
- In year one you build about $1k of equity ($1k loan paydown + $-4 appreciation (-0.0% local appreciation)).
- Bexar County population projected at +50% by 2050 — long-run rental-demand tailwind backs the buy-and-hold thesis.
Negotiation context
- It's been on market 151 days — a 12% lower offer ($183k) is reasonable based on typical stale-listing flexibility.
- 2 sale attempts since 3y ago with the ask held roughly flat each time — persistent listings suggest the price (not the market) is what's stuck; bring a comps-based counter.
Risks & watch-outs
- Climate carrying-cost: severe wind risk, 80% chance of damaging wind over 30y; moderate wildfire risk; extreme-heat days projected 7→22/yr by 2055 (HVAC capex compounding) — expect insurance premiums to compound above CPI over the hold.
Questions for the listing agent
- What do current leases actually rent for vs. the listed asking? Can we see a recent rent roll and the last 12 months of T-12 income?
- It's been on market 151 days. Have you received any prior offers? Is the seller open to a 21% concession, seller financing, or rate buy-down credit?
- What does the HOA fee cover, when was the last increase, and are there any pending special assessments or reserve-fund shortfalls?
- Why hasn't it sold? Are there any deal-killer items the seller is aware of (foundation, flood, title, zoning, code violations)?
- Is there a deadline driving the sale (1031 exchange, divorce, estate, relocation)? That informs how much negotiation room exists.
- Crime grade is F in this area — have there been break-ins, vandalism, or insurance claims at this property in the last 3 years? What carrier currently insures it and at what premium?
- The area grade is low — what's the realistic commute time and amenity access for the typical tenant pool here? Any planned neighborhood developments (good or bad) we should know about?
- What's the average days-on-market for RENTAL listings here right now (not sales)? A rising rental-DOM trend means longer vacancies and softer asking-rent achievability than the comps imply.
- What's the recent tenant-quality profile in this submarket — average credit score on applications, eviction rate, late-payment / NSF rate, and stable-employment percentage? A property-management company in the area should have these aggregated.
- How much new for-sale + rental construction is in the pipeline within 1–3 miles? Heavy new supply typically softens prices + rents 12–24 months out; constrained supply supports both.
Investment metrics
- 1% rule
- 0.79% ✗
- Cap rate
- 5.93%
- Cash-on-cash
- -1.29%
- DSCR
- 0.94
- GRM
- 10.5
CMA / ARV
- ARV (median comp)
- $226,991
- List price
- $207,500
- Delta
- -8.59%
- Verdict
- FAIR
- Comps
- 20 within 1.0 mi
Show comp detail 12 sales within ~0.75 mi
| Address | Dist | Beds/Ba | Sqft | Sold | Price | $/sf | Match |
|---|---|---|---|---|---|---|---|
| 7258 Plow Run | 0.11mi | 3/2.0 | 1,300 (+5%) | 3mo | $245,000 | $188 | 84 |
| 7718 Fox Xing | 0.31mi | 3/2.0 | 1,200 (-3%) | 1mo | $254,490 | $212 | 79 |
| 7734 Fox Xing | 0.33mi | 3/2.0 | 1,200 (-3%) | 4mo | $229,990 | $192 | 76 |
| 7709 Fern Pass | 0.35mi | 3/2.0 | 1,200 (-3%) | 4mo | $229,990 | $192 | 75 |
| 13947 Bull | 0.48mi | 3/2.0 | 1,276 (+3%) | 2mo | $189,900 | $149 | 71 |
| 7710 Fox Xing | 0.30mi | 3/2.0 | 1,412 (+14%) | 1mo | $269,990 | $191 | 62 |
| 7230 King Bnd | 0.32mi | 3/2.0 | 1,402 (+13%) | 4mo | $279,990 | $200 | 60 |
| 7708 Fern Pass | 0.30mi | 3/2.0 | 1,412 (+14%) | 4mo | $263,990 | $187 | 60 |
| 7735 Fox Xing | 0.36mi | 3/2.0 | 1,412 (+14%) | 3mo | $263,990 | $187 | 58 |
| 7733 Fern Pass | 0.35mi | 3/2.0 | 1,412 (+14%) | 5mo | $284,240 | $201 | 56 |
| 7250 King Bnd | 0.67mi | 3/2.0 | 1,402 (+13%) | 1mo | $279,990 | $200 | 46 |
| 7243 King Bnd | 0.68mi | 3/2.0 | 1,402 (+13%) | 1mo | $279,990 | $200 | 45 |
Match score weights: distance 35% · size 25% · config 20% · recency 20%. Top-matched comps best support the ARV.
Projected returns pro-forma
-0.0% appreciation · 0.0% rent growth · sell at horizon
- IRR
- -5.6%
- Equity multiple
- 0.74×
- Total profit
- $-14,912
- Equity at exit
- $60,233
- IRR
- -1.7%
- Equity multiple
- 0.83×
- Total profit
- $-9,632
- Equity at exit
- $72,388
Cash invested: $58,100 (down + closing). Projections, not guarantees.
Landlord ↔ Tenant lean methodology
- Overall (STATE)
- 87 Strongly Landlord-Friendly
- State Texas
- 87 Strongly Landlord-Friendly · R+5
- County
- — inherits STATE
- City
- — inherits STATE
ZIP-level market 78252
- Home prices YoY
- -0.0%
- Rents YoY
- -1.7%
- Active inventory
- 537
- Price-to-rent
- 10.5×
Monthly cashflow live
- Estimated rent
- $1,646 high interval (Pro) →
- Mortgage (P&I)
- −$1,088
- Tax from tax record
- −$129 /mo · $1,542/yr
- Insurance
- −$86
- HOA
- −$60
- Vacancy / Maint / Mgmt
- −$346
- Net cashflow
- $-63
Break-even live
UW: 25.0% down · 7.5% · 30yr · 1.5% tax · 5.0% vac · 8.0% maint · 8.0% mgmt
Financing live
Cash to close
- Down payment
- $51,875
- Closing costs
- $6,225
- Reserves months
- —
- Total cash needed
- —
Loan-product check · same deal, 3 products live
Conventional
25% down · 7.5% · 30yr
- Down + closing
- —
- Monthly P&I
- —
- Monthly cashflow
- —
- DSCR
- —
- Eligible?
- —
Personal DTI + credit; lowest rate.
DSCR
20% down · 8.5% · 30yr
- Down + closing
- —
- Monthly P&I
- —
- Monthly cashflow
- —
- DSCR
- —
- Eligible?
- —
No personal income docs; deal must DSCR.
Hard money
10% down · 12.0% · 12mo
- Down + closing
- —
- Monthly P&I
- —
- Monthly cashflow
- —
- DSCR
- —
- Eligible?
- —
Short-term bridge; refi at stabilization.
Rent comps 34 comps
| Address | Beds | Baths | Sqft | Rent | $/sqft | DOM | Units | Dist |
|---|---|---|---|---|---|---|---|---|
| 13850 Llama Pl San Antonio, TX | 2.0 | 2.0 | 741 | $1,250 | $1.69 | 2d | 1 | 0.02mi |
| 13802 Ostrich Run San Antonio, TX | 3.0 | 2.0 | 1300 | $1,600 | $1.23 | 17d | 1 | 0.07mi |
| 13918 Llama Pl San Antonio, TX | 2.0 | 2.0 | 741 | $1,500 | $2.02 | 43d | 1 | 0.08mi |
| 7415 Donkey Vly San Antonio, TX | 3.0 | 2.0 | 1225 | $1,500 | $1.22 | 43d | 1 | 0.08mi |
| 7411 Donkey Vly San Antonio, TX | 3.0 | 2.0 | 1125 | $1,700 | $1.51 | 43d | 1 | 0.09mi |
| 7410 Silos Rdg San Antonio, TX | 3.0 | 2.0 | 1026 | $1,195 | $1.16 | 24d | 1 | 0.10mi |
| 7258 Plow Run San Antonio, TX | 3.0 | 2.0 | 1300 | $1,475 | $1.13 | 24d | 1 | 0.10mi |
| 7258 Plow Run San Antonio, TX | 3.0 | 2.0 | 1300 | $1,575 | $1.21 | 43d | 1 | 0.10mi |
| 7247 Ox Pl San Antonio, TX | 3.0 | 2.0 | 1300 | $1,800 | $1.38 | 4d | 1 | 0.18mi |
| 7218 Ox Pl San Antonio, TX | 4.0 | 2.0 | 1492 | $1,495 | $1.00 | 2d | 1 | 0.19mi |
| 7218 Ox Pl San Antonio, TX | 4.0 | 2.0 | 1492 | $1,495 | $1.00 | 22d | 1 | 0.19mi |
| 14234 Llama Pl San Antonio, TX | 3.0 | 2.0 | 1244 | $1,500 | $1.21 | 43d | 1 | 0.20mi |
| 7226 Cultivator Way San Antonio, TX | 3.0 | 2.0 | 1300 | $1,497 | $1.15 | 24d | 1 | 0.21mi |
| 7427 Silos Trl San Antonio, TX | 3.0 | 2.0 | 1082 | $1,500 | $1.39 | 43d | 1 | 0.21mi |
| 7214 Cultivator Way San Antonio, TX | 3.0 | 2.0 | 1125 | $1,395 | $1.24 | 43d | 1 | 0.22mi |
| 7218 Duck Pond San Antonio, TX | 4.0 | 2.0 | 1492 | $1,575 | $1.06 | 22d | 1 | 0.23mi |
| 7231 Duck Pond San Antonio, TX | 4.0 | 2.0 | 1492 | $1,750 | $1.17 | 4d | 1 | 0.25mi |
| 13922 Wool Park San Antonio, TX | 3.0 | 2.0 | 1416 | $1,450 | $1.02 | 24d | 1 | 0.41mi |
| 6683 Arid Way San Antonio, TX | 3.0 | 2.0 | 1440 | $1,500 | $1.04 | 24d | 1 | 0.52mi |
| 6738 Hatchery Way San Antonio, TX | 3.0 | 2.0 | 1459 | $1,585 | $1.09 | 43d | 1 | 0.61mi |
| 6711 Hatchery Way San Antonio, TX | 3.0 | 2.0 | 1459 | $1,606 | $1.10 | 12d | 1 | 0.65mi |
| 6603 Arid Way San Antonio, TX | 3.0 | 2.0 | 1440 | $1,506 | $1.05 | 43d | 1 | 0.66mi |
| 6432 Pickaxe Way San Antonio, TX | 3.0 | 2.0 | 1266 | $1,351 | $1.07 | 24d | 1 | 0.79mi |
| 6432 Pickaxe Way San Antonio, TX | 3.0 | 2.0 | 1276 | $1,285 | $1.01 | 17d | 1 | 0.79mi |
| 6522 Vivaldi Isle San Antonio, TX | 3.0 | 2.0 | 1325 | $1,500 | $1.13 | 43d | 1 | 0.82mi |
| 6614 Dynamic Sound San Antonio, TX | 3.0 | 2.0 | 1192 | $1,500 | $1.26 | 3d | 1 | 0.85mi |
| 6614 Dynamic Sound San Antonio, TX | 3.0 | 2.0 | 1192 | $1,500 | $1.26 | 43d | 1 | 0.85mi |
| 6548 Dynamic Sound San Antonio, TX | 3.0 | 2.0 | 1323 | $1,495 | $1.13 | 24d | 1 | 0.91mi |
| 6528 Dynamic Sound San Antonio, TX | 3.0 | 2.0 | 1192 | $1,475 | $1.24 | 15d | 1 | 0.94mi |
| 6519 Dynamic Sound San Antonio, TX | 3.0 | 2.0 | 1156 | $1,700 | $1.47 | 24d | 1 | 0.95mi |
| 13727 Barn Door San Antonio, TX | 3.0 | 2.0 | 1474 | $1,800 | $1.22 | 24d | 1 | 0.96mi |
| 13067 Whisper Bnd San Antonio, TX | 3.0 | 2.0 | 1442 | $1,750 | $1.21 | 24d | 1 | 1.05mi |
| 6304 Masterson Rd Unit 3294 San Antonio, TX | 3.0 | 2.0 | 1463 | $2,209 | $1.51 | 3d | 1 | 1.05mi |
| 6304 Masterson Rd Unit 2294 San Antonio, TX | 2.0 | 2.0 | 1158 | $1,897 | $1.64 | 3d | 1 | 1.05mi |
HOA detail
- Monthly dues
- $60 · $720/yr
Listing history 18 events
-
2026-06-18days on market $207,500 Active 151 DOM
-
2026-06-17days on market $207,500 Active 150 DOM
-
2026-06-16days on market $207,500 Active 149 DOM
-
2026-06-15days on market $207,500 Active 148 DOM
-
2026-06-13days on market $207,500 Active 146 DOM
-
2026-06-09days on market $207,500 Active 142 DOM
-
2026-06-08days on market $207,500 Active 141 DOM
-
2026-06-07days on market $207,500 Active 140 DOM
-
2026-06-04days on market $207,500 Active 137 DOM
-
2026-06-03days on market $207,500 Active 136 DOM
-
2026-06-02days on market $207,500 Active 135 DOM
-
2026-06-02days on market $207,500 Active 134 DOM
-
2026-05-31days on market $207,500 Active 133 DOM
-
2026-03-21price $207,500 300-char remark
Show marketing remark (300 chars)
A SINGLE - STORY HOME FEATURING AN OPEN LIVING AREA WITH A KITCHENETTE AND A FULL BATHROOM IN THE BACK OF THE HOME. GROWING AREA RIGHT OUTSIDE 1604 AND ALL SHOPPING AREAS. MINUTES AWAY FROM CASTROVILLE AND DOWNTOWN SAN ANTONIO. HOME COMES WITH ENDLESS POTENTIAL FOR PASSIVE INCOME OR JUST FOR A HOME.
-
2026-01-18$208,000 New 300-char remark
Show marketing remark (300 chars)
A SINGLE - STORY HOME FEATURING AN OPEN LIVING AREA WITH A KITCHENETTE AND A FULL BATHROOM IN THE BACK OF THE HOME. GROWING AREA RIGHT OUTSIDE 1604 AND ALL SHOPPING AREAS. MINUTES AWAY FROM CASTROVILLE AND DOWNTOWN SAN ANTONIO. HOME COMES WITH ENDLESS POTENTIAL FOR PASSIVE INCOME OR JUST FOR A HOME.
-
2023-02-22soldstatus Sold 302-char remark
Show marketing remark (302 chars)
A single-story home featuring an open living area with a kitchenette and a full bathroom in the back of the home. Beside it is the bedroom with ample space to relax, complete with a full-sized closet. Prices and features may vary and are subject to change. Photos are for illustrative purposes only.
-
2023-01-29status Pending 302-char remark
Show marketing remark (302 chars)
A single-story home featuring an open living area with a kitchenette and a full bathroom in the back of the home. Beside it is the bedroom with ample space to relax, complete with a full-sized closet. Prices and features may vary and are subject to change. Photos are for illustrative purposes only.
-
2023-01-19$203,549 New 302-char remark
Show marketing remark (302 chars)
A single-story home featuring an open living area with a kitchenette and a full bathroom in the back of the home. Beside it is the bedroom with ample space to relax, complete with a full-sized closet. Prices and features may vary and are subject to change. Photos are for illustrative purposes only.
ⓘ Source: listings_history table (triggers on properties + properties_extension) + one-shot
backfill from property_details.listing_events for pre-trigger history.
Tax reassessment forecast TX · Resets to sale price
- Current annual tax
- $1,542 · $129/mo
- Projected year-2 tax
- $3,797 · $316/mo
- Expected delta
- +$2,255/yr (+$188/mo · 146.2%)
ⓘ Screening estimate from a state-policy table — verify with the county assessor before closing.
Climate risk First Street
- Flood 1/10 Low FEMA zone X (unshaded) · 0% chance over 30 yrs
- Wildfire 5/10 Major
- Heat 8/10 Severe 7 d/yr ≥109°F today · 22 d/yr by 30 yrs out
- Wind 8/10 Severe 80% chance of damaging wind over 30 yrs
- Air quality 2/10 Low 0 unhealthy d/yr today · 1 by 30 yrs out
Nearby sold comps map
Loading sold comps map…
Walkable amenities ~0.75 mi
Loading nearby amenities…
Taxation est. · year 1
- Rental income
- $19,756
- − Mortgage interest
- −$11,623
- − Property taxes
- −$1,542
- − Insurance
- −$1,038
- − Repairs & maintenance
- −$1,581
- − Management
- −$1,581
- − HOA
- −$720
- − Depreciation
- −$6,036
- Taxable loss
- −$4,364
- Est. tax savings @ 24.0%
- +$1,047
- After-tax cash flow
- $297/yr
For passive investors: Depreciation is non-cash, so a rental often shows a tax loss while cash-flowing — sheltering income. Rental losses are passive: they offset passive income freely, and up to $25,000/yr can offset ordinary (W-2) income if you actively participate and your MAGI is under $100k (phasing out to $0 by $150k); unused losses carry forward. On sale, claimed depreciation is recaptured at up to 25%, and gains may owe capital-gains tax (a 1031 exchange can defer both). Figures are a year-1 estimate at your 24.0% rate — not tax advice; consult a CPA.
Schools (NCES district)
- District
- Medina Valley ISD
- NCES district ID
- 4830060
- Math proficiency
- 48% ▼ -9.00%
- Reading proficiency
- 53% ▼ -2.00%
- Median HH income
- $60,596
- Composite
- 44.2/100
- National rank
- #2851
- State rank
- #148 of 826 in TX
Livability — San Antonio
- Score
- 80/100
- State rank
- #31
- US rank
- #1616
Category grades
Schools grade is shown separately in the Schools card above.
Census & demographics
- County
- Bexar County · 1,990,555 people
- City population
- 1,806,925
- Metro
- San Antonio-New Braunfels, TX
- Population (ZIP)
- 21,790
- Household income
- $85,518
- Rent vs Own
- Severe rent burden
- 152.0
Population outlook (Bexar County) Hauer SSP2
- Today (2025)
- 2,336,851 people
- By 2030
- 2,560,728 · +9.6%
- By 2040
- 3,020,569 · +29.3%
- By 2050
- 3,493,522 · +49.5%
- By 2075
- 4,668,459 · +99.8%
- By 2100
- 5,533,242 · +136.8%
Race, ethnicity, and origin ACS 2023
- Neighborhood character
- Predominantly Hispanic (68%)
- Race & ethnicity
- Hispanic / Latino 68% Two or more races 29% White 17% Black 8% Asian 3% Native American 1%
- Hispanic origin (detail)
- Mexican 61% Puerto Rican 1%
- Common ancestry
- Hispanic 2% Lithuanian 1% German 1%
- Foreign-born
- 12% · Canada, South Korea
- Languages at home
- 58% English-only · Spanish 38% Tagalog/Filipino 2% Other Indo-European 1%
Political lean MEDSL · Bexar
- 2024 margin
- Lean D (+9.8) · D 54.3% · R 44.6% · Other 1.1%
- 2008→2024 swing
- +4.2pp toward D · 2008: 5.6pp · 2024: 9.8pp
- All cycles
- 2024: D+9.8 2020: D+18.2 2016: D+13.5 2012: D+4.6 2008: D+5.6
Not yet ingested
- Civics
- —
Market trends
- HPI YoY
- ▬ -0.00%
- Current HPI
- 183.6413
- Rent YoY
- ▼ -1.67%
- Metro
- San Antonio-New Braunfels, TX
- State GDP YoY
- ▲ 3.95%
- F500 in state
- 110
Industry mix (Fortune 500 HQ in TX)
| Industry | F500 HQs | Revenue |
|---|---|---|
| Energy | 16 | $1,198B |
|
||
| Technology | 5 | $198B |
|
||
| Engineering / Construction | 4 | $72B |
|
||
| Energy Services | 3 | $60B |
|
||
| Utilities | 3 | $41B |
|
||
| Healthcare | 2 | $330B |
|
||
Price history
+1.9% since first listed5 events — show timeline
- 2026-03-21 Price Changed $207,500 LERA
- 2026-01-18 Listed $208,000 LERA
- 2023-02-22 Sold (MLS) — LERA
- 2023-01-29 Pending — LERA
- 2023-01-19 Listed $203,549 LERA
Property tax history
+24.9%/yrLatest (2025): $1,542 · -60.9% YoY. Source: county tax records.
Cash-flow waterfall
monthlySold comps — $/sqft
last 12 mo · ≤1 miLoading sold comps…