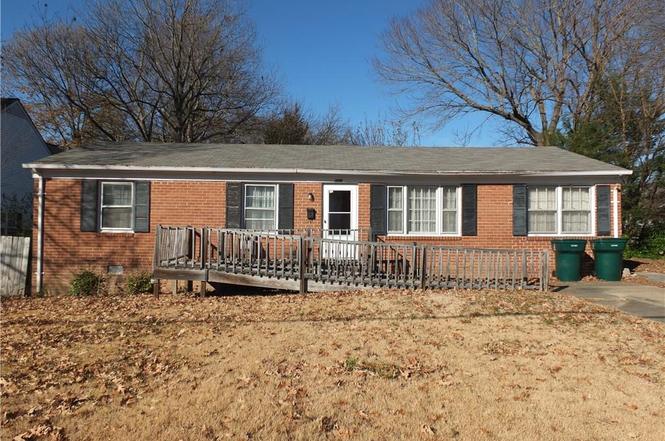
228 Colony Rd · Newport News, VA
Flood risk 1/10 · Minimal
- FEMA flood zone
- X (unshaded)
- Chance of flooding over 30 yrs
- 0.0%
- Est. flood insurance / yr
- $507 – $1,088
Fire risk 1/10 · Minimal
- Est. fire insurance / yr
- $666 – $1,236
Heat risk 8/10 · Major
- Hot days now (above 105°F)
- 7 days/yr
- Hot days in 30 yrs
- 17 days/yr
Wind risk 8/10 · Major
- Chance of severe wind over 30 yrs
- 80.0%
Air-quality risk 2/10 · Minimal
- Unhealthy air days now
- 0 days/yr
- Unhealthy air days in 30 yrs
- 1 days/yr
Risk factors via First Street. Map © Google.
Why this score? — see what drove the C+ grade
The composite is a weighted blend of 9 inputs, each scored 0–100. Each bar is that input's sub-score; the figure is the points it added to the 100-point composite (weight × sub-score).
- Cash flow +21.1/30.0
- ARV discount +15.0/15.0
- DSCR +6.7/10.0
- 1% rule +5.5/10.0
- Rent growth +5.0/5.0
- Schools +3.8/10.0
- Livability +3.8/5.0
- Condition / age +2.5/5.0
- Appreciation +0.0/10.0
$194,000
🖨 Deal sheet 📄 Offer letter ✓ Due diligence
Listing remarks
Property being sold "AS IS". Appliances convey "AS IS". Contents and debris in and on the property at settlement convey. Due diligence should be completed prior to submitting offer. No contingencies please. Property is being sold by a Conservator, and as a result, requires approval by a Comm'r of Accounts before any contract can be ratified.
Key facts
- Built 1969
- Listed 68 days
Neighborhood map
What this means for you Summary
Snapshot
- This is a 3-bed/1.5-bath single-family listed at $194k.
Deal economics
- At list price, monthly cash flow is $278 ($3k/yr) — positive.
- The deal already cash-flows at list — no discount required.
- Meets the 1% rule at list price ($2k rent vs $194k).
- Recommended offer: $182k (6.0% below list) — sets the bar for market timing.
- Cap rate 8.0% vs local median 4.2% in Newport News — top-decile yield for the area; either an underpriced asset or a hidden risk that comps aren't pricing in. Stress-test before assuming the spread holds.
Location & tenants
- Location reads 75/100 on livability (#123 in VA, #4,018 nationally) — a middle-class / working-renter tenant base. Strengths: health & safety A+, cost of living A, housing A; Watch: crime F, commute F.
- Newport News City Public School District (urban): math 34% / reading 54% proficiency, ranked #112 of 131 in VA (top 86%) — families likely to look elsewhere, expect single-tenant / working-renter base with shorter leases.
- Zoned schools: T. Ryland Sanford Elementary (math 27% / reading 47%, grade F, #933 of 1,108 statewide, top 86%, 482 students, 90% FRL); Denbigh High (math 32% / reading 65%, grade D, #301 of 319 statewide, top 95%, 1,225 students, 65% FRL) — zoned schools average 78% FRL vs 55% district-wide (23 pts higher); higher-poverty schools than district average — tighter screening recommended.
- Market conditions: Rents rising fast (+13.2%/yr); 178 active listings in the ZIP; 25 comparable units currently listed for rent nearby; rentals at typical pace (median 15d on market — plan ~3-4 weeks tenant-placement turnaround); solid renter incomes; 522 units permitted in Newport News city in 2024 (458 in 5+ unit buildings).
- This rent runs 31% of the median local income ($79k/yr) — at the standard rent-burdened threshold; future hikes will face affordability resistance.
Forward outlook
- Local home prices are declining (-3.0%/yr); year-one equity from $1k of loan paydown is wiped out by about $6k of value loss. Plan a longer hold.
- Newport News County population projected to shrink 8% by 2050 — rents likely to lag national; underwrite the cash flow, not the appreciation.
- At projected returns (-3.0% appreciation + 8.0% rent growth), your $54k cash investment doubles in ~9 years — after that, you're playing with house money.
Negotiation context
- It's been on market 68 days — a 6% lower offer ($182k) is reasonable based on typical stale-listing flexibility.
- Current owner paid $28k; list at $194k implies a 581% gain — meaningful room to come down on a strong offer.
Risks & watch-outs
- Climate carrying-cost: severe wind risk, 80% chance of damaging wind over 30y; extreme-heat days projected 7→17/yr by 2055 (HVAC capex compounding) — expect insurance premiums to compound above CPI over the hold.
Questions for the listing agent
- It's been on market 68 days. Have you received any prior offers? Is the seller open to a 6% concession, seller financing, or rate buy-down credit?
- Built in 1969 — when were the roof, HVAC, electrical panel, plumbing, and water heater last replaced?
- Why hasn't it sold? Are there any deal-killer items the seller is aware of (foundation, flood, title, zoning, code violations)?
- Is there a deadline driving the sale (1031 exchange, divorce, estate, relocation)? That informs how much negotiation room exists.
- Schools are B-rated — typically a magnet for longer-tenancy family renters. What's the average tenant stay here, and is there a school-zone premium baked into asking?
- Crime grade is F in this area — have there been break-ins, vandalism, or insurance claims at this property in the last 3 years? What carrier currently insures it and at what premium?
- What's the average days-on-market for RENTAL listings here right now (not sales)? A rising rental-DOM trend means longer vacancies and softer asking-rent achievability than the comps imply.
- What's the recent tenant-quality profile in this submarket — average credit score on applications, eviction rate, late-payment / NSF rate, and stable-employment percentage? A property-management company in the area should have these aggregated.
- How much new for-sale + rental construction is in the pipeline within 1–3 miles? Heavy new supply typically softens prices + rents 12–24 months out; constrained supply supports both.
Investment metrics
- 1% rule
- 1.05% ✓
- Cap rate
- 8.01%
- Cash-on-cash
- 6.14%
- DSCR
- 1.27
- GRM
- 7.9
CMA / ARV
- ARV (on-the-fly)
- $303,968
- Comps found
- 12
Show comp detail 12 sales within ~0.75 mi
| Address | Dist | Beds/Ba | Sqft | Sold | Price | $/sf | Match |
|---|---|---|---|---|---|---|---|
| 219 Goode Dr | 0.03mi | 3/1.5 | 1,288 (0%) | 0mo | $283,900 | $220 | 98 |
| 432 Maryle Ct | 0.22mi | 3/2.0 | 1,291 (+0%) | 2mo | $300,000 | $232 | 86 |
| 106 Olin Dr | 0.28mi | 3/2.0 | 1,278 (-1%) | 1mo | $232,000 | $182 | 83 |
| 106 Gwynn Cir | 0.31mi | 3/1.5 | 1,212 (-6%) | 0mo | $277,000 | $229 | 76 |
| 412 Dunmore Dr | 0.16mi | 3/1.5 | 1,121 (-13%) | 1mo | $305,000 | $272 | 70 |
| 521 Helm Dr | 0.56mi | 3/2.0 | 1,288 (0%) | 3mo | $334,900 | $260 | 70 |
| 426 Nicewood Dr | 0.30mi | 4/2.0 (+1) | 1,350 (+5%) | 3mo | $319,000 | $236 | 68 |
| 13 Boxwood Ln | 0.37mi | 3/2.0 | 1,429 (+11%) | 1mo | $345,000 | $241 | 62 |
| 131 Nicewood Dr | 0.63mi | 3/2.0 | 1,200 (-7%) | 0mo | $315,000 | $263 | 57 |
| 107 Picard Dr | 0.38mi | 4/1.5 (+1) | 1,447 (+12%) | 1mo | $310,000 | $214 | 56 |
| 126 Harrington Rd | 0.42mi | 3/2.0 | 1,481 (+15%) | 0mo | $350,000 | $236 | 53 |
| 592 Windjammer Cres | 0.61mi | 3/2.0 | 1,478 (+15%) | 1mo | $333,000 | $225 | 44 |
Match score weights: distance 35% · size 25% · config 20% · recency 20%. Top-matched comps best support the ARV.
Projected returns pro-forma
-3.0% appreciation · 8.0% rent growth · sell at horizon
- IRR
- -1.3%
- Equity multiple
- 0.95×
- Total profit
- $-2,915
- Equity at exit
- $28,926
- IRR
- 13.1%
- Equity multiple
- 2.28×
- Total profit
- $69,512
- Equity at exit
- $16,774
Cash invested: $54,320 (down + closing). Projections, not guarantees.
Landlord ↔ Tenant lean methodology
- Overall (STATE)
- 55 Moderately Landlord-Leaning
- State Virginia
- 55 Moderately Landlord-Leaning · D+2
- County
- — inherits STATE
- City
- — inherits STATE
ZIP-level market 23602
- Home prices YoY
- -19.2%
- Rents YoY
- 13.2%
- Active inventory
- 178
- Price-to-rent
- 7.9×
Monthly cashflow live
- Estimated rent
- $2,043 high interval (Pro) →
- Mortgage (P&I)
- −$1,017
- Tax from tax record
- −$238 /mo · $2,860/yr
- Insurance
- −$81
- HOA
- −$0
- Vacancy / Maint / Mgmt
- −$429
- Net cashflow
- $278
Break-even live
UW: 25.0% down · 7.5% · 30yr · 1.5% tax · 5.0% vac · 8.0% maint · 8.0% mgmt
Financing live
Cash to close
- Down payment
- $48,500
- Closing costs
- $5,820
- Reserves months
- —
- Total cash needed
- —
Loan-product check · same deal, 3 products live
Conventional
25% down · 7.5% · 30yr
- Down + closing
- —
- Monthly P&I
- —
- Monthly cashflow
- —
- DSCR
- —
- Eligible?
- —
Personal DTI + credit; lowest rate.
DSCR
20% down · 8.5% · 30yr
- Down + closing
- —
- Monthly P&I
- —
- Monthly cashflow
- —
- DSCR
- —
- Eligible?
- —
No personal income docs; deal must DSCR.
Hard money
10% down · 12.0% · 12mo
- Down + closing
- —
- Monthly P&I
- —
- Monthly cashflow
- —
- DSCR
- —
- Eligible?
- —
Short-term bridge; refi at stabilization.
Rent comps 25 comps
| Address | Beds | Baths | Sqft | Rent | $/sqft | DOM | Units | Dist |
|---|---|---|---|---|---|---|---|---|
| 213 Picard Dr Newport News, VA | 3.0 | 1.0 | 1200 | $1,800 | $1.50 | 3d | 1 | 0.56mi |
| 40 Bonita Dr Newport News, VA | 3.0 | 1.5 | 1097 | $1,900 | $1.73 | 23d | 1 | 0.58mi |
| 119 Cindy Cir Newport News, VA | 3.0 | 2.0 | 1579 | $2,395 | $1.52 | 4d | 1 | 0.62mi |
| 229 Telford Dr Newport News, VA | 3.0 | 2.0 | 1500 | $2,495 | $1.66 | 43d | 1 | 0.65mi |
| 13441 Warwick Blvd Newport News, VA | 2.0 | 1.5 | 1000 | $1,250 | $1.25 | 23d | 1 | 0.65mi |
| 428 Lucas Creek Rd Newport News, VA | 3.0 | 2.0 | 1616 | $2,500 | $1.55 | 4d | 1 | 0.68mi |
| 108 Nicewood Dr Newport News, VA | 3.0 | 3.0 | 1457 | $2,250 | $1.54 | 4d | 1 | 0.75mi |
| 4327 Lacy Cove Ln Newport News, VA | 3.0 | 2.5 | 1382 | $2,200 | $1.59 | 10d | 1 | 0.88mi |
| 408 Savage Dr Unit A Newport News, VA | 3.0 | 2.5 | 1380 | $1,895 | $1.37 | 43d | 1 | 0.89mi |
| 522 Knolls Dr #308 Newport News, VA | 2.0 | 2.0 | 1387 | $1,950 | $1.41 | 21d | 1 | 0.92mi |
| 522 Knolls Dr Newport News, VA | 2.0 | 2.0 | 1387 | $1,925 | $1.39 | 23d | 2 | 0.92mi |
| 168-A Heritage Way Newport News, VA | 1.0–3.0 | 1.0–2.0 | 909 | $1,630 | $1.79 | 2d | 12 | 0.97mi |
| 13302 Garden State Dr Newport News, VA | 1.0–3.0 | 1.0–2.0 | 915 | $1,750 | $1.91 | 3d | 19 | 1.02mi |
| 306 Charity Ln Newport News, VA | 4.0 | 2.5 | 1855 | $2,600 | $1.40 | 14d | 1 | 1.07mi |
| 14353 Deloice Cres Newport News, VA | 1.0–3.0 | 1.0–2.0 | 971 | $2,032 | $2.09 | 1d | 11 | 1.09mi |
| 161 Jenness Ln Newport News, VA | 3.0 | 1.5 | 1121 | $1,537 | $1.37 | 43d | 1 | 1.10mi |
| 221 Seasons Trl Newport News, VA | 2.0 | 2.0 | 1200 | $1,795 | $1.50 | 43d | 1 | 1.16mi |
| 409 Flint Dr Newport News, VA | 4.0 | 1.5 | 1415 | $2,300 | $1.63 | 43d | 1 | 1.19mi |
| 227 Ashridge Ln Newport News, VA | 2.0 | 2.0 | 1430 | $2,000 | $1.40 | 23d | 1 | 1.23mi |
| 339 Windy Ridge Ln Newport News, VA | 3.0 | 2.5 | 1200 | $2,300 | $1.92 | 4d | 1 | 1.26mi |
| 195 Bentley Dr Newport News, VA | 4.0 | 3.0 | 1748 | $2,400 | $1.37 | 43d | 1 | 1.27mi |
| 100 Springhouse Way Newport News, VA | 1.0–2.0 | 1.0–2.0 | 675 | $1,589 | $2.35 | 1d | 47 | 1.44mi |
| 14505 Old Courthouse Way Newport News, VA | 2.0 | 2.0 | 970 | $1,500 | $1.55 | 4d | 3 | 1.45mi |
| 900 Radius Way Newport News, VA | 1.0–2.0 | 1.0–2.0 | 841 | $2,143 | $2.55 | 1d | 22 | 1.46mi |
| 561 Kristy Ct Newport News, VA | 2.0 | 2.5 | 1310 | $1,900 | $1.45 | 43d | 1 | 1.48mi |
Listing history 3 events
-
2026-04-06status Under Contract
-
2026-01-28$194,000 Active
-
1974-03-28soldstatus $28,500
ⓘ Source: listings_history table (triggers on properties + properties_extension) + one-shot
backfill from property_details.listing_events for pre-trigger history.
Tax reassessment forecast VA · Resets to sale price
- Current annual tax
- $2,860 · $238/mo
- Projected year-2 tax
- $2,860 · $238/mo
- Expected delta
- $0/yr ($0/mo · 0.0%)
ⓘ Screening estimate from a state-policy table — verify with the county assessor before closing.
Climate risk First Street
- Flood 1/10 Low FEMA zone X (unshaded) · 0% chance over 30 yrs
- Wildfire 1/10 Low
- Heat 8/10 Severe 7 d/yr ≥105°F today · 17 d/yr by 30 yrs out
- Wind 8/10 Severe 80% chance of damaging wind over 30 yrs
- Air quality 2/10 Low 0 unhealthy d/yr today · 1 by 30 yrs out
Nearby sold comps map
Loading sold comps map…
Walkable amenities ~0.75 mi
Loading nearby amenities…
Taxation est. · year 1
- Rental income
- $24,521
- − Mortgage interest
- −$10,867
- − Property taxes
- −$2,860
- − Insurance
- −$970
- − Repairs & maintenance
- −$1,962
- − Management
- −$1,962
- − Depreciation
- −$5,644
- Taxable income
- $258
- Est. tax owed @ 24.0%
- −$62
- After-tax cash flow
- $3,272/yr
For passive investors: Depreciation is non-cash, so a rental often shows a tax loss while cash-flowing — sheltering income. Rental losses are passive: they offset passive income freely, and up to $25,000/yr can offset ordinary (W-2) income if you actively participate and your MAGI is under $100k (phasing out to $0 by $150k); unused losses carry forward. On sale, claimed depreciation is recaptured at up to 25%, and gains may owe capital-gains tax (a 1031 exchange can defer both). Figures are a year-1 estimate at your 24.0% rate — not tax advice; consult a CPA.
Schools (NCES district)
- District
- Newport News City Public School District
- NCES district ID
- 5102640
- Math proficiency
- 34% ▼ -37.00%
- Reading proficiency
- 54% ▼ -10.00%
- Median HH income
- $49,644
- Composite
- 37.7/100
- National rank
- #4360
- State rank
- #112 of 131 in VA
Livability — Newport News
- Score
- 75/100
- State rank
- #123
- US rank
- #4018
Category grades
Schools grade is shown separately in the Schools card above.
Census & demographics
- Census place
- Newport News, VA
- County
- Newport News City · 178,950 people
- City population
- 178,950
- Metro
- Virginia Beach-Norfolk-Newport News, VA-NC
- Population (ZIP)
- 42,265
- Household income
- $79,475
- Rent vs Own
- Severe rent burden
- 1696.0
Population outlook (Newport News County) Hauer SSP2
- Today (2025)
- 181,076 people
- By 2030
- 179,683 · -0.8%
- By 2040
- 174,649 · -3.5%
- By 2050
- 167,407 · -7.5%
- By 2075
- 147,597 · -18.5%
- By 2100
- 122,144 · -32.5%
Race, ethnicity, and origin ACS 2023
- Neighborhood character
- Diverse neighborhood (Simpson 0.69)
- Race & ethnicity
- White 42% Black 34% Hispanic / Latino 12% Two or more races 10% Asian 5%
- Hispanic origin (detail)
- Mexican 5% Puerto Rican 3%
- Common ancestry
- Romanian 2% Lithuanian 1% Slovak 1%
- Foreign-born
- 10% · Canada, South Korea, Vietnam
- Languages at home
- 86% English-only · Spanish 6% Other Asian/Pacific 1% Russian/Polish/Slavic 1%
Political lean MEDSL · Newport News
- 2024 margin
- Strong D (+28.8) · D 63.7% · R 34.9% · Other 1.4%
- 2008→2024 swing
- +0.1pp no change · 2008: 28.7pp · 2024: 28.8pp
- All cycles
- 2024: D+28.8 2020: D+32.9 2016: D+25.4 2012: D+30.0 2008: D+28.7
Not yet ingested
- Civics
- —
Market trends
- HPI YoY
- ▼ -67.28%
- Current HPI
- 283.0889
- Rent YoY
- ▲ 13.22%
- Metro
- Virginia Beach-Norfolk-Newport News, VA-NC
- State GDP YoY
- ▲ 2.40%
- F500 in state
- 50
Industry mix (Fortune 500 HQ in VA)
| Industry | F500 HQs | Revenue |
|---|---|---|
| Aerospace / Defense | 4 | $236B |
|
||
| Technology / Defense | 3 | $32B |
|
||
| Financial Services | 2 | $176B |
|
||
| Utilities | 2 | $27B |
|
||
| Insurance | 2 | $25B |
|
||
| Technology | 2 | $15B |
|
||
Price history
+580.7% since first listed3 events — show timeline
- 2026-04-06 Pending — REINMLS
- 2026-01-28 Listed $194,000 REINMLS
- 1974-03-28 Sold (Public Records) $28,500 Public Records
Property tax history
+4.2%/yrLatest (2026): $2,860 · +7.7% YoY. Source: county tax records.
Cash-flow waterfall
monthlySold comps — $/sqft
last 12 mo · ≤1 miLoading sold comps…