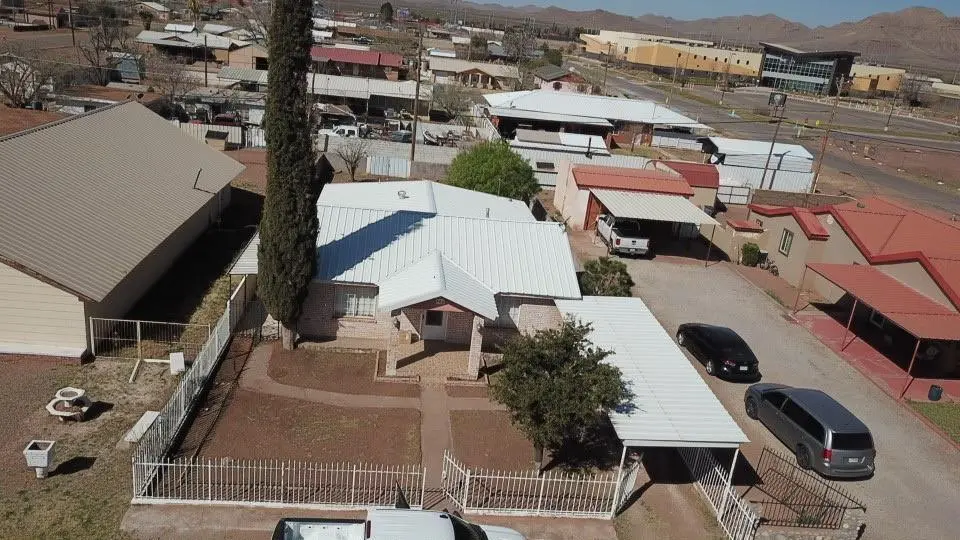
607 La Caverna St · Van Horn, TX
Flood risk 1/10 · Minimal
- FEMA flood zone
- —
- Chance of flooding over 30 yrs
- 0.0%
- Est. flood insurance / yr
- —
Fire risk 3/10 · Minor
- Est. fire insurance / yr
- $1,222 – $2,270
Heat risk 5/10 · Moderate
- Hot days now (above 100°F)
- 3 days/yr
- Hot days in 30 yrs
- 8 days/yr
Wind risk 1/10 · Minimal
- Chance of severe wind over 30 yrs
- —
Air-quality risk 1/10 · Minimal
- Unhealthy air days now
- 0 days/yr
- Unhealthy air days in 30 yrs
- 0 days/yr
Risk factors via First Street. Map © Google.
Why this score? — see what drove the D grade
The composite is a weighted blend of 9 inputs, each scored 0–100. Each bar is that input's sub-score; the figure is the points it added to the 100-point composite (weight × sub-score).
- Appreciation +9.2/10.0
- Cash flow +9.1/30.0
- ARV discount +7.5/15.0
- Livability +3.0/5.0
- DSCR +2.5/10.0
- Rent growth +2.5/5.0
- Condition / age +2.5/5.0
- Schools +2.4/10.0
- 1% rule +1.7/10.0
$180,000
🖨 Deal sheet 📄 Offer letter ✓ Due diligence
Listing remarks MLS
607 La Caverna Street in Van Horn offers a fully furnished, turnkey opportunity with 3 bedrooms, 2 bathrooms, and 1,518 square feet of living space. This well-equipped home features a bonus room or office, perimeter fencing with a carport, and two storage sheds for added functionality. All kitchen and laundry appliances convey with the sale and were new in 2022, making this property move-in ready from day one. Great option for full-time residence, weekend getaway, or investment opportunity!
Key facts
- Perimeter fencing
- Kitchen appliances
- Bonus room
Tags
Neighborhood map
What this means for you Summary
Snapshot
- This is a 3-bed/1.0-bath single-family listed at $180k.
Deal economics
- At list price, monthly cash flow is $-138 ($-2k/yr) — negative.
- To cash-flow at today's rent, offer at most $156k (13.5% below list).
- To meet the 1% rule (rent ≥ 1% of price), the offer needs to be $120k (33.3% below list).
- Recommended offer: $120k (33.3% below list) — sets the bar for 1% rule.
Location & tenants
- Location reads 60/100 on livability (#1,070 in TX) — a middle-class / working-renter tenant base. Strengths: cost of living A+, housing A, crime A-; Watch: schools F, amenities F, commute F.
- Culberson County-Allamoore ISD (rural): math 20% / reading 31% proficiency, ranked #1,070 of 1,141 in TX (top 94%) — low school quality limits family demand, transient renter base, plan for 1-2y turnover; 69% free/reduced lunch — lower-income household profile, screen leases tightly.
- Market conditions: 40 active listings in the ZIP; 25 units permitted in Culberson County in 2024 (0 in 5+ unit buildings).
Forward outlook
- In year one you build about $16k of equity ($1k loan paydown + $15k appreciation (8.5% local appreciation)).
- Culberson County population projected at -34% by 2050 — secular population decline; favor cash flow + early exit over multi-decade hold.
- By year 3, paydown + projected appreciation supports a ~$41k cash-out refi (75% LTV) — recoverable capital for the next deal without selling this one.
Negotiation context
- It's been on market 60 days — a 3% lower offer ($175k) is reasonable based on typical stale-listing flexibility.
Risks & watch-outs
- Watch-outs: built in 1947 — expect roof / HVAC / electrical / plumbing capex.
- Climate carrying-cost: extreme-heat days projected 3→8/yr by 2055 (HVAC capex compounding) — expect insurance premiums to compound above CPI over the hold.
Questions for the listing agent
- What do current leases actually rent for vs. the listed asking? Can we see a recent rent roll and the last 12 months of T-12 income?
- It's been on market 60 days. Have you received any prior offers? Is the seller open to a 33% concession, seller financing, or rate buy-down credit?
- Built in 1947 — when were the roof, HVAC, electrical panel, plumbing, and water heater last replaced?
- Is there a deadline driving the sale (1031 exchange, divorce, estate, relocation)? That informs how much negotiation room exists.
- Schools are F-rated, which usually means shorter tenancies and higher turnover. Who's the typical renter profile here, and what's been the actual vacancy rate?
- The area grade is low — what's the realistic commute time and amenity access for the typical tenant pool here? Any planned neighborhood developments (good or bad) we should know about?
- What's the average days-on-market for RENTAL listings here right now (not sales)? A rising rental-DOM trend means longer vacancies and softer asking-rent achievability than the comps imply.
- What's the recent tenant-quality profile in this submarket — average credit score on applications, eviction rate, late-payment / NSF rate, and stable-employment percentage? A property-management company in the area should have these aggregated.
- How much new for-sale + rental construction is in the pipeline within 1–3 miles? Heavy new supply typically softens prices + rents 12–24 months out; constrained supply supports both.
Investment metrics
- 1% rule
- 0.67% ✗
- Cap rate
- 5.38%
- Cash-on-cash
- -3.28%
- DSCR
- 0.85
- GRM
- 12.5
CMA / ARV
No comps found within radius.
Projected returns pro-forma
8.46% appreciation · 3.0% rent growth · sell at horizon
- IRR
- 18.5%
- Equity multiple
- 2.40×
- Total profit
- $70,668
- Equity at exit
- $142,459
- IRR
- 17.4%
- Equity multiple
- 5.20×
- Total profit
- $211,756
- Equity at exit
- $288,403
Cash invested: $50,400 (down + closing). Projections, not guarantees.
Landlord ↔ Tenant lean methodology
- Overall (STATE)
- 87 Strongly Landlord-Friendly
- State Texas
- 87 Strongly Landlord-Friendly · R+5
- County
- — inherits STATE
- City
- — inherits STATE
ZIP-level market 79855
- Home prices YoY
- 7.6%
- Active inventory
- 40
- Price-to-rent
- 12.5×
Monthly cashflow live
- Estimated rent
- $1,201 medium interval (Pro) →
- Mortgage (P&I)
- −$944
- Tax from tax record
- −$67 /mo · $806/yr
- Insurance
- −$75
- HOA
- −$0
- Vacancy / Maint / Mgmt
- −$252
- Net cashflow
- $-138
Break-even live
UW: 25.0% down · 7.5% · 30yr · 1.5% tax · 5.0% vac · 8.0% maint · 8.0% mgmt
Financing live
Cash to close
- Down payment
- $45,000
- Closing costs
- $5,400
- Reserves months
- —
- Total cash needed
- —
Loan-product check · same deal, 3 products live
Conventional
25% down · 7.5% · 30yr
- Down + closing
- —
- Monthly P&I
- —
- Monthly cashflow
- —
- DSCR
- —
- Eligible?
- —
Personal DTI + credit; lowest rate.
DSCR
20% down · 8.5% · 30yr
- Down + closing
- —
- Monthly P&I
- —
- Monthly cashflow
- —
- DSCR
- —
- Eligible?
- —
No personal income docs; deal must DSCR.
Hard money
10% down · 12.0% · 12mo
- Down + closing
- —
- Monthly P&I
- —
- Monthly cashflow
- —
- DSCR
- —
- Eligible?
- —
Short-term bridge; refi at stabilization.
Listing history 17 events
-
2026-06-19days on market $180,000 Active 60 DOM
-
2026-06-18days on market $180,000 Active 59 DOM
-
2026-06-17days on market $180,000 Active 58 DOM
-
2026-06-16days on market $180,000 Active 57 DOM
-
2026-06-15days on market $180,000 Active 56 DOM
-
2026-06-14days on market $180,000 Active 54 DOM
-
2026-06-13days on market $180,000 Active 53 DOM
-
2026-06-10days on market $180,000 Active 51 DOM
-
2026-06-09days on market $180,000 Active 50 DOM
-
2026-06-08days on market $180,000 Active 49 DOM
-
2026-06-07pricedays on market $180,000 Active 48 DOM
-
2026-06-02days on market $190,000 Active 43 DOM
-
2026-06-01days on market $190,000 Active 42 DOM
-
2026-05-31days on market $190,000 Active 41 DOM
-
2026-05-30days on market $190,000 Active 40 DOM
-
2026-04-20$190,000 Active 495-char remark
Show marketing remark (495 chars)
607 La Caverna Street in Van Horn offers a fully furnished, turnkey opportunity with 3 bedrooms, 2 bathrooms, and 1,518 square feet of living space. This well-equipped home features a bonus room or office, perimeter fencing with a carport, and two storage sheds for added functionality. All kitchen and laundry appliances convey with the sale and were new in 2022, making this property move-in ready from day one. Great option for full-time residence, weekend getaway, or investment opportunity!
-
2017-08-25soldstatus
ⓘ Source: listings_history table (triggers on properties + properties_extension) + one-shot
backfill from property_details.listing_events for pre-trigger history.
Tax reassessment forecast TX · Resets to sale price
- Current annual tax
- $806 · $67/mo
- Projected year-2 tax
- $3,294 · $274/mo
- Expected delta
- +$2,488/yr (+$207/mo · 308.8%)
ⓘ Screening estimate from a state-policy table — verify with the county assessor before closing.
Climate risk First Street
- Flood 1/10 Low 0% chance over 30 yrs
- Wildfire 3/10 Moderate
- Heat 5/10 Major 3 d/yr ≥100°F today · 8 d/yr by 30 yrs out
- Wind 1/10 Low
- Air quality 1/10 Low 0 unhealthy d/yr today · 0 by 30 yrs out
Nearby sold comps map
Loading sold comps map…
Walkable amenities ~0.75 mi
Loading nearby amenities…
Taxation est. · year 1
- Rental income
- $14,406
- − Mortgage interest
- −$10,083
- − Property taxes
- −$806
- − Insurance
- −$900
- − Repairs & maintenance
- −$1,153
- − Management
- −$1,153
- − Depreciation
- −$5,236
- Taxable loss
- −$4,924
- Est. tax savings @ 24.0%
- +$1,182
- After-tax cash flow
- $-470/yr
For passive investors: Depreciation is non-cash, so a rental often shows a tax loss while cash-flowing — sheltering income. Rental losses are passive: they offset passive income freely, and up to $25,000/yr can offset ordinary (W-2) income if you actively participate and your MAGI is under $100k (phasing out to $0 by $150k); unused losses carry forward. On sale, claimed depreciation is recaptured at up to 25%, and gains may owe capital-gains tax (a 1031 exchange can defer both). Figures are a year-1 estimate at your 24.0% rate — not tax advice; consult a CPA.
Schools (NCES district)
- District
- Culberson County-Allamoore ISD
- NCES district ID
- 4815990
- Math proficiency
- 20% ▲ 6.00%
- Reading proficiency
- 31% ▲ 7.00%
- Median HH income
- $36,898
- Composite
- 24.22/100
- National rank
- #13136
- State rank
- #1070 of 1141 in TX
Livability — Van Horn
- Score
- 60/100
- State rank
- #1070
- US rank
- #18971
Category grades
Schools grade is shown separately in the Schools card above.
Census & demographics
- Census place
- Van Horn, TX
- Population (ZIP)
- 2,159
Population outlook (Culberson County) Hauer SSP2
- Today (2025)
- 1,952 people
- By 2030
- 1,793 · -8.1%
- By 2040
- 1,518 · -22.2%
- By 2050
- 1,279 · -34.5%
- By 2075
- 861 · -55.9%
- By 2100
- 603 · -69.1%
Race, ethnicity, and origin ACS 2023
- Neighborhood character
- Predominantly Hispanic (87%)
- Race & ethnicity
- Hispanic / Latino 87% Two or more races 44% White 9% Native American 3% Asian 1%
- Hispanic origin (detail)
- Mexican 80% Cuban 1%
- Common ancestry
- Slovak 3%
- Foreign-born
- 10% · Canada
- Languages at home
- 36% English-only · Spanish 64% Tagalog/Filipino 1%
Political lean MEDSL · Culberson
- 2024 margin
- R (+16.9) · D 40.9% · R 57.8% · Other 1.4%
- 2008→2024 swing
- -47.9pp toward R · 2008: 31.0pp · 2024: -16.9pp
- All cycles
- 2024: R+16.9 2020: D+2.7 2016: D+22.8 2012: D+31.1 2008: D+31.0
Not yet ingested
- Civics
- —
Market trends
- HPI YoY
- ▲ 8.46%
- Current HPI
- 119.7418
- Rent YoY
- —
- Metro
- —
- State GDP YoY
- ▲ 3.95%
- F500 in state
- 110
Industry mix (Fortune 500 HQ in TX)
| Industry | F500 HQs | Revenue |
|---|---|---|
| Energy | 16 | $1,198B |
|
||
| Technology | 5 | $198B |
|
||
| Engineering / Construction | 4 | $72B |
|
||
| Energy Services | 3 | $60B |
|
||
| Utilities | 3 | $41B |
|
||
| Healthcare | 2 | $330B |
|
||
Price history
2 events — show timeline
- 2026-04-20 Listed $190,000 ODMLS
- 2017-08-25 Sold (Public Records) — Public Records
Property tax history
-5.7%/yrLatest (2025): $806 · +6.0% YoY. Source: county tax records.
Cash-flow waterfall
monthlySold comps — $/sqft
last 12 mo · ≤1 miLoading sold comps…