10 Lancer Ln · Alton, NH
Flood risk 1/10 · Minimal
- FEMA flood zone
- X
- Chance of flooding over 30 yrs
- 0.0%
- Est. flood insurance / yr
- $507 – $1,088
Fire risk 3/10 · Minor
- Est. fire insurance / yr
- $507 – $941
Heat risk 3/10 · Minor
- Hot days now (above 92°F)
- 7 days/yr
- Hot days in 30 yrs
- 16 days/yr
Wind risk 4/10 · Minor
- Chance of severe wind over 30 yrs
- 12.0%
Air-quality risk 2/10 · Minimal
- Unhealthy air days now
- 1 days/yr
- Unhealthy air days in 30 yrs
- 1 days/yr
Risk factors via First Street. Map © Google.
Why this score? — see what drove the B grade
The composite is a weighted blend of 9 inputs, each scored 0–100. Each bar is that input's sub-score; the figure is the points it added to the 100-point composite (weight × sub-score).
- Cash flow +27.5/30.0
- Appreciation +10.0/10.0
- DSCR +9.6/10.0
- ARV discount +7.5/15.0
- 1% rule +6.6/10.0
- Schools +3.7/10.0
- Livability +2.9/5.0
- Rent growth +2.5/5.0
- Condition / age +2.5/5.0
$149,900
🖨 Deal sheet (PDF) 📄 Offer letter ✓ Due diligence
Listing remarks
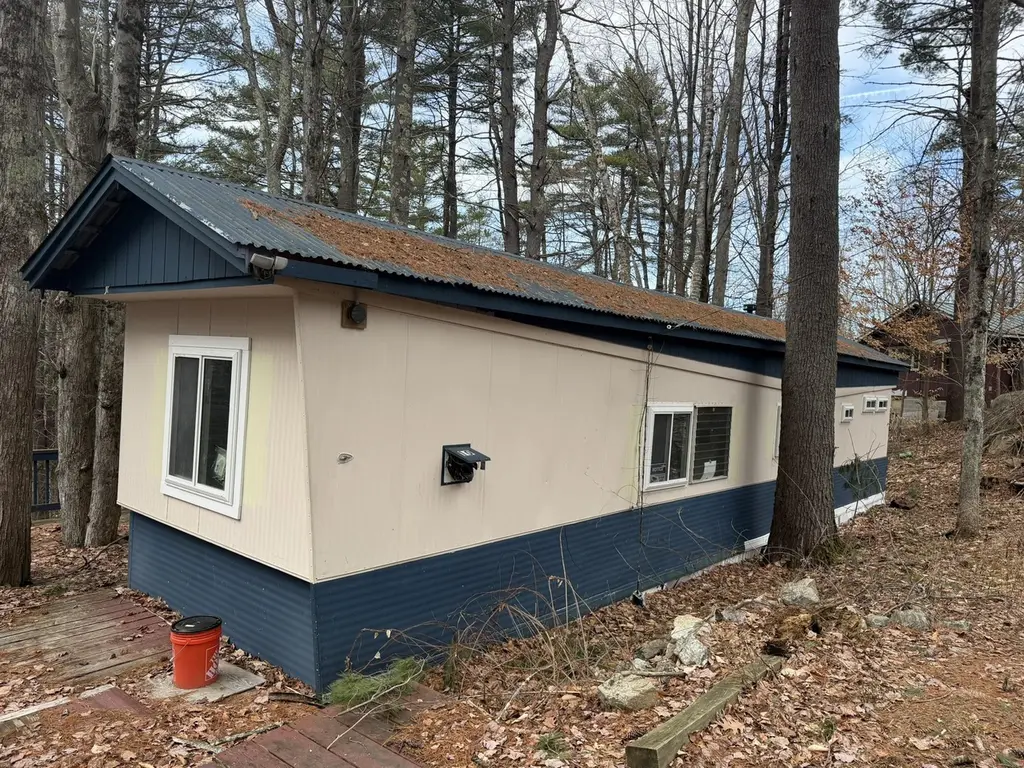
Rare opportunity to own in the heart of the Lakes Region at an affordable price point! Located just a short 3-minute walk to the public beach in low-tax Alton Bay, this property offers tremendous potential for investors, contractors, or buyers looking to create their own getaway in one of New Hampshire’s most sought-after destinations. Much of the heavy lifting has already been completed, including a 200-amp electrical upgrade, new replacement windows (many already installed), and new interior walls. Kitchen cabinetry and components are on site and ready for installation. Bring your vision and finish what the sellers started. Affordable opportunities this close to the water in Alton B
Key facts
- New interior walls
- 7,840 sq ft lot
- Built 1975
Tags
Property features AI
Exterior
- Utilities: Public water; Private sewer; 200 Amp electrical service; Cable internet available; Cable, LP/bottled gas, and phone service
- Home design: Manufactured / Mobile home; Single-story (manufactured home); Existing construction
- Construction: Built in 1975; Metal siding; Corrugated metal roof; Lot number 74
- Exterior features: Sloping, wooded lot; Gravel driveway; Private road frontage (privately maintained)
Interior
- Bathrooms: 1 full bathroom
- Heating & cooling: Forced air heating
- Interior features: 6 total rooms
Neighborhood map
What this means for you Summary
Snapshot
- This is a 3-bed/1.0-bath manufactured listed at $150k.
Deal economics
- At list price, monthly cash flow is $442 ($5k/yr) — positive.
- The deal already cash-flows at list — no discount required.
- Meets the 1% rule at list price ($2k rent vs $150k).
- Recommended offer: $145k (3.0% below list) — sets the bar for market timing.
- Cap rate 9.8% vs local median 1.4% in Alton — top-decile yield for the area; either an underpriced asset or a hidden risk that comps aren't pricing in. Stress-test before assuming the spread holds.
Location & tenants
- Location reads 57/100 on livability (#93 in NH) — a working-class tenant base; expect higher turnover. Strengths: cost of living A+, health & safety A+, crime A; Watch: amenities F, commute F, employment F.
- Alton School District (rural): math 34% / reading 42% proficiency, ranked #139 of 171 in NH (top 81%) — families likely to look elsewhere, expect single-tenant / working-renter base with shorter leases.
- Market conditions: 40 active listings in the ZIP; 301 units permitted in Belknap County in 2024 (32 in 5+ unit buildings).
Forward outlook
- In year one you build about $16k of equity ($1k loan paydown + $15k appreciation (10.0% local appreciation)).
- Belknap County population projected at -10% by 2050 — secular population decline; favor cash flow + early exit over multi-decade hold.
- At projected returns (10.0% appreciation + 3.0% rent growth), your $42k cash investment doubles in ~2 years — after that, you're playing with house money.
- By year 3, paydown + projected appreciation supports a ~$41k cash-out refi (75% LTV) — recoverable capital for the next deal without selling this one.
Negotiation context
- It's been on market 32 days — a 3% lower offer ($145k) is reasonable based on typical stale-listing flexibility.
Questions for the listing agent
- It's been on market 32 days. Have you received any prior offers? Is the seller open to a 3% concession, seller financing, or rate buy-down credit?
- Built in 1975 — when were the roof, HVAC, electrical panel, plumbing, and water heater last replaced?
- Is there a deadline driving the sale (1031 exchange, divorce, estate, relocation)? That informs how much negotiation room exists.
- What's the average days-on-market for RENTAL listings here right now (not sales)? A rising rental-DOM trend means longer vacancies and softer asking-rent achievability than the comps imply.
- What's the recent tenant-quality profile in this submarket — average credit score on applications, eviction rate, late-payment / NSF rate, and stable-employment percentage? A property-management company in the area should have these aggregated.
- How much new for-sale + rental construction is in the pipeline within 1–3 miles? Heavy new supply typically softens prices + rents 12–24 months out; constrained supply supports both.
Investment metrics
- 1% rule
- 1.16% ✓
- Cap rate
- 9.83%
- Cash-on-cash
- 12.62%
- DSCR
- 1.56
- GRM
- 7.2
CMA / ARV
No comps found within radius.
Projected returns pro-forma
10.0% appreciation · 3.0% rent growth · sell at horizon
- IRR
- 33.5%
- Equity multiple
- 3.61×
- Total profit
- $109,722
- Equity at exit
- $135,042
- IRR
- 28.9%
- Equity multiple
- 8.17×
- Total profit
- $300,920
- Equity at exit
- $291,223
Cash invested: $41,972 (down + closing). Projections, not guarantees.
Landlord ↔ Tenant lean methodology
- Overall (STATE)
- 56 Moderately Landlord-Leaning
- State New Hampshire
- 56 Moderately Landlord-Leaning · D+1
- County
- — inherits STATE
- City
- — inherits STATE
ZIP-level market 03809
- Home prices YoY
- 19.4%
- Active inventory
- 40
- Price-to-rent
- 7.2×
Monthly cashflow live
- Estimated rent
- $1,735 medium interval (Pro) →
- Mortgage (P&I)
- −$786
- Tax from tax record
- −$80 /mo · $963/yr
- Insurance
- −$62
- HOA
- −$0
- Vacancy / Maint / Mgmt
- −$364
- Net cashflow
- $442
Break-even live
Sensitivity live
| Price | -10% $526 | -5% $484 | +0% $442 | +5% $399 | +10% $357 |
|---|---|---|---|---|---|
| Rent | -10% $305 | -5% $373 | +0% $442 | +5% $510 | +10% $579 |
| Rate | -1.0pp $517 | -0.5pp $480 | base $442 | +0.5pp $403 | +1.0pp $363 |
UW: 25.0% down · 7.5% · 30yr · 1.5% tax · 5.0% vac · 8.0% maint · 8.0% mgmt
Financing live
Cash to close
- Down payment
- $37,475
- Closing costs
- $4,497
- Reserves months
- —
- Total cash needed
- —
Loan-product check · same deal, 3 products live
Conventional
25% down · 7.5% · 30yr
- Down + closing
- —
- Monthly P&I
- —
- Monthly cashflow
- —
- DSCR
- —
- Eligible?
- —
Personal DTI + credit; lowest rate.
DSCR
20% down · 8.5% · 30yr
- Down + closing
- —
- Monthly P&I
- —
- Monthly cashflow
- —
- DSCR
- —
- Eligible?
- —
No personal income docs; deal must DSCR.
Hard money
10% down · 12.0% · 12mo
- Down + closing
- —
- Monthly P&I
- —
- Monthly cashflow
- —
- DSCR
- —
- Eligible?
- —
Short-term bridge; refi at stabilization.
Listing history 17 events
-
2026-06-21days on market $149,900 Active 32 DOM
-
2026-06-21days on market $149,900 Active 31 DOM
-
2026-06-18days on market $149,900 Active 29 DOM
-
2026-06-17pricedays on market $149,900 Active 28 DOM
-
2026-06-16days on market $159,900 Active 27 DOM
-
2026-06-15days on market $159,900 Active 26 DOM
-
2026-06-13days on market $159,900 Active 24 DOM
-
2026-06-12days on market $159,900 Active 23 DOM
-
2026-06-09days on market $159,900 Active 20 DOM
-
2026-06-08days on market $159,900 Active 19 DOM
-
2026-06-07days on market $159,900 Active 18 DOM
-
2026-06-07days on market $159,900 Active 17 DOM
-
2026-06-04pricedays on market $159,900 Active 14 DOM
-
2026-06-02pricedays on market $169,900 Active 13 DOM
-
2026-06-01days on market $174,900 Active 12 DOM
-
2026-05-31days on market $174,900 Active 11 DOM
-
2026-05-20$179,000 Active
ⓘ Source: listings_history table (triggers on properties + properties_extension) + one-shot
backfill from property_details.listing_events for pre-trigger history.
Tax reassessment forecast NH · Partial reset (capped growth)
- Current annual tax
- $963 · $80/mo
- Projected year-2 tax
- $2,115 · $176/mo
- Expected delta
- +$1,152/yr (+$96/mo · 119.7%)
ⓘ Screening estimate from a state-policy table — verify with the county assessor before closing.
Climate risk First Street
- Flood 1/10 Low FEMA zone X · 0% chance over 30 yrs
- Wildfire 3/10 Moderate
- Heat 3/10 Moderate 7 d/yr ≥92°F today · 16 d/yr by 30 yrs out
- Wind 4/10 Moderate 12% chance of damaging wind over 30 yrs
- Air quality 2/10 Low 1 unhealthy d/yr today · 1 by 30 yrs out
Nearby sold comps map
Loading sold comps map…
Walkable amenities ~0.75 mi
Loading nearby amenities…
Taxation est. · year 1
- Rental income
- $20,815
- − Mortgage interest
- −$8,397
- − Property taxes
- −$963
- − Insurance
- −$750
- − Repairs & maintenance
- −$1,665
- − Management
- −$1,665
- − Depreciation
- −$4,361
- Taxable income
- $3,015
- Est. tax owed @ 24.0%
- −$724
- After-tax cash flow
- $4,575/yr
For passive investors: Depreciation is non-cash, so a rental often shows a tax loss while cash-flowing — sheltering income. Rental losses are passive: they offset passive income freely, and up to $25,000/yr can offset ordinary (W-2) income if you actively participate and your MAGI is under $100k (phasing out to $0 by $150k); unused losses carry forward. On sale, claimed depreciation is recaptured at up to 25%, and gains may owe capital-gains tax (a 1031 exchange can defer both). Figures are a year-1 estimate at your 24.0% rate — not tax advice; consult a CPA.
Schools (NCES district)
- District
- Alton School District
- NCES district ID
- 3301440
- Math proficiency
- 34% ▼ -8.00%
- Reading proficiency
- 42% ▼ -3.00%
- Median HH income
- $66,442
- Composite
- 36.9/100
- National rank
- #9132
- State rank
- #139 of 171 in NH
Livability — Alton
- Score
- 57/100
- State rank
- #93
- US rank
- #21895
Category grades
Schools grade is shown separately in the Schools card above.
Census & demographics
- Population (ZIP)
- 3,684
Population outlook (Belknap County) Hauer SSP2
- Today (2025)
- 60,702 people
- By 2030
- 60,353 · -0.6%
- By 2040
- 58,264 · -4.0%
- By 2050
- 54,533 · -10.2%
- By 2075
- 45,622 · -24.8%
- By 2100
- 33,772 · -44.4%
Race, ethnicity, and origin ACS 2023
- Neighborhood character
- Predominantly White (93%)
- Race & ethnicity
- White 93% Hispanic / Latino 3% Black 2% Two or more races 2%
- Common ancestry
- Lithuanian 13% Portuguese 3% Romanian 2%
- Foreign-born
- 2% · Canada
Political lean MEDSL · Belknap
- 2024 margin
- R (+13.1) · D 43.1% · R 56.1%
- 2008→2024 swing
- -14.2pp toward R · 2008: 1.2pp · 2024: -13.1pp
- All cycles
- 2024: R+13.1 2020: R+10.4 2016: R+16.8 2012: R+5.0 2008: D+1.2
Not yet ingested
- Civics
- —
Market trends
- HPI YoY
- ▲ 75.10%
- Current HPI
- 461.4011
- Rent YoY
- —
- Metro
- —
- State GDP YoY
- —
- F500 in state
- 0
Price history
1 event — show timeline
- 2026-05-20 Listed $179,000 PrimeMLS
Property tax history
+3.8%/yrLatest (2024): $963 · -1.5% YoY. Source: county tax records.
Cash-flow waterfall
monthlySold comps — $/sqft
last 12 mo · ≤1 miLoading sold comps…