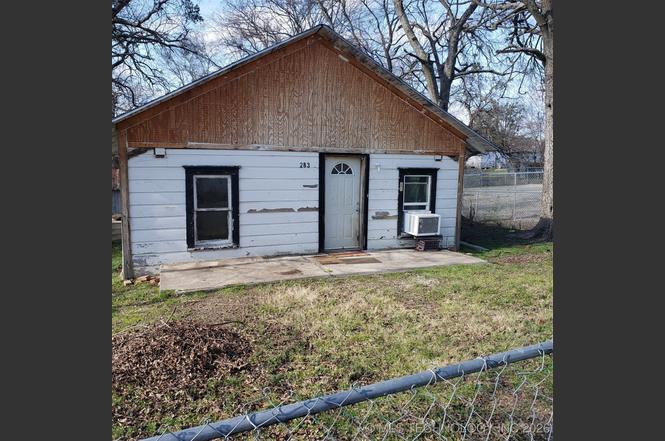
283 Highland St · Stringtown, OK
Flood risk No data
- FEMA flood zone
- —
- Chance of flooding over 30 yrs
- —
- Est. flood insurance / yr
- —
Fire risk No data
- Est. fire insurance / yr
- —
Heat risk No data
- Hot days now (above threshold)
- —
- Hot days in 30 yrs
- —
Wind risk No data
- Chance of severe wind over 30 yrs
- —
Air-quality risk No data
- Unhealthy air days now
- —
- Unhealthy air days in 30 yrs
- —
Risk factors via First Street. Map © Google.
Why this score? — see what drove the B grade
The composite is a weighted blend of 9 inputs, each scored 0–100. Each bar is that input's sub-score; the figure is the points it added to the 100-point composite (weight × sub-score).
- Cash flow +30.0/30.0
- 1% rule +10.0/10.0
- DSCR +10.0/10.0
- ARV discount +8.4/15.0
- Appreciation +5.7/10.0
- Livability +3.1/5.0
- Rent growth +2.5/5.0
- Condition / age +2.5/5.0
- Schools +2.4/10.0
$55,000
🖨 Deal sheet 📄 Offer letter ✓ Due diligence
Listing remarks
Cute Home in Stringtown on corner lot, close to school, 3 bedroom, 1 bath. The home has new plumbing, electric has been rewired throughout, new roof & updated insulated windows. Partially fenced with chain link.
Key facts
- New plumbing
- Partially fenced
- Electric rewired
Tags
Property features AI
Exterior
- Security: No safety shelter
- Utilities: Electricity available; Natural gas available; Public water; Public sewer
- Home design: Single-story; Faces east; Crawlspace foundation
- Construction: Wood siding with wood frame construction; Asphalt fiberglass roof; Built per public records
- Exterior features: Porch; Satellite dish; Partial chain link fencing; Corner lot
Interior
- Kitchen: Oven; Range; Stove; Gas range connection; Gas oven connection
- Flooring: Carpet; Wood
- Bathrooms: 1 full bathroom
- Heating & cooling: Gas heating with multiple heating units; Window air conditioning units
- Interior features: High ceilings; Insulated vinyl windows; Gas range and gas oven connections
- Laundry & utility: Washer hookup; Electric dryer hookup; Gas water heater
Neighborhood map
What this means for you Summary
Snapshot
- This is a 3-bed/1.0-bath single-family listed at $55k.
Deal economics
- At list price, monthly cash flow is $378 ($5k/yr) — positive.
- The deal already cash-flows at list — no discount required.
- Meets the 1% rule at list price ($960 rent vs $55k).
- Recommended offer: $48k (12.0% below list) — sets the bar for market timing.
Location & tenants
- Location reads 62/100 on livability (#252 in OK) — a middle-class / working-renter tenant base. Strengths: cost of living A+, crime A, housing A; Watch: employment D+, schools F, amenities F.
- Stringtown (rural): math 20% / reading 30% proficiency, ranked #344 of 513 in OK (top 67%) — low school quality limits family demand, transient renter base, plan for 1-2y turnover; 65% free/reduced lunch — lower-income household profile, screen leases tightly.
- Market conditions: 7 active listings in the ZIP.
Forward outlook
- In year one you build about $1k of equity ($380 loan paydown + $727 appreciation (1.3% local appreciation)).
- Atoka County population projected at -18% by 2050 — secular population decline; favor cash flow + early exit over multi-decade hold.
- At projected returns (1.3% appreciation + 3.0% rent growth), your $15k cash investment doubles in ~3 years — after that, you're playing with house money.
Negotiation context
- It's been on market 133 days — a 12% lower offer ($48k) is reasonable based on typical stale-listing flexibility.
- 2 sale attempts with the ask held roughly flat each time — persistent listings suggest the price (not the market) is what's stuck; bring a comps-based counter.
Risks & watch-outs
- Watch-outs: built in 1930 — expect roof / HVAC / electrical / plumbing capex.
Questions for the listing agent
- It's been on market 133 days. Have you received any prior offers? Is the seller open to a 12% concession, seller financing, or rate buy-down credit?
- Built in 1930 — when were the roof, HVAC, electrical panel, plumbing, and water heater last replaced?
- Why hasn't it sold? Are there any deal-killer items the seller is aware of (foundation, flood, title, zoning, code violations)?
- Is there a deadline driving the sale (1031 exchange, divorce, estate, relocation)? That informs how much negotiation room exists.
- Schools are F-rated, which usually means shorter tenancies and higher turnover. Who's the typical renter profile here, and what's been the actual vacancy rate?
- What's the average days-on-market for RENTAL listings here right now (not sales)? A rising rental-DOM trend means longer vacancies and softer asking-rent achievability than the comps imply.
- What's the recent tenant-quality profile in this submarket — average credit score on applications, eviction rate, late-payment / NSF rate, and stable-employment percentage? A property-management company in the area should have these aggregated.
- How much new for-sale + rental construction is in the pipeline within 1–3 miles? Heavy new supply typically softens prices + rents 12–24 months out; constrained supply supports both.
Investment metrics
- 1% rule
- 1.75% ✓
- Cap rate
- 14.55%
- Cash-on-cash
- 29.48%
- DSCR
- 2.31
- GRM
- 4.8
CMA / ARV
- ARV (on-the-fly)
- $56,160
- Comps found
- 1
Show comp detail 1 sale within ~0.75 mi
| Address | Dist | Beds/Ba | Sqft | Sold | Price | $/sf | Match |
|---|---|---|---|---|---|---|---|
| 345 E Cumberland Ave | 0.42mi | 2/1.0 (-1) | 936 (-13%) | 0mo | $49,000 | $52 | 53 |
Match score weights: distance 35% · size 25% · config 20% · recency 20%. Top-matched comps best support the ARV.
Projected returns pro-forma
1.32% appreciation · 3.0% rent growth · sell at horizon
- IRR
- 32.4%
- Equity multiple
- 2.69×
- Total profit
- $26,015
- Equity at exit
- $19,704
- IRR
- 34.4%
- Equity multiple
- 5.23×
- Total profit
- $65,162
- Equity at exit
- $26,919
Cash invested: $15,400 (down + closing). Projections, not guarantees.
Landlord ↔ Tenant lean methodology
- Overall (STATE)
- 83 Strongly Landlord-Friendly
- State Oklahoma
- 83 Strongly Landlord-Friendly · R+20
- County
- — inherits STATE
- City
- — inherits STATE
ZIP-level market 74569
- Home prices YoY
- 0.6%
- Active inventory
- 7
- Price-to-rent
- 4.8×
Monthly cashflow live
- Estimated rent
- $960 medium interval (Pro) →
- Mortgage (P&I)
- −$288
- Tax est. 1.5%
- −$69 /mo · $825/yr
- Insurance
- −$23
- HOA
- −$0
- Vacancy / Maint / Mgmt
- −$202
- Net cashflow
- $378
Break-even live
UW: 25.0% down · 7.5% · 30yr · 1.5% tax · 5.0% vac · 8.0% maint · 8.0% mgmt
Financing live
Cash to close
- Down payment
- $13,750
- Closing costs
- $1,650
- Reserves months
- —
- Total cash needed
- —
Loan-product check · same deal, 3 products live
Conventional
25% down · 7.5% · 30yr
- Down + closing
- —
- Monthly P&I
- —
- Monthly cashflow
- —
- DSCR
- —
- Eligible?
- —
Personal DTI + credit; lowest rate.
DSCR
20% down · 8.5% · 30yr
- Down + closing
- —
- Monthly P&I
- —
- Monthly cashflow
- —
- DSCR
- —
- Eligible?
- —
No personal income docs; deal must DSCR.
Hard money
10% down · 12.0% · 12mo
- Down + closing
- —
- Monthly P&I
- —
- Monthly cashflow
- —
- DSCR
- —
- Eligible?
- —
Short-term bridge; refi at stabilization.
Listing history 18 events
-
2026-06-18days on market $55,000 Active 133 DOM
-
2026-06-17days on market $55,000 Active 132 DOM
-
2026-06-16days on market $55,000 Active 131 DOM
-
2026-06-15days on market $55,000 Active 130 DOM
-
2026-06-13days on market $55,000 Active 128 DOM
-
2026-06-12days on market $55,000 Active 127 DOM
-
2026-06-09days on market $55,000 Active 124 DOM
-
2026-06-08days on market $55,000 Active 123 DOM
-
2026-06-08days on market $55,000 Active 122 DOM
-
2026-06-05days on market $55,000 Active 120 DOM
-
2026-06-04days on market $55,000 Active 118 DOM
-
2026-06-02days on market $55,000 Active 117 DOM
-
2026-06-01days on market $55,000 Active 116 DOM
-
2026-05-31days on market $55,000 Active 115 DOM
-
2026-02-05historical
-
2026-02-05$55,000 Active
-
2025-07-01price $55,000
-
2025-02-05$60,000 Active
ⓘ Source: listings_history table (triggers on properties + properties_extension) + one-shot
backfill from property_details.listing_events for pre-trigger history.
Nearby sold comps map
Loading sold comps map…
Walkable amenities ~0.75 mi
Loading nearby amenities…
Taxation est. · year 1
- Rental income
- $11,521
- − Mortgage interest
- −$3,081
- − Property taxes
- −$825
- − Insurance
- −$275
- − Repairs & maintenance
- −$922
- − Management
- −$922
- − Depreciation
- −$1,600
- Taxable income
- $3,897
- Est. tax owed @ 24.0%
- −$935
- After-tax cash flow
- $3,605/yr
For passive investors: Depreciation is non-cash, so a rental often shows a tax loss while cash-flowing — sheltering income. Rental losses are passive: they offset passive income freely, and up to $25,000/yr can offset ordinary (W-2) income if you actively participate and your MAGI is under $100k (phasing out to $0 by $150k); unused losses carry forward. On sale, claimed depreciation is recaptured at up to 25%, and gains may owe capital-gains tax (a 1031 exchange can defer both). Figures are a year-1 estimate at your 24.0% rate — not tax advice; consult a CPA.
Schools (NCES district)
- District
- Stringtown
- NCES district ID
- 4029010
- Math proficiency
- 20% ▼ -5.00%
- Reading proficiency
- 30% ▼ -5.00%
- Median HH income
- $39,562
- Composite
- 24.08/100
- National rank
- #13164
- State rank
- #344 of 513 in OK
Livability — Stringtown
- Score
- 62/100
- State rank
- #252
- US rank
- #16682
Category grades
Schools grade is shown separately in the Schools card above.
Census & demographics
- Census place
- Stringtown, OK
- Population (ZIP)
- 610
Population outlook (Atoka County) Hauer SSP2
- Today (2025)
- 13,004 people
- By 2030
- 12,522 · -3.7%
- By 2040
- 11,595 · -10.8%
- By 2050
- 10,709 · -17.6%
- By 2075
- 8,957 · -31.1%
- By 2100
- 7,452 · -42.7%
Race, ethnicity, and origin ACS 2023
- Neighborhood character
- Diverse neighborhood (Simpson 0.66)
- Race & ethnicity
- White 57% Two or more races 18% Black 15% Native American 11%
- Common ancestry
- Slovak 2% Iranian 1% Scotch-Irish 1%
Political lean MEDSL · Atoka
- 2024 margin
- Solid R (+71.6) · D 13.8% · R 85.3%
- 2008→2024 swing
- -27.7pp toward R · 2008: -43.9pp · 2024: -71.6pp
- All cycles
- 2024: R+71.6 2020: R+70.4 2016: R+65.4 2012: R+48.0 2008: R+43.9
Not yet ingested
- Civics
- —
Market trends
- HPI YoY
- ▲ 1.32%
- Current HPI
- 230.1399
- Rent YoY
- —
- Metro
- —
- State GDP YoY
- ▲ 1.55%
- F500 in state
- 6
Industry mix (Fortune 500 HQ in OK)
| Industry | F500 HQs | Revenue |
|---|---|---|
| Energy | 3 | $48B |
|
||
Price history
-8.3% since first listed4 events — show timeline
- 2026-02-05 Listed $55,000 MLS Technology, Inc.
- 2026-02-05 Listing Removed — MLS Technology, Inc.
- 2025-07-01 Price Changed $55,000 MLS Technology, Inc.
- 2025-02-05 Listed $60,000 MLS Technology, Inc.
Cash-flow waterfall
monthlySold comps — $/sqft
last 12 mo · ≤1 miLoading sold comps…