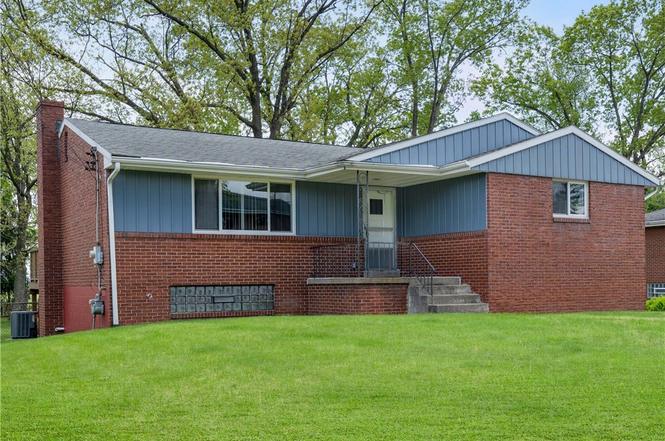
442 Englewood Dr · Glenshaw, PA
Flood risk 1/10 · Minimal
- FEMA flood zone
- X (unshaded)
- Chance of flooding over 30 yrs
- 0.0%
- Est. flood insurance / yr
- $473 – $860
Fire risk 1/10 · Minimal
- Est. fire insurance / yr
- $511 – $949
Heat risk 3/10 · Minor
- Hot days now (above 97°F)
- 7 days/yr
- Hot days in 30 yrs
- 17 days/yr
Wind risk 2/10 · Minimal
- Chance of severe wind over 30 yrs
- —
Air-quality risk 4/10 · Minor
- Unhealthy air days now
- 4 days/yr
- Unhealthy air days in 30 yrs
- 5 days/yr
Risk factors via First Street. Map © Google.
Why this score? — see what drove the D+ grade
The composite is a weighted blend of 9 inputs, each scored 0–100. Each bar is that input's sub-score; the figure is the points it added to the 100-point composite (weight × sub-score).
- Cash flow +13.6/30.0
- ARV discount +10.1/15.0
- Schools +5.2/10.0
- DSCR +4.1/10.0
- Livability +3.8/5.0
- 1% rule +3.5/10.0
- Rent growth +3.0/5.0
- Condition / age +2.5/5.0
- Appreciation +0.0/10.0
$263,000
🖨 Deal sheet (PDF) 📄 Offer letter ✓ Due diligence
Listing remarks
VERY CLEAN ALL BRICK RANCH- NICE LEVEL LOT WITH A FENCHED BACK YARD - FINISHED GAMEROOM AREA- MOVE IN CONDITION WITH SOME UPDATES, NEWER WINDOWS, UPDATED FURNACE AND A/C, DEAD END STREET LOCATION - SHOULD BE HARDWOOD FLOORS UNDER THE CARPET -NICE SIZE DECK OFF OF THE DINING ROOM
Key facts
- 0.23 acre lot
- Garage
- Built 1958
Property features AI
Exterior
- Parking: Attached garage; Built-in parking with garage door opener; 2 total parking spaces
- Utilities: Public water; Public sewer
- Home design: Single-story home; Resale property; Asphalt roof; Brick construction; Home warranty included
- Construction: Brick exterior; Asphalt roof; Has basement
- Exterior features: Lot approximately 0.2328 acres
Interior
- Kitchen: Cooktop; Dishwasher; Disposal; Refrigerator
- Bedrooms: Primary/main level bedroom (11 x 10); Second/main level bedroom (11 x 10); Third/main level bedroom (13 x 11)
- Flooring: Hardwood; Carpet
- Bathrooms: 2 full bathrooms
- Heating & cooling: Forced air heating (gas); Central air conditioning
- Interior features: Central vacuum; Game room; Multi-pane windows
- Laundry & utility: Washer; Dryer; Laundry room in basement; Interior-entry basement
Neighborhood map
What this means for you Summary
Snapshot
- This is a 3-bed/1.0-bath single-family listed at $263k.
Deal economics
- At list price, monthly cash flow is $14 ($173/yr) — positive.
- The deal already cash-flows at list — no discount required.
- To meet the 1% rule (rent ≥ 1% of price), the offer needs to be $223k (15.4% below list).
- Recommended offer: $223k (15.4% below list) — sets the bar for 1% rule.
- Cap rate 6.4% vs local median 4.0% in Glenshaw — top-decile yield for the area; either an underpriced asset or a hidden risk that comps aren't pricing in. Stress-test before assuming the spread holds.
Location & tenants
- Location reads 75/100 on livability (#427 in PA, #3,894 nationally) — a middle-class / working-renter tenant base. Strengths: employment A+, cost of living A+, housing A+; Watch: health & safety D, amenities F, commute F.
- North Hills SD (suburban): math 48% / reading 72% proficiency, ranked #70 of 539 in PA (top 13%) — acceptable for families but not a draw, mixed tenant base, ~2y average lease; only 20% free/reduced lunch — higher-income household profile.
- Zoned schools: Ross El Sch (math 57% / reading 78%, grade B+, #192 of 1,518 statewide, top 13%, 501 students, 20% FRL); North Hills Ms (math 37% / reading 70%, grade C+, #86 of 512 statewide, top 17%, 1,070 students, 28% FRL); North Hills Shs (math 71% / reading 75%, grade B+, #35 of 437 statewide, top 8%, 1,383 students, 24% FRL) — zoned schools at 24% FRL track the district average.
- Market conditions: Rents rising (+2.2%/yr); 107 active listings in the ZIP; 3 comparable units currently listed for rent nearby; rentals leasing fast (median 4d on market — plan ~1-2 weeks tenant-placement turnaround); solid renter incomes; 2,996 units permitted in Allegheny County in 2024 (1,588 in 5+ unit buildings).
Forward outlook
- Local home prices are declining (-3.0%/yr); year-one equity from $2k of loan paydown is wiped out by about $8k of value loss. Plan a longer hold.
Negotiation context
- It's been on market 30 days — a 2% lower offer ($259k) is reasonable based on typical stale-listing flexibility.
- 2 sale attempts with the ask held roughly flat each time — persistent listings suggest the price (not the market) is what's stuck; bring a comps-based counter.
- Current owner paid $34k; list at $263k implies a 685% gain — meaningful room to come down on a strong offer.
Risks & watch-outs
- Watch-outs: built in 1958 — expect roof / HVAC / electrical / plumbing capex.
Questions for the listing agent
- Built in 1958 — when were the roof, HVAC, electrical panel, plumbing, and water heater last replaced?
- Is there a deadline driving the sale (1031 exchange, divorce, estate, relocation)? That informs how much negotiation room exists.
- Schools are B-rated — typically a magnet for longer-tenancy family renters. What's the average tenant stay here, and is there a school-zone premium baked into asking?
- The area grade is low — what's the realistic commute time and amenity access for the typical tenant pool here? Any planned neighborhood developments (good or bad) we should know about?
- What's the average days-on-market for RENTAL listings here right now (not sales)? A rising rental-DOM trend means longer vacancies and softer asking-rent achievability than the comps imply.
- What's the recent tenant-quality profile in this submarket — average credit score on applications, eviction rate, late-payment / NSF rate, and stable-employment percentage? A property-management company in the area should have these aggregated.
- How much new for-sale + rental construction is in the pipeline within 1–3 miles? Heavy new supply typically softens prices + rents 12–24 months out; constrained supply supports both.
Investment metrics
- 1% rule
- 0.85% ✗
- Cap rate
- 6.36%
- Cash-on-cash
- 0.24%
- DSCR
- 1.01
- GRM
- 9.8
CMA / ARV
- ARV (on-the-fly)
- $278,810
- Comps found
- 12
Show comp detail 12 sales within ~0.75 mi
| Address | Dist | Beds/Ba | Sqft | Sold | Price | $/sf | Match |
|---|---|---|---|---|---|---|---|
| 208 Andrew Dr | 0.16mi | 3/2.0 | 1,238 (+9%) | 7mo | $222,000 | $179 | 68 |
| 160 Siebert Rd | 0.61mi | 3/2.0 | 1,148 (+1%) | 6mo | $325,000 | $283 | 61 |
| 557 Thompson Run Rd | 0.22mi | 3/2.5 | 1,300 (+14%) | 2mo | $365,000 | $281 | 58 |
| 133 Sunset Ln | 0.47mi | 2/1.5 (-1) | 1,200 (+5%) | 8mo | $305,000 | $254 | 56 |
| 102 Crest Ln | 0.25mi | 3/1.5 | 975 (-14%) | 8mo | $249,000 | $255 | 55 |
| 1630 Anderson Rd | 0.53mi | 3/2.0 | 1,176 (+3%) | 15mo | $257,000 | $219 | 53 |
| 106 Mcginley Dr | 0.22mi | 3/2.0 | 1,275 (+12%) | 15mo | $264,500 | $207 | 53 |
| 152 Easley Rd | 0.43mi | 2/1.5 (-1) | 1,240 (+9%) | 6mo | $265,000 | $214 | 53 |
| 574 Sangree Rd | 0.47mi | 2/1.5 (-1) | 1,051 (-8%) | 12mo | $250,000 | $238 | 48 |
| 356 Goldsmith Rd | 0.48mi | 3/1.0 | 1,304 (+15%) | 7mo | $291,000 | $223 | 47 |
| 2805 Clearview Dr | 0.75mi | 4/2.0 (+1) | 1,248 (+10%) | 1mo | $307,000 | $246 | 39 |
| 111 Sycamore Dr | 0.72mi | 3/1.0 | 1,288 (+13%) | 14mo | $315,000 | $245 | 33 |
Match score weights: distance 35% · size 25% · config 20% · recency 20%. Top-matched comps best support the ARV.
Projected returns pro-forma
-3.0% appreciation · 2.16% rent growth · sell at horizon
- IRR
- -16.8%
- Equity multiple
- 0.41×
- Total profit
- $-43,575
- Equity at exit
- $39,214
- IRR
- -10.3%
- Equity multiple
- 0.40×
- Total profit
- $-44,334
- Equity at exit
- $22,739
Cash invested: $73,640 (down + closing). Projections, not guarantees.
Landlord ↔ Tenant lean methodology
- Overall (STATE)
- 62 Landlord-Friendly
- State Pennsylvania
- 62 Landlord-Friendly · EVEN
- County
- — inherits STATE
- City
- — inherits STATE
ZIP-level market 15237
- Rents YoY
- 2.2%
- Active inventory
- 107
- Price-to-rent
- 9.8×
Monthly cashflow live
- Estimated rent
- $2,225 medium interval (Pro) →
- Mortgage (P&I)
- −$1,379
- Tax from tax record
- −$255 /mo · $3,058/yr
- Insurance
- −$110
- HOA
- −$0
- Vacancy / Maint / Mgmt
- −$467
- Net cashflow
- $14
Break-even live
Sensitivity live
| Price | -10% $163 | -5% $89 | +0% $14 | +5% $-60 | +10% $-134 |
|---|---|---|---|---|---|
| Rent | -10% $-161 | -5% $-73 | +0% $14 | +5% $102 | +10% $190 |
| Rate | -1.0pp $147 | -0.5pp $81 | base $14 | +0.5pp $-54 | +1.0pp $-123 |
UW: 25.0% down · 7.5% · 30yr · 1.5% tax · 5.0% vac · 8.0% maint · 8.0% mgmt
Financing live
Cash to close
- Down payment
- $65,750
- Closing costs
- $7,890
- Reserves months
- —
- Total cash needed
- —
Loan-product check · same deal, 3 products live
Conventional
25% down · 7.5% · 30yr
- Down + closing
- —
- Monthly P&I
- —
- Monthly cashflow
- —
- DSCR
- —
- Eligible?
- —
Personal DTI + credit; lowest rate.
DSCR
20% down · 8.5% · 30yr
- Down + closing
- —
- Monthly P&I
- —
- Monthly cashflow
- —
- DSCR
- —
- Eligible?
- —
No personal income docs; deal must DSCR.
Hard money
10% down · 12.0% · 12mo
- Down + closing
- —
- Monthly P&I
- —
- Monthly cashflow
- —
- DSCR
- —
- Eligible?
- —
Short-term bridge; refi at stabilization.
Rent comps 3 comps
| Address | Beds | Baths | Sqft | Rent | $/sqft | DOM | Units | Dist |
|---|---|---|---|---|---|---|---|---|
| 3001 McKnight East Dr Pittsburgh, PA | 1.0–2.0 | 1.0–2.0 | 917 | $2,005 | $2.19 | 3d | 14 | 1.08mi |
| 300 Hillview Dr McKnight, PA | 3.0 | 1.0–2.5 | 1210 | $3,502 | $2.89 | 3d | 37 | 1.32mi |
| 100 Hilands Pl Unit L169 Pittsburgh, PA | 2.0 | 1.0 | 850 | $995 | $1.17 | 45d | 1 | 1.37mi |
Listing history 14 events
-
2026-06-16statusdays on market $263,000 Pending 30 DOM
-
2026-06-15days on market $263,000 Contingent 29 DOM
-
2026-06-13days on market $263,000 Contingent 27 DOM
-
2026-06-09days on market $263,000 Contingent 23 DOM
-
2026-06-08days on market $263,000 Contingent 22 DOM
-
2026-06-07days on market $263,000 Contingent 21 DOM
-
2026-06-05days on market $263,000 Contingent 18 DOM
-
2026-06-03days on market $263,000 Contingent 17 DOM
-
2026-06-02days on market $263,000 Contingent 16 DOM
-
2026-06-01days on market $263,000 Contingent 15 DOM
-
2026-05-31days on market $263,000 Contingent 14 DOM
-
2026-05-18Contingent
-
2026-05-17$263,000
-
1976-10-26soldstatus $33,500
ⓘ Source: listings_history table (triggers on properties + properties_extension) + one-shot
backfill from property_details.listing_events for pre-trigger history.
Tax reassessment forecast PA · Partial reset (capped growth)
- Current annual tax
- $3,058 · $255/mo
- Projected year-2 tax
- $3,607 · $301/mo
- Expected delta
- +$548/yr (+$46/mo · 17.9%)
ⓘ Screening estimate from a state-policy table — verify with the county assessor before closing.
Climate risk First Street
- Flood 1/10 Low FEMA zone X (unshaded) · 0% chance over 30 yrs
- Wildfire 1/10 Low
- Heat 3/10 Moderate 7 d/yr ≥97°F today · 17 d/yr by 30 yrs out
- Wind 2/10 Low
- Air quality 4/10 Moderate 4 unhealthy d/yr today · 5 by 30 yrs out
Nearby sold comps map
Loading sold comps map…
Walkable amenities ~0.75 mi
Loading nearby amenities…
Taxation est. · year 1
- Rental income
- $26,705
- − Mortgage interest
- −$14,732
- − Property taxes
- −$3,058
- − Insurance
- −$1,315
- − Repairs & maintenance
- −$2,136
- − Management
- −$2,136
- − Depreciation
- −$7,651
- Taxable loss
- −$4,324
- Est. tax savings @ 24.0%
- +$1,038
- After-tax cash flow
- $1,211/yr
For passive investors: Depreciation is non-cash, so a rental often shows a tax loss while cash-flowing — sheltering income. Rental losses are passive: they offset passive income freely, and up to $25,000/yr can offset ordinary (W-2) income if you actively participate and your MAGI is under $100k (phasing out to $0 by $150k); unused losses carry forward. On sale, claimed depreciation is recaptured at up to 25%, and gains may owe capital-gains tax (a 1031 exchange can defer both). Figures are a year-1 estimate at your 24.0% rate — not tax advice; consult a CPA.
Schools (NCES district)
- District
- North Hills SD
- NCES district ID
- 4217220
- Math proficiency
- 48% ▼ -20.00%
- Reading proficiency
- 72% ▼ -10.00%
- Median HH income
- $60,841
- Composite
- 52.02/100
- National rank
- #1637
- State rank
- #70 of 539 in PA
Livability — Glenshaw
- Score
- 75/100
- State rank
- #427
- US rank
- #3894
Category grades
Schools grade is shown separately in the Schools card above.
Census & demographics
- County
- Allegheny County · 1,022,028 people
- Metro
- Pittsburgh, PA
- Population (ZIP)
- 43,588
- Household income
- $109,895
- Rent vs Own
- Severe rent burden
- 693.0
Population outlook (Allegheny County) Hauer SSP2
- Today (2025)
- 1,250,282 people
- By 2030
- 1,256,482 · +0.5%
- By 2040
- 1,256,318 · +0.5%
- By 2050
- 1,244,169 · -0.5%
- By 2075
- 1,197,693 · -4.2%
- By 2100
- 1,093,187 · -12.6%
Race, ethnicity, and origin ACS 2023
- Neighborhood character
- Predominantly White (88%)
- Race & ethnicity
- White 88% Asian 6% Two or more races 3% Hispanic / Latino 3% Black 1%
- Common ancestry
- Romanian 8% Italian 2% Slovak 2%
- Foreign-born
- 8% · Canada, China
- Languages at home
- 90% English-only · Other Indo-European 2% Chinese 2% Spanish 2%
Political lean MEDSL · Allegheny
- 2024 margin
- Strong D (+20.3) · D 59.7% · R 39.4%
- 2008→2024 swing
- +4.8pp toward D · 2008: 15.5pp · 2024: 20.3pp
- All cycles
- 2024: D+20.3 2020: D+20.4 2016: D+16.4 2012: D+14.4 2008: D+15.5
Not yet ingested
- Civics
- —
Market trends
- HPI YoY
- ▼ -218.78%
- Current HPI
- 269.5446
- Rent YoY
- ▲ 2.16%
- Metro
- Pittsburgh, PA
- State GDP YoY
- ▲ 1.68%
- F500 in state
- 34
Industry mix (Fortune 500 HQ in PA)
| Industry | F500 HQs | Revenue |
|---|---|---|
| Healthcare | 2 | $309B |
|
||
| Insurance | 2 | $27B |
|
||
| Telecommunications / Media | 1 | $124B |
|
||
| Industrial Distribution | 1 | $22B |
|
||
| Financial Services | 1 | $20B |
|
||
| Chemicals / Materials | 1 | $18B |
|
||
Price history
+685.1% since first listed3 events — show timeline
- 2026-05-18 Listed — West Penn MLS
- 2026-05-17 Listed $263,000 West Penn MLS
- 1976-10-26 Sold (Public Records) $33,500 Public Records
Property tax history
+1.8%/yrLatest (2026): $3,058 · +1.0% YoY. Source: county tax records.
Cash-flow waterfall
monthlySold comps — $/sqft
last 12 mo · ≤1 miLoading sold comps…