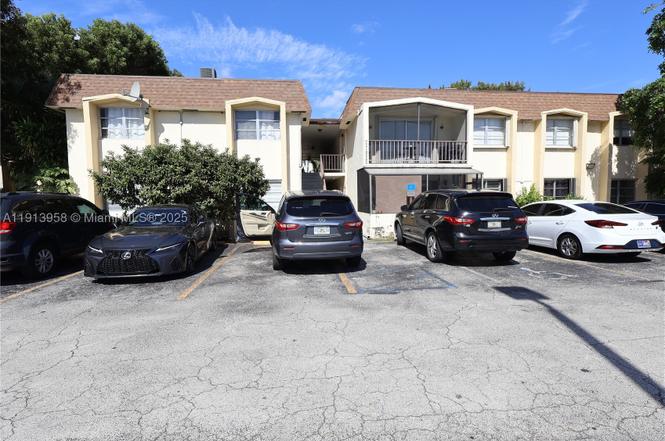
7825 Miller Dr Unit C211 · Glenvar Heights, FL
Flood risk 5/10 · Moderate
- FEMA flood zone
- X (unshaded)
- Chance of flooding over 30 yrs
- 0.24%
- Est. flood insurance / yr
- $507 – $1,088
Fire risk 1/10 · Minimal
- Est. fire insurance / yr
- $947 – $1,759
Heat risk 10/10 · Severe
- Hot days now (above 105°F)
- 7 days/yr
- Hot days in 30 yrs
- 31 days/yr
Wind risk 10/10 · Severe
- Chance of severe wind over 30 yrs
- 99.0%
Air-quality risk 2/10 · Minimal
- Unhealthy air days now
- 1 days/yr
- Unhealthy air days in 30 yrs
- 1 days/yr
Risk factors via First Street. Map © Google.
Why this score? — see what drove the D grade
The composite is a weighted blend of 9 inputs, each scored 0–100. Each bar is that input's sub-score; the figure is the points it added to the 100-point composite (weight × sub-score).
- Cash flow +10.4/30.0
- 1% rule +9.7/10.0
- ARV discount +7.5/15.0
- Schools +4.2/10.0
- Livability +4.0/5.0
- DSCR +3.0/10.0
- Rent growth +2.7/5.0
- Condition / age +2.5/5.0
- Appreciation +0.0/10.0
$194,900
🖨 Deal sheet (PDF) 📄 Offer letter ✓ Due diligence
Listing remarks
Rare opportunity to own this split 3 bedrooms 2 bathrooms corner unit apartment in Lakewood Villas. Beautiful balcony to enjoy the days along with your family or friends. Centrally located with fast access to Palmetto Expressway, 874, Walking distance to famous Tropical Park, minutes to the Baptist Hospital, and Dadeland Mall. The association offer a laundry room downstairs and just steps to the clubhouse and the pool. Too much to mention!
Key facts
- Steps to pool
- Corner unit
- Steps to clubhouse
Tags
Property features AI
Finance
- Financial info: Pets allowed conditionally; restrictions may apply
- HOA & community: Monthly association fee; Association fee includes management, amenities, structure maintenance, parking, and pool(s); Association amenities: clubhouse, laundry, pool
Exterior
- Utilities: Cable available
- Home design: Condo/Apartment (attached); 2 stories total; Faces east; Entry located on 2
- Construction: Block construction; Resale property
- Exterior features: Balcony; Open balcony/porch
Interior
- Bedrooms: Entry level: 2
- Flooring: Laminate flooring; Tile flooring
- Bathrooms: 2 full bathrooms
- Heating & cooling: Central heating (electric); Central air conditioning (electric)
- Interior features: Unfurnished; Living/dining room; Custom mirrors; Tub with shower; Walk-in closet(s)
- Laundry & utility: Common area laundry
Neighborhood map
What this means for you Summary
Snapshot
- This is a 3-bed/2.0-bath condo listed at $195k.
Deal economics
- At list price, monthly cash flow is $-102 ($-1k/yr) — negative.
- To cash-flow at today's rent, offer at most $180k (7.6% below list).
- Meets the 1% rule at list price ($3k rent vs $195k).
- Recommended offer: $172k (12.0% below list) — sets the bar for market timing.
Location & tenants
- Location reads 79/100 on livability (#137 in FL, #2,054 nationally) — a middle-class / working-renter tenant base. Strengths: crime A+, commute A+, employment A; Watch: amenities F, cost of living F.
- Miami-Dade (suburban): math 45% / reading 54% proficiency, ranked #40 of 73 in FL (top 55%) — families likely to look elsewhere, expect single-tenant / working-renter base with shorter leases; 64% free/reduced lunch — lower-income household profile, screen leases tightly.
- Zoned schools: South Miami K-8 Center (math 55% / reading 67%, grade B, #653 of 2,144 statewide, top 31%, 534 students, 51% FRL); South Miami Middle School (math 59% / reading 67%, grade B+, #111 of 571 statewide, top 20%, 725 students, 44% FRL); South Miami Senior High School (math 19% / reading 35%, grade F, #478 of 667 statewide, top 73%, 1,507 students, 59% FRL).
- Market conditions: Rents flat; 191 active listings in the ZIP; 14 comparable units currently listed for rent nearby; rentals at typical pace (median 20d on market — plan ~3-4 weeks tenant-placement turnaround); solid renter incomes; 10,051 units permitted in Miami-Dade County in 2024 (7,758 in 5+ unit buildings).
- This rent runs 42% of the median local income ($81k/yr) — at the standard rent-burdened threshold; future hikes will face affordability resistance.
Forward outlook
- Local home prices are declining (-3.0%/yr); year-one equity from $1k of loan paydown is wiped out by about $6k of value loss. Plan a longer hold.
- Miami-Dade County population projected at +28% by 2050 — long-run rental-demand tailwind backs the buy-and-hold thesis.
Negotiation context
- It's been on market 167 days — a 12% lower offer ($172k) is reasonable based on typical stale-listing flexibility.
Risks & watch-outs
- Watch-outs: HOA is 36% of rent.
- Climate carrying-cost: moderate flood risk; severe wind risk, 99% chance of damaging wind over 30y; extreme-heat days projected 7→31/yr by 2055 (HVAC capex compounding) — expect insurance premiums to compound above CPI over the hold.
Questions for the listing agent
- What do current leases actually rent for vs. the listed asking? Can we see a recent rent roll and the last 12 months of T-12 income?
- It's been on market 167 days. Have you received any prior offers? Is the seller open to a 12% concession, seller financing, or rate buy-down credit?
- Built in 1971 — when were the roof, HVAC, electrical panel, plumbing, and water heater last replaced?
- What does the HOA fee cover, when was the last increase, and are there any pending special assessments or reserve-fund shortfalls?
- Any open or pending special assessments — roof, HVAC, plumbing, elevator, façade? What's the per-unit balance and payoff schedule, and is the seller paying it off at close or rolling it to the buyer?
- Why hasn't it sold? Are there any deal-killer items the seller is aware of (foundation, flood, title, zoning, code violations)?
- Is there a deadline driving the sale (1031 exchange, divorce, estate, relocation)? That informs how much negotiation room exists.
- Schools are A-rated — typically a magnet for longer-tenancy family renters. What's the average tenant stay here, and is there a school-zone premium baked into asking?
- The area grade is low — what's the realistic commute time and amenity access for the typical tenant pool here? Any planned neighborhood developments (good or bad) we should know about?
- What's the average days-on-market for RENTAL listings here right now (not sales)? A rising rental-DOM trend means longer vacancies and softer asking-rent achievability than the comps imply.
- What's the recent tenant-quality profile in this submarket — average credit score on applications, eviction rate, late-payment / NSF rate, and stable-employment percentage? A property-management company in the area should have these aggregated.
- How much new apartment / multifamily construction is in the pipeline within 1–3 miles? Heavy new supply (>2% of stock underway) typically softens rents 12–24 months out; light construction supports rent growth.
Investment metrics
- 1% rule
- 1.47% ✓
- Cap rate
- 5.66%
- Cash-on-cash
- -2.25%
- DSCR
- 0.90
- GRM
- 5.7
CMA / ARV
No comps found within radius.
Projected returns pro-forma
-3.0% appreciation · 0.86% rent growth · sell at horizon
- IRR
- -24.0%
- Equity multiple
- 0.20×
- Total profit
- $-43,472
- Equity at exit
- $29,060
- IRR
- -35.2%
- Equity multiple
- -0.23×
- Total profit
- $-67,301
- Equity at exit
- $16,851
Cash invested: $54,572 (down + closing). Projections, not guarantees.
Landlord ↔ Tenant lean methodology
- Overall (STATE)
- 87 Strongly Landlord-Friendly
- State Florida
- 87 Strongly Landlord-Friendly · R+3
- County
- — inherits STATE
- City
- — inherits STATE
ZIP-level market 33155
- Rents YoY
- 0.9%
- Active inventory
- 191
- Price-to-rent
- 5.7×
Monthly cashflow live
- Estimated rent
- $2,872 high interval (Pro) →
- Mortgage (P&I)
- −$1,022
- Tax est. 1.5%
- −$244 /mo · $2,924/yr
- Insurance
- −$81
- HOA
- −$1,024
- Vacancy / Maint / Mgmt
- −$603
- Net cashflow
- $-102
Break-even live
Sensitivity live
| Price | -10% $33 | -5% $-35 | +0% $-102 | +5% $-170 | +10% $-237 |
|---|---|---|---|---|---|
| Rent | -10% $-329 | -5% $-216 | +0% $-102 | +5% $11 | +10% $125 |
| Rate | -1.0pp $-4 | -0.5pp $-53 | base $-102 | +0.5pp $-153 | +1.0pp $-204 |
UW: 25.0% down · 7.5% · 30yr · 1.5% tax · 5.0% vac · 8.0% maint · 8.0% mgmt
Financing live
Cash to close
- Down payment
- $48,725
- Closing costs
- $5,847
- Reserves months
- —
- Total cash needed
- —
Loan-product check · same deal, 3 products live
Conventional
25% down · 7.5% · 30yr
- Down + closing
- —
- Monthly P&I
- —
- Monthly cashflow
- —
- DSCR
- —
- Eligible?
- —
Personal DTI + credit; lowest rate.
DSCR
20% down · 8.5% · 30yr
- Down + closing
- —
- Monthly P&I
- —
- Monthly cashflow
- —
- DSCR
- —
- Eligible?
- —
No personal income docs; deal must DSCR.
Hard money
10% down · 12.0% · 12mo
- Down + closing
- —
- Monthly P&I
- —
- Monthly cashflow
- —
- DSCR
- —
- Eligible?
- —
Short-term bridge; refi at stabilization.
Rent comps 14 comps
| Address | Beds | Baths | Sqft | Rent | $/sqft | DOM | Units | Dist |
|---|---|---|---|---|---|---|---|---|
| 7823 Miller Dr Unit C105 Miami, FL | 2.0 | 1.0 | 840 | $2,150 | $2.56 | 26d | 1 | 0.02mi |
| 7847 Miller Dr Unit A205 Miami, FL | 2.0 | 2.0 | 1000 | $2,250 | $2.25 | 24d | 1 | 0.02mi |
| 4732 SW 87th Ct Unit 4732 Miami, FL | 3.0 | 2.0 | 1418 | $4,000 | $2.82 | 6d | 1 | 0.96mi |
| 4732 SW 87th Ct Unit 4732 Miami, FL | 3.0 | 2.0 | 1418 | $4,100 | $2.89 | 20d | 1 | 0.96mi |
| 7048 SW 83rd Ct Miami, FL | 3.0 | 2.0 | 1236 | $3,950 | $3.20 | 26d | 1 | 1.08mi |
| 3815 SW 82nd Ave Miami, FL | 3.0 | 2.0 | 1113 | $3,900 | $3.50 | 14d | 1 | 1.15mi |
| 3815 SW 82nd Ave Miami, FL | 3.0 | 2.0 | 1113 | $3,900 | $3.50 | 23d | 1 | 1.15mi |
| 3808 SW 79th Ave #63 Miami, FL | 3.0 | 2.5 | 1229 | $2,900 | $2.36 | 5d | 1 | 1.17mi |
| 3804 SW 79th Ave #76 Miami, FL | 3.0 | 2.5 | 1229 | $3,175 | $2.58 | 19d | 1 | 1.18mi |
| 3804 SW 79th Ave #76 Miami, FL | 3.0 | 2.5 | 1229 | $3,175 | $2.58 | 5d | 1 | 1.18mi |
| 8225 SW 39th St Unit 1373700P Miami, FL | 3.0 | 2.0 | 1496 | $5,670 | $3.79 | 1d | 1 | 1.19mi |
| 8820 SW 43rd Ter Miami, FL | 3.0 | 2.0 | 1302 | $3,550 | $2.73 | 26d | 1 | 1.23mi |
| 7101 SW 89th Ct #110 Miami, FL | 2.0 | 1.0 | 716 | $2,000 | $2.79 | 26d | 1 | 1.47mi |
| 7101 SW 89th Ct #110 Miami, FL | 2.0 | 1.0 | 716 | $2,000 | $2.79 | 18d | 1 | 1.47mi |
HOA detail condo
- Monthly dues
- $1,024 · $12,288/yr
- Likely covers
- pool
- Assessments
- None detected in remarks — confirm with the listing agent.
Listing history 6 events
-
2026-04-29status Pending
-
2026-04-20price $194,900
-
2026-03-14price $211,500
-
2026-02-16price $223,250
-
2025-12-16price $237,500
-
2025-11-13$250,000 Active
ⓘ Source: listings_history table (triggers on properties + properties_extension) + one-shot
backfill from property_details.listing_events for pre-trigger history.
Climate risk First Street
- Flood 5/10 Major FEMA zone X (unshaded) · 24% chance over 30 yrs
- Wildfire 1/10 Low
- Heat 10/10 Extreme 7 d/yr ≥105°F today · 31 d/yr by 30 yrs out
- Wind 10/10 Extreme 99% chance of damaging wind over 30 yrs
- Air quality 2/10 Low 1 unhealthy d/yr today · 1 by 30 yrs out
Nearby sold comps map
Loading sold comps map…
Walkable amenities ~0.75 mi
Loading nearby amenities…
Taxation est. · year 1
- Rental income
- $34,462
- − Mortgage interest
- −$10,917
- − Property taxes
- −$2,924
- − Insurance
- −$974
- − Repairs & maintenance
- −$2,757
- − Management
- −$2,757
- − HOA
- −$12,288
- − Depreciation
- −$5,670
- Taxable loss
- −$3,825
- Est. tax savings @ 24.0%
- +$918
- After-tax cash flow
- $-308/yr
For passive investors: Depreciation is non-cash, so a rental often shows a tax loss while cash-flowing — sheltering income. Rental losses are passive: they offset passive income freely, and up to $25,000/yr can offset ordinary (W-2) income if you actively participate and your MAGI is under $100k (phasing out to $0 by $150k); unused losses carry forward. On sale, claimed depreciation is recaptured at up to 25%, and gains may owe capital-gains tax (a 1031 exchange can defer both). Figures are a year-1 estimate at your 24.0% rate — not tax advice; consult a CPA.
Schools (NCES district)
- District
- Miami-Dade
- NCES district ID
- 1200390
- Math proficiency
- 45% ▼ -16.00%
- Reading proficiency
- 54% ▼ -5.00%
- Median HH income
- $43,928
- Composite
- 41.76/100
- National rank
- #3397
- State rank
- #40 of 73 in FL
Livability — Glenvar Heights
- Score
- 79/100
- State rank
- #137
- US rank
- #2054
Category grades
Schools grade is shown separately in the Schools card above.
Census & demographics
- Census place
- Glenvar Heights, FL
- County
- Miami-Dade County · 2,697,751 people
- Metro
- Miami-Fort Lauderdale-Pompano Beach, FL
- Population (ZIP)
- 43,983
- Household income
- $81,158
- Rent vs Own
- Severe rent burden
- 1876.0
Population outlook (Miami-Dade County) Hauer SSP2
- Today (2025)
- 3,126,439 people
- By 2030
- 3,325,765 · +6.4%
- By 2040
- 3,697,561 · +18.3%
- By 2050
- 4,012,134 · +28.3%
- By 2075
- 4,605,612 · +47.3%
- By 2100
- 4,866,598 · +55.7%
Race, ethnicity, and origin ACS 2023
- Neighborhood character
- Predominantly Hispanic (84%)
- Race & ethnicity
- Hispanic / Latino 84% Two or more races 48% White 12% Asian 2% Black 1%
- Hispanic origin (detail)
- Mexican 1% Puerto Rican 3% Cuban 58% Salvadoran 1%
- Common ancestry
- Lithuanian 1% Italian 1%
- Foreign-born
- 56% · Canada, Jamaica, China
- Languages at home
- 17% English-only · Spanish 80% French/Haitian/Cajun 1% Other Indo-European 1%
Political lean MEDSL · Miami-Dade
- 2024 margin
- R (+11.4) · D 43.9% · R 55.4%
- 2008→2024 swing
- -27.6pp toward R · 2008: 16.1pp · 2024: -11.4pp
- All cycles
- 2024: R+11.4 2020: D+7.3 2016: D+29.6 2012: D+23.7 2008: D+16.1
Not yet ingested
- Civics
- —
Market trends
- HPI YoY
- ▼ -777.72%
- Current HPI
- 456.6349
- Rent YoY
- ▲ 0.86%
- Metro
- Miami-Fort Lauderdale-Pompano Beach, FL
- State GDP YoY
- ▲ 3.28%
- F500 in state
- 36
Industry mix (Fortune 500 HQ in FL)
| Industry | F500 HQs | Revenue |
|---|---|---|
| Industrial Technology | 2 | $29B |
|
||
| Insurance | 2 | $17B |
|
||
| Retail | 1 | $60B |
|
||
| Technology Distribution | 1 | $58B |
|
||
| Homebuilding | 1 | $35B |
|
||
| Technology Manufacturing | 1 | $35B |
|
||
Price history
-22.0% since first listed6 events — show timeline
- 2026-04-29 Pending — MARMLS
- 2026-04-20 Price Changed $194,900 MARMLS
- 2026-03-14 Price Changed $211,500 MARMLS
- 2026-02-16 Price Changed $223,250 MARMLS
- 2025-12-16 Price Changed $237,500 MARMLS
- 2025-11-13 Listed $250,000 MARMLS
Cash-flow waterfall
monthlySold comps — $/sqft
last 12 mo · ≤1 miLoading sold comps…