36032 Double Bridges Rd · Ocean View, DE
Flood risk 1/10 · Minimal
- FEMA flood zone
- X (unshaded)
- Chance of flooding over 30 yrs
- 0.0%
- Est. flood insurance / yr
- $473 – $860
Fire risk 2/10 · Minimal
- Est. fire insurance / yr
- $476 – $884
Heat risk 8/10 · Major
- Hot days now (above 100°F)
- 7 days/yr
- Hot days in 30 yrs
- 18 days/yr
Wind risk 8/10 · Major
- Chance of severe wind over 30 yrs
- 80.0%
Air-quality risk 2/10 · Minimal
- Unhealthy air days now
- 0 days/yr
- Unhealthy air days in 30 yrs
- 1 days/yr
Risk factors via First Street. Map © Google.
Why this score? — see what drove the D grade
The composite is a weighted blend of 9 inputs, each scored 0–100. Each bar is that input's sub-score; the figure is the points it added to the 100-point composite (weight × sub-score).
- ARV discount +15.0/15.0
- Appreciation +10.0/10.0
- Cash flow +4.3/30.0
- Livability +3.5/5.0
- Schools +2.9/10.0
- Rent growth +2.5/5.0
- Condition / age +2.5/5.0
- 1% rule +0.4/10.0
- DSCR +0.0/10.0
$519,900
🖨 Deal sheet 📄 Offer letter ✓ Due diligence
Listing remarks MLS
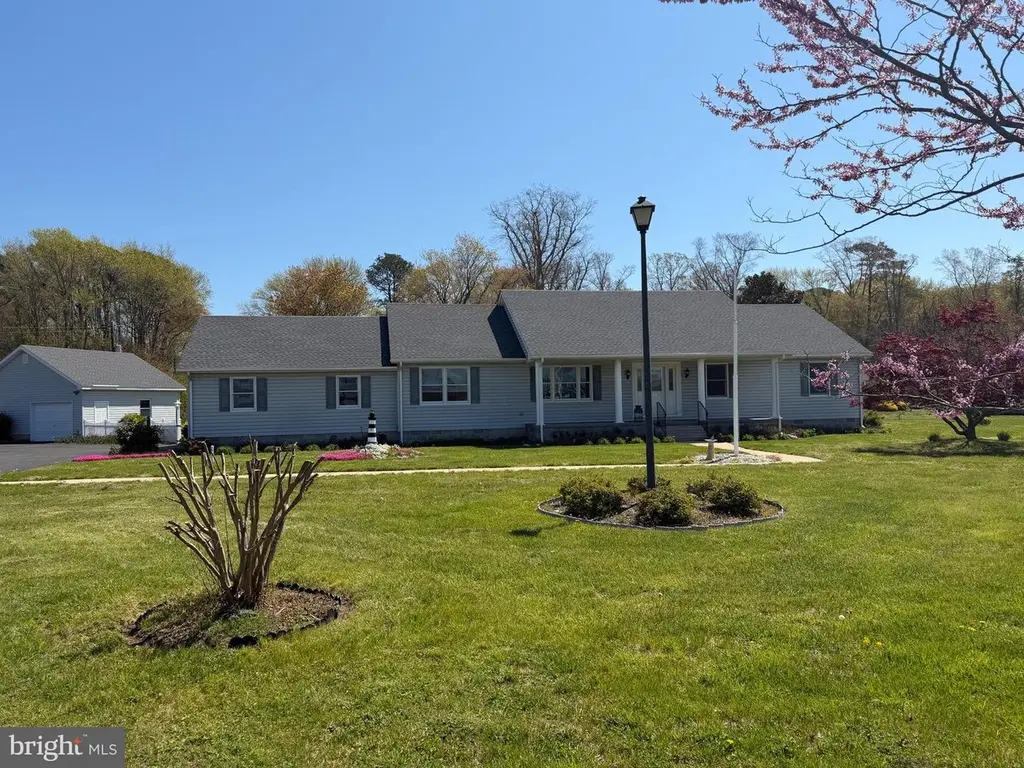
Large ranch style home that sits on nearly 1-acre landscaped lot located at the corner of Double Bridges RD and Camp Barnes RD. the featured circular, paved driveway provides easy access to the end load attached garage, detached two-car garage with workshop and a storage shed. Both garages feature a garage door opener with remotes. The home was completely rebuilt in 2021 due to fire, smoke, and water damaged cause by a fire in an outside porch light. The home features a cover front porch and an enclosed rear sunroom with glass windows and a mini-split HVAC system for central heat and AC. The sunroom overlooks the back yard and patio with outside shower. This nearly new home included 3 bedrooms with ceiling fans, and two full bathrooms, a large, open family room and formal dining room. The completely remodeled kitchen includes an island, all new cabinets and stainless-steel appliances and granite countertops. There is an office / den that could function as a guest room. LVP flooring and crown molding. throughout. Walkup stairs to attic storage.
Key facts
- Covered front porch
- Remodeled kitchen
- Island
Tags
Neighborhood map
What this means for you Summary
Snapshot
- This is a 3-bed/2.0-bath single-family listed at $520k.
Deal economics
- At list price, monthly cash flow is $-1k ($-17k/yr) — negative.
- To cash-flow at today's rent, offer at most $320k (38.4% below list).
- To meet the 1% rule (rent ≥ 1% of price), the offer needs to be $280k (46.1% below list).
- Recommended offer: $280k (46.1% below list) — sets the bar for 1% rule.
- Cap rate 3.1% vs local median 1.9% in Ocean View — top-decile yield for the area; either an underpriced asset or a hidden risk that comps aren't pricing in. Stress-test before assuming the spread holds.
Location & tenants
- Location reads 69/100 on livability (#27 in DE) — a middle-class / working-renter tenant base. Strengths: crime A+, employment A+, schools A; Watch: amenities F, commute F, cost of living F.
- Indian River School District (rural): math 25% / reading 41% proficiency, ranked #14 of 26 in DE (top 54%) — families likely to look elsewhere, expect single-tenant / working-renter base with shorter leases.
- Market conditions: 281 active listings in the ZIP; 1 comparable units currently listed for rent nearby; 4,354 units permitted in Sussex County in 2024 (344 in 5+ unit buildings).
Forward outlook
- In year one you build about $56k of equity ($4k loan paydown + $52k appreciation (10.0% local appreciation)).
- Sussex County population projected at +25% by 2050 — long-run rental-demand tailwind backs the buy-and-hold thesis.
- By year 2, paydown + projected appreciation supports a ~$89k cash-out refi (75% LTV) — recoverable capital for the next deal without selling this one.
Negotiation context
- It's been on market 62 days — a 6% lower offer ($489k) is reasonable based on typical stale-listing flexibility.
- 2 sale attempts with the ask held roughly flat each time — persistent listings suggest the price (not the market) is what's stuck; bring a comps-based counter.
Risks & watch-outs
- Climate carrying-cost: severe wind risk, 80% chance of damaging wind over 30y; extreme-heat days projected 7→18/yr by 2055 (HVAC capex compounding) — expect insurance premiums to compound above CPI over the hold.
Questions for the listing agent
- What do current leases actually rent for vs. the listed asking? Can we see a recent rent roll and the last 12 months of T-12 income?
- It's been on market 62 days. Have you received any prior offers? Is the seller open to a 46% concession, seller financing, or rate buy-down credit?
- Why hasn't it sold? Are there any deal-killer items the seller is aware of (foundation, flood, title, zoning, code violations)?
- Is there a deadline driving the sale (1031 exchange, divorce, estate, relocation)? That informs how much negotiation room exists.
- Schools are A-rated — typically a magnet for longer-tenancy family renters. What's the average tenant stay here, and is there a school-zone premium baked into asking?
- The area grade is low — what's the realistic commute time and amenity access for the typical tenant pool here? Any planned neighborhood developments (good or bad) we should know about?
- What's the average days-on-market for RENTAL listings here right now (not sales)? A rising rental-DOM trend means longer vacancies and softer asking-rent achievability than the comps imply.
- What's the recent tenant-quality profile in this submarket — average credit score on applications, eviction rate, late-payment / NSF rate, and stable-employment percentage? A property-management company in the area should have these aggregated.
- How much new for-sale + rental construction is in the pipeline within 1–3 miles? Heavy new supply typically softens prices + rents 12–24 months out; constrained supply supports both.
Investment metrics
- 1% rule
- 0.54% ✗
- Cap rate
- 3.11%
- Cash-on-cash
- -11.38%
- DSCR
- 0.49
- GRM
- 15.5
CMA / ARV
- ARV (median comp)
- $640,808
- List price
- $519,900
- Delta
- -18.87%
- Verdict
- UNDERPRICED
- Comps
- 20 within 1.0 mi
Show comp detail 12 sales within ~0.75 mi
| Address | Dist | Beds/Ba | Sqft | Sold | Price | $/sf | Match |
|---|---|---|---|---|---|---|---|
| 34114 Hornbeam Dr | 0.30mi | 3/2.0 | 2,141 (+1%) | 2mo | $565,000 | $264 | 84 |
| 33339 Curran Ct | 0.10mi | 4/2.0 (+1) | 2,011 (-6%) | 15mo | $503,000 | $250 | 69 |
| 36262 Windsor Park Dr | 0.39mi | 3/2.0 | 2,012 (-6%) | 8mo | $515,000 | $256 | 66 |
| 23311 Lanterns Glow Rd #509 | 0.69mi | 3/2.0 | 2,118 (-0%) | 7mo | $640,000 | $302 | 61 |
| 36210 Watch Hill Rd | 0.31mi | 3/2.0 | 2,285 (+7%) | 16mo | $540,000 | $236 | 60 |
| 32038 Carlisle Ct | 0.48mi | 3/2.5 | 2,289 (+8%) | 9mo | $560,000 | $245 | 56 |
| 32019 Carlisle Ct | 0.49mi | 3/2.0 | 2,200 (+3%) | 22mo | $579,990 | $264 | 53 |
| 28945 Twin Ponds Ln | 0.59mi | 3/2.0 | 2,174 (+2%) | 19mo | $659,900 | $304 | 53 |
| 24056 Plover Ln | 0.42mi | 3/3.0 | 2,400 (+13%) | 11mo | $550,000 | $229 | 46 |
| 32026 Santa Fe Ct | 0.46mi | 4/3.0 (+1) | 2,281 (+7%) | 21mo | $574,990 | $252 | 40 |
| 32032 Carlisle Ct | 0.48mi | 4/3.0 (+1) | 2,356 (+11%) | 19mo | $579,990 | $246 | 35 |
| 23482 Lanterns Glow Rd #566 | 0.75mi | 3/3.0 | 2,438 (+15%) | 18mo | $725,095 | $297 | 22 |
Match score weights: distance 35% · size 25% · config 20% · recency 20%. Top-matched comps best support the ARV.
Projected returns pro-forma
10.0% appreciation · 3.0% rent growth · sell at horizon
- IRR
- 16.3%
- Equity multiple
- 2.34×
- Total profit
- $195,243
- Equity at exit
- $468,367
- IRR
- 15.6%
- Equity multiple
- 5.43×
- Total profit
- $644,205
- Equity at exit
- $1,010,051
Cash invested: $145,572 (down + closing). Projections, not guarantees.
Landlord ↔ Tenant lean methodology
- Overall (STATE)
- 70 Landlord-Friendly
- State Delaware
- 70 Landlord-Friendly · D+7
- County
- — inherits STATE
- City
- — inherits STATE
ZIP-level market 19945
- Home prices YoY
- 16.9%
- Active inventory
- 281
- Price-to-rent
- 15.5×
Monthly cashflow live
- Estimated rent
- $2,800 medium interval (Pro) →
- Mortgage (P&I)
- −$2,726
- Tax est. 1.5%
- −$650 /mo · $7,798/yr
- Insurance
- −$217
- HOA
- −$0
- Vacancy / Maint / Mgmt
- −$588
- Net cashflow
- $-1,381
Break-even live
UW: 25.0% down · 7.5% · 30yr · 1.5% tax · 5.0% vac · 8.0% maint · 8.0% mgmt
Financing live
Cash to close
- Down payment
- $129,975
- Closing costs
- $15,597
- Reserves months
- —
- Total cash needed
- —
Loan-product check · same deal, 3 products live
Conventional
25% down · 7.5% · 30yr
- Down + closing
- —
- Monthly P&I
- —
- Monthly cashflow
- —
- DSCR
- —
- Eligible?
- —
Personal DTI + credit; lowest rate.
DSCR
20% down · 8.5% · 30yr
- Down + closing
- —
- Monthly P&I
- —
- Monthly cashflow
- —
- DSCR
- —
- Eligible?
- —
No personal income docs; deal must DSCR.
Hard money
10% down · 12.0% · 12mo
- Down + closing
- —
- Monthly P&I
- —
- Monthly cashflow
- —
- DSCR
- —
- Eligible?
- —
Short-term bridge; refi at stabilization.
Rent comps 1 comps
| Address | Beds | Baths | Sqft | Rent | $/sqft | DOM | Units | Dist |
|---|---|---|---|---|---|---|---|---|
| 35059 Dundee St Frankford, DE | 4.0 | 2.5 | 2565 | $2,800 | $1.09 | 21d | 1 | 0.81mi |
Listing history 19 events
-
2026-06-18days on market $519,900 Active 62 DOM
-
2026-06-17days on market $519,900 Active 61 DOM
-
2026-06-16days on market $519,900 Active 60 DOM
-
2026-06-15days on market $519,900 Active 59 DOM
-
2026-06-14days on market $519,900 Active 57 DOM
-
2026-06-13days on market $519,900 Active 56 DOM
-
2026-06-10days on market $519,900 Active 54 DOM
-
2026-06-09days on market $519,900 Active 53 DOM
-
2026-06-08days on market $519,900 Active 52 DOM
-
2026-06-07days on market $519,900 Active 51 DOM
-
2026-06-02days on market $519,900 Active 46 DOM
-
2026-06-01days on market $519,900 Active 45 DOM
-
2026-05-31days on market $519,900 Active 44 DOM
-
2026-05-30days on market $519,900 Active 43 DOM
-
2026-04-17$519,900 Active 1059-char remark
Show marketing remark (1059 chars)
Large ranch style home that sits on nearly 1-acre landscaped lot located at the corner of Double Bridges RD and Camp Barnes RD. the featured circular, paved driveway provides easy access to the end load attached garage, detached two-car garage with workshop and a storage shed. Both garages feature a garage door opener with remotes. The home was completely rebuilt in 2021 due to fire, smoke, and water damaged cause by a fire in an outside porch light. The home features a cover front porch and an enclosed rear sunroom with glass windows and a mini-split HVAC system for central heat and AC. The sunroom overlooks the back yard and patio with outside shower. This nearly new home included 3 bedrooms with ceiling fans, and two full bathrooms, a large, open family room and formal dining room. The completely remodeled kitchen includes an island, all new cabinets and stainless-steel appliances and granite countertops. There is an office / den that could function as a guest room. LVP flooring and crown molding. throughout. Walkup stairs to attic storage.
-
2025-10-31historical
-
2025-09-16price $519,900
-
2025-06-28$539,900 Active
-
2025-05-27historical
ⓘ Source: listings_history table (triggers on properties + properties_extension) + one-shot
backfill from property_details.listing_events for pre-trigger history.
Climate risk First Street
- Flood 1/10 Low FEMA zone X (unshaded) · 0% chance over 30 yrs
- Wildfire 2/10 Low
- Heat 8/10 Severe 7 d/yr ≥100°F today · 18 d/yr by 30 yrs out
- Wind 8/10 Severe 80% chance of damaging wind over 30 yrs
- Air quality 2/10 Low 0 unhealthy d/yr today · 1 by 30 yrs out
Nearby sold comps map
Loading sold comps map…
Walkable amenities ~0.75 mi
Loading nearby amenities…
Taxation est. · year 1
- Rental income
- $33,600
- − Mortgage interest
- −$29,122
- − Property taxes
- −$7,798
- − Insurance
- −$2,600
- − Repairs & maintenance
- −$2,688
- − Management
- −$2,688
- − Depreciation
- −$15,124
- Taxable loss
- −$26,421
- Est. tax savings @ 24.0%
- +$6,341
- After-tax cash flow
- $-10,230/yr
For passive investors: Depreciation is non-cash, so a rental often shows a tax loss while cash-flowing — sheltering income. Rental losses are passive: they offset passive income freely, and up to $25,000/yr can offset ordinary (W-2) income if you actively participate and your MAGI is under $100k (phasing out to $0 by $150k); unused losses carry forward. On sale, claimed depreciation is recaptured at up to 25%, and gains may owe capital-gains tax (a 1031 exchange can defer both). Figures are a year-1 estimate at your 24.0% rate — not tax advice; consult a CPA.
Schools (NCES district)
- District
- Indian River School District
- NCES district ID
- 1000680
- Math proficiency
- 25% ▼ -27.00%
- Reading proficiency
- 41% ▼ -17.00%
- Median HH income
- $53,838
- Composite
- 28.99/100
- National rank
- #6620
- State rank
- #14 of 26 in DE
Livability — Ocean View
- Score
- 69/100
- State rank
- #27
- US rank
- #8560
Category grades
Schools grade is shown separately in the Schools card above.
Census & demographics
- Population (ZIP)
- 8,917
Population outlook (Sussex County) Hauer SSP2
- Today (2025)
- 248,853 people
- By 2030
- 264,464 · +6.3%
- By 2040
- 290,980 · +16.9%
- By 2050
- 311,259 · +25.1%
- By 2075
- 352,488 · +41.6%
- By 2100
- 367,406 · +47.6%
Race, ethnicity, and origin ACS 2023
- Neighborhood character
- Predominantly White (77%)
- Race & ethnicity
- White 77% Black 12% Hispanic / Latino 8% Two or more races 7%
- Hispanic origin (detail)
- Mexican 4%
- Common ancestry
- Romanian 3% Slovak 3% Lithuanian 1%
- Foreign-born
- 5% · Canada
- Languages at home
- 91% English-only · Spanish 8%
Political lean MEDSL · Sussex
- 2024 margin
- R (+11.0) · D 43.9% · R 54.9% · Other 1.2%
- 2008→2024 swing
- -2.4pp toward R · 2008: -8.6pp · 2024: -11.0pp
- All cycles
- 2024: R+11.0 2020: R+11.2 2016: R+22.0 2012: R+13.0 2008: R+8.6
Not yet ingested
- Civics
- —
Market trends
- HPI YoY
- ▲ 46.51%
- Current HPI
- 322.2407
- Rent YoY
- —
- Metro
- —
- State GDP YoY
- —
- F500 in state
- 0
Price history
-3.7% since first listed5 events — show timeline
- 2026-04-17 Listed $519,900 BRIGHT MLS
- 2025-10-31 Listing Removed — BRIGHT MLS
- 2025-09-16 Price Changed $519,900 BRIGHT MLS
- 2025-06-28 Listed $539,900 BRIGHT MLS
- 2025-05-27 Coming Soon — BRIGHT MLS
Property tax history
+5.3%/yrLatest (2025): $887 · +43.2% YoY. Source: county tax records.
Cash-flow waterfall
monthlySold comps — $/sqft
last 12 mo · ≤1 miLoading sold comps…