 Duplex
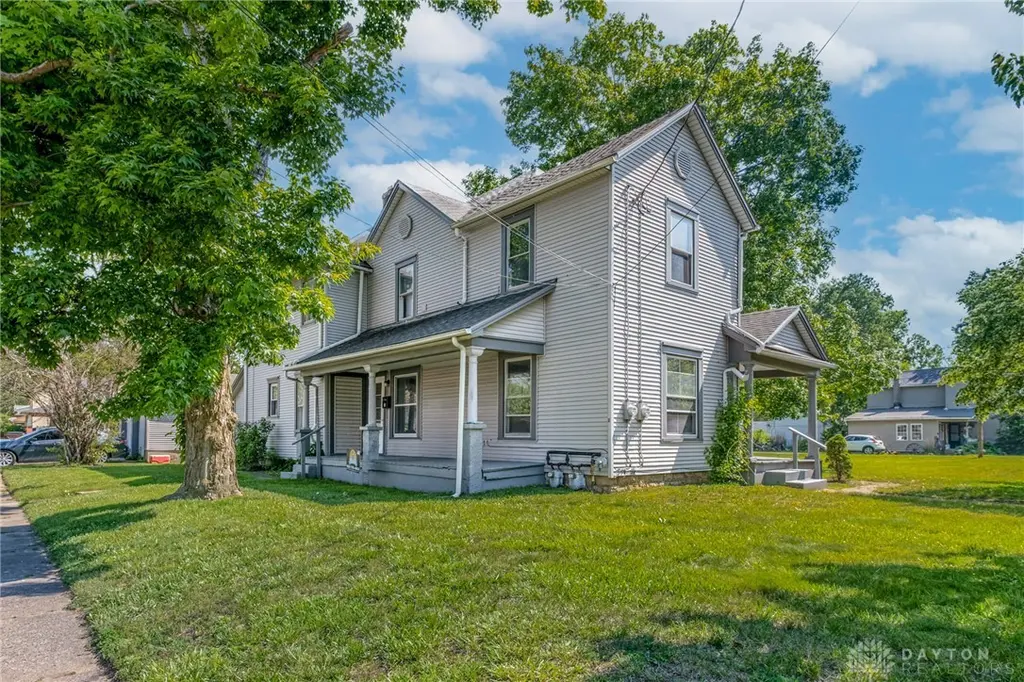
209 W Main St · Trotwood, OH
Flood risk 1/10 · Minimal
- FEMA flood zone
- X (unshaded)
- Chance of flooding over 30 yrs
- 0.0%
- Est. flood insurance / yr
- $473 – $860
Fire risk 1/10 · Minimal
- Est. fire insurance / yr
- $713 – $1,323
Heat risk 3/10 · Minor
- Hot days now (above 101°F)
- 7 days/yr
- Hot days in 30 yrs
- 19 days/yr
Wind risk 2/10 · Minimal
- Chance of severe wind over 30 yrs
- 0.0%
Air-quality risk 3/10 · Minor
- Unhealthy air days now
- 3 days/yr
- Unhealthy air days in 30 yrs
- 4 days/yr
Risk factors via First Street. Map © Google.
Why this score? — see what drove the C+ grade
The composite is a weighted blend of 9 inputs, each scored 0–100. Each bar is that input's sub-score; the figure is the points it added to the 100-point composite (weight × sub-score).
- Cash flow +27.7/30.0
- DSCR +9.8/10.0
- ARV discount +7.5/15.0
- 1% rule +7.4/10.0
- Livability +3.0/5.0
- Rent growth +2.5/5.0
- Condition / age +2.5/5.0
- Schools +1.2/10.0
- Appreciation +0.0/10.0
$189,900
🖨 Deal sheet 📄 Offer letter ✓ Due diligence
Multi-family units
County records classify this as Multi-Family (2-4 Unit). Listing-text estimate: 2 units. confirmed
Listing remarks
Renovated duplex featuring one 2-bedroom unit and one 3-bedroom unit - Perfect house hack opportunity to live in one side and rent the other - With tenant placement already completed for you! Property was renovated + updated in 2020/21, as well as maintaining general repairs and upkeep over the course of ownership - 209 W Main bathroom completely updated, rent-ready checklist completed prior to move-in; Rent-ready checklist completed along with fresh paint/drywall cleanup in 2 Oak (2026). Currently professionally managed, can provide financials and any update lists upon request - 209 W Main tenant leased for $1025/month until 4/30/2027, 2 Oak previously rented for $975/month but will remain
Key facts
- Renovated
- Updated
- Income producing
Tags
Property features AI
Finance
- Financial info: Gross income reported: $24,780; Offered for sale
Exterior
- Parking: Detached two-car garage
- Home design: Two-story building; Frame construction with vinyl siding; Cellar foundation
- Construction: Frame construction; Vinyl siding; Cellar foundation
- Exterior features: Residential zoning; Lot approximately 0.1825 acres
Interior
- Bedrooms: One unit with two bedrooms and one unit with three bedrooms
- Bathrooms: Two full bathrooms (total)
- Heating & cooling: Central air conditioning; Forced air heating (natural gas)
- Interior features: Multi-family property with two units in one building
Neighborhood map
What this means for you Summary
Snapshot
- This is a 1×2bd/1.0ba + 1×3bd/1.0ba units multifamily listed at $190k.
Deal economics
- At list price, monthly cash flow is $575 ($7k/yr) — positive. Per door: $287/mo.
- The deal already cash-flows at list — no discount required.
- Meets the 1% rule at list price ($2k rent vs $190k).
- Recommended offer: $187k (1.5% below list) — sets the bar for market timing.
- Cap rate 9.9% vs local median 6.5% in Trotwood — top-decile yield for the area; either an underpriced asset or a hidden risk that comps aren't pricing in. Stress-test before assuming the spread holds.
Location & tenants
- Location reads 59/100 on livability (#1,014 in OH) — a working-class tenant base; expect higher turnover. Strengths: cost of living A+, housing A; Watch: employment D, schools F, crime F.
- Trotwood-Madison City (suburban): math 9% / reading 21% proficiency, ranked #645 of 656 in OH (top 98%) — low school quality limits family demand, transient renter base, plan for 1-2y turnover; 78% free/reduced lunch — lower-income household profile, screen leases tightly.
- Market conditions: 48 active listings in the ZIP; 907 units permitted in Montgomery County in 2024 (416 in 5+ unit buildings).
- At $2,356/mo this rent would consume 54% of the median local household income ($52k/yr) (locally 852% of renters already pay >50% of income on rent) — very limited rent-growth headroom before tenants either downsize or default.
Forward outlook
- Local home prices are declining (-3.0%/yr); year-one equity from $1k of loan paydown is wiped out by about $6k of value loss. Plan a longer hold.
- Montgomery County population projected at -10% by 2050 — secular population decline; favor cash flow + early exit over multi-decade hold.
- At projected returns (-3.0% appreciation + 3.0% rent growth), your $53k cash investment doubles in ~9 years — after that, you're playing with house money.
Negotiation context
- It's been on market 27 days — a 2% lower offer ($187k) is reasonable based on typical stale-listing flexibility.
- 4 sale attempts since 3y ago with the ask held roughly flat each time — persistent listings suggest the price (not the market) is what's stuck; bring a comps-based counter.
- Current owner paid $57k; list at $190k implies a 234% gain — meaningful room to come down on a strong offer.
Risks & watch-outs
- Watch-outs: built in 1913 — expect roof / HVAC / electrical / plumbing capex.
Questions for the listing agent
- Can we see the unit-by-unit rent roll, current vacancy, and any below-market leases? What's the average tenancy length?
- What capital expenditures (roof, boiler, parking lot, exteriors) have been made in the last 5 years, and what's planned in the next 2?
- Built in 1913 — when were the roof, HVAC, electrical panel, plumbing, and water heater last replaced?
- Is there a deadline driving the sale (1031 exchange, divorce, estate, relocation)? That informs how much negotiation room exists.
- Schools are F-rated, which usually means shorter tenancies and higher turnover. Who's the typical renter profile here, and what's been the actual vacancy rate?
- Crime grade is F in this area — have there been break-ins, vandalism, or insurance claims at this property in the last 3 years? What carrier currently insures it and at what premium?
- What's the average days-on-market for RENTAL listings here right now (not sales)? A rising rental-DOM trend means longer vacancies and softer asking-rent achievability than the comps imply.
- What's the recent tenant-quality profile in this submarket — average credit score on applications, eviction rate, late-payment / NSF rate, and stable-employment percentage? A property-management company in the area should have these aggregated.
- How much new apartment / multifamily construction is in the pipeline within 1–3 miles? Heavy new supply (>2% of stock underway) typically softens rents 12–24 months out; light construction supports rent growth.
Investment metrics
- 1% rule
- 1.24% ✓
- Cap rate
- 9.92%
- Cash-on-cash
- 12.97%
- DSCR
- 1.58
- GRM
- 6.7
CMA / ARV
No comps found within radius.
Projected returns pro-forma
-3.0% appreciation · 3.0% rent growth · sell at horizon
- IRR
- 2.9%
- Equity multiple
- 1.11×
- Total profit
- $5,839
- Equity at exit
- $28,315
- IRR
- 12.4%
- Equity multiple
- 1.98×
- Total profit
- $52,283
- Equity at exit
- $16,419
Cash invested: $53,172 (down + closing). Projections, not guarantees.
Landlord ↔ Tenant lean methodology
- Overall (STATE)
- 73 Landlord-Friendly
- State Ohio
- 73 Landlord-Friendly · R+6
- County
- — inherits STATE
- City
- — inherits STATE
ZIP-level market 45426
- Home prices YoY
- -12.0%
- Active inventory
- 48
- Price-to-rent
- 14.2×
Monthly cashflow live
- Estimated rent
- $2,356 high interval (Pro) →
- Mortgage (P&I)
- −$996
- Tax from tax record
- −$212 /mo · $2,541/yr
- Insurance
- −$79
- HOA
- −$0
- Vacancy / Maint / Mgmt
- −$495
- Net cashflow
- $575
Break-even live
2-unit breakdown (identical units grouped — click to expand)
| Units | Beds | Baths | Est. rent |
|---|---|---|---|
| 1× unit | 2 | 1 | $1,114 |
| 1× unit | 3 | 1 | $1,241 |
| Total (2 units) | $2,356 | ||
UW: 25.0% down · 7.5% · 30yr · 1.5% tax · 5.0% vac · 8.0% maint · 8.0% mgmt
Financing live
Cash to close
- Down payment
- $47,475
- Closing costs
- $5,697
- Reserves months
- —
- Total cash needed
- —
Loan-product check · same deal, 3 products live
Conventional
25% down · 7.5% · 30yr
- Down + closing
- —
- Monthly P&I
- —
- Monthly cashflow
- —
- DSCR
- —
- Eligible?
- —
Personal DTI + credit; lowest rate.
DSCR
20% down · 8.5% · 30yr
- Down + closing
- —
- Monthly P&I
- —
- Monthly cashflow
- —
- DSCR
- —
- Eligible?
- —
No personal income docs; deal must DSCR.
Hard money
10% down · 12.0% · 12mo
- Down + closing
- —
- Monthly P&I
- —
- Monthly cashflow
- —
- DSCR
- —
- Eligible?
- —
Short-term bridge; refi at stabilization.
Listing history 34 events
-
2026-06-18days on market $189,900 Active 27 DOM
-
2026-06-17days on market $189,900 Active 26 DOM
-
2026-06-16pricedays on market $189,900 Active 25 DOM
-
2026-06-15days on market $194,900 Active 24 DOM
-
2026-06-14days on market $194,900 Active 22 DOM
-
2026-06-13days on market $194,900 Active 21 DOM
-
2026-06-10days on market $194,900 Active 19 DOM
-
2026-06-09days on market $194,900 Active 18 DOM
-
2026-06-08days on market $194,900 Active 17 DOM
-
2026-06-07days on market $194,900 Active 16 DOM
-
2026-06-03days on market $194,900 Active 12 DOM
-
2026-06-02days on market $194,900 Active 11 DOM
-
2026-06-01days on market $194,900 Active 10 DOM
-
2026-05-31days on market $194,900 Active 9 DOM
-
2026-05-31days on market $194,900 Active 8 DOM
-
2026-05-22$194,900 Active
-
2026-03-24historical $1,025
-
2026-03-14price $1,025
-
2026-01-10price $1,050
-
2025-12-12price $1,070
-
2025-12-02price $1,075
-
2025-12-01historical
-
2025-10-16$1,100
-
2025-08-19price $174,900
-
2025-07-08price $179,900
-
2025-05-29price $184,900
-
2025-04-05$189,900 Active
-
2024-01-29historical $1,090
-
2024-01-15price $1,090
-
2024-01-09price $1,095
-
2023-12-12$1,100
-
2021-05-13soldstatus $56,800
-
1979-11-05soldstatus $25,400
-
1979-11-05soldstatus $25,400
ⓘ Source: listings_history table (triggers on properties + properties_extension) + one-shot
backfill from property_details.listing_events for pre-trigger history.
Tax reassessment forecast OH · Partial reset (capped growth)
- Current annual tax
- $2,541 · $212/mo
- Projected year-2 tax
- $2,752 · $229/mo
- Expected delta
- +$211/yr (+$18/mo · 8.3%)
ⓘ Screening estimate from a state-policy table — verify with the county assessor before closing.
Climate risk First Street
- Flood 1/10 Low FEMA zone X (unshaded) · 0% chance over 30 yrs
- Wildfire 1/10 Low
- Heat 3/10 Moderate 7 d/yr ≥101°F today · 19 d/yr by 30 yrs out
- Wind 2/10 Low 0% chance of damaging wind over 30 yrs
- Air quality 3/10 Moderate 3 unhealthy d/yr today · 4 by 30 yrs out
Nearby sold comps map
Loading sold comps map…
Walkable amenities ~0.75 mi
Loading nearby amenities…
Taxation est. · year 1
- Rental income
- $28,272
- − Mortgage interest
- −$10,637
- − Property taxes
- −$2,541
- − Insurance
- −$950
- − Repairs & maintenance
- −$2,262
- − Management
- −$2,262
- − Depreciation
- −$5,524
- Taxable income
- $4,096
- Est. tax owed @ 24.0%
- −$983
- After-tax cash flow
- $5,911/yr
For passive investors: Depreciation is non-cash, so a rental often shows a tax loss while cash-flowing — sheltering income. Rental losses are passive: they offset passive income freely, and up to $25,000/yr can offset ordinary (W-2) income if you actively participate and your MAGI is under $100k (phasing out to $0 by $150k); unused losses carry forward. On sale, claimed depreciation is recaptured at up to 25%, and gains may owe capital-gains tax (a 1031 exchange can defer both). Figures are a year-1 estimate at your 24.0% rate — not tax advice; consult a CPA.
Schools (NCES district)
- District
- Trotwood-Madison City
- NCES district ID
- 3904869
- Math proficiency
- 9% ▼ -15.00%
- Reading proficiency
- 21% ▼ -11.00%
- Median HH income
- $33,529
- Composite
- 12.15/100
- National rank
- #9651
- State rank
- #645 of 656 in OH
Livability — Trotwood
- Score
- 59/100
- State rank
- #1014
- US rank
- #20073
Category grades
Schools grade is shown separately in the Schools card above.
Census & demographics
- Census place
- Trotwood, OH
- County
- Montgomery County · 459,541 people
- City population
- 19,754
- Metro
- Dayton-Kettering, OH
- Population (ZIP)
- 14,114
- Household income
- $51,908
- Rent vs Own
- Severe rent burden
- 852.0
Population outlook (Montgomery County) Hauer SSP2
- Today (2025)
- 523,241 people
- By 2030
- 514,948 · -1.6%
- By 2040
- 493,378 · -5.7%
- By 2050
- 469,639 · -10.2%
- By 2075
- 418,360 · -20.0%
- By 2100
- 353,315 · -32.5%
Race, ethnicity, and origin ACS 2023
- Neighborhood character
- Predominantly Black (69%)
- Race & ethnicity
- Black 69% White 22% Two or more races 7% Asian 2% Hispanic / Latino 1%
- Common ancestry
- Lithuanian 1% Serbian 1%
- Foreign-born
- 3% · Canada
- Languages at home
- 95% English-only · Other Asian/Pacific 1% Spanish 1% French/Haitian/Cajun 1%
Political lean MEDSL · Montgomery
- 2024 margin
- Toss-up / Even · D 49.8% · R 49.3%
- 2008→2024 swing
- -5.8pp toward R · 2008: 6.2pp · 2024: 0.5pp
- All cycles
- 2024: D+0.5 2020: D+2.2 2016: R+1.2 2012: D+3.1 2008: D+6.2
Not yet ingested
- Civics
- —
Market trends
- HPI YoY
- ▼ -44.94%
- Current HPI
- 329.0106
- Rent YoY
- —
- Metro
- Dayton-Kettering, OH
- State GDP YoY
- ▲ 1.98%
- F500 in state
- 48
Industry mix (Fortune 500 HQ in OH)
| Industry | F500 HQs | Revenue |
|---|---|---|
| Insurance | 3 | $145B |
|
||
| Industrial Machinery | 3 | $49B |
|
||
| Financial Services | 3 | $24B |
|
||
| Consumer Goods | 2 | $93B |
|
||
| Aerospace / Defense | 2 | $47B |
|
||
| Utilities | 2 | $33B |
|
||
Price history
+667.3% since first listed19 events — show timeline
- 2026-05-22 Listed $194,900 Dayton MLS
- 2026-03-24 Rental Removed $1,025 DAYTONMLS
- 2026-03-14 Price Changed $1,025 DAYTONMLS
- 2026-01-10 Price Changed $1,050 DAYTONMLS
- 2025-12-12 Price Changed $1,070 DAYTONMLS
- 2025-12-02 Price Changed $1,075 DAYTONMLS
- 2025-12-01 Listing Removed — Dayton MLS
- 2025-10-16 Listed for Rent $1,100 DAYTONMLS
- 2025-08-19 Price Changed $174,900 Dayton MLS
- 2025-07-08 Price Changed $179,900 Dayton MLS
- 2025-05-29 Price Changed $184,900 Dayton MLS
- 2025-04-05 Listed $189,900 Dayton MLS
- 2024-01-29 Rental Removed $1,090 DAYTONMLS
- 2024-01-15 Price Changed $1,090 DAYTONMLS
- 2024-01-09 Price Changed $1,095 DAYTONMLS
- 2023-12-12 Listed for Rent $1,100 DAYTONMLS
- 2021-05-13 Sold (Public Records) $56,800 Public Records
- 1979-11-05 Sold (Public Records) $25,400 Public Records
- 1979-11-05 Sold (Public Records) $25,400 Public Records
Property tax history
+2.9%/yrLatest (2025): $2,541 · -0.2% YoY. Source: county tax records.
Cash-flow waterfall
monthlySold comps — $/sqft
last 12 mo · ≤1 miLoading sold comps…