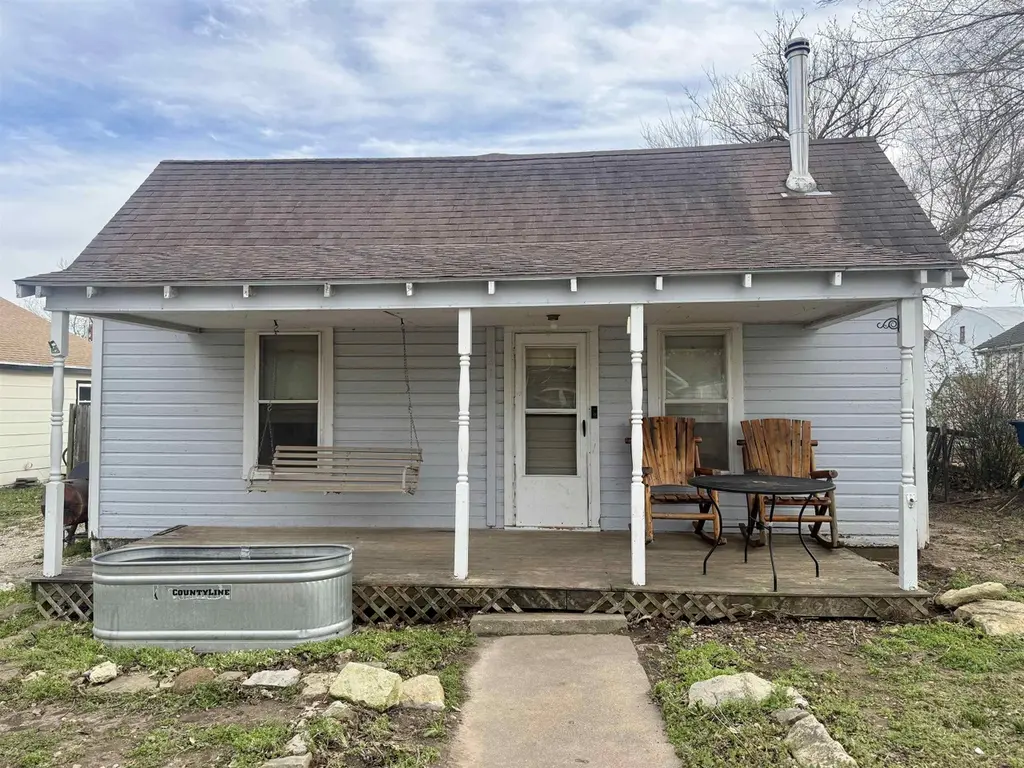
321 W Violet Ave · Potwin, KS
Flood risk 1/10 · Minimal
- FEMA flood zone
- X (unshaded)
- Chance of flooding over 30 yrs
- 0.0%
- Est. flood insurance / yr
- $507 – $1,088
Fire risk 5/10 · Moderate
- Est. fire insurance / yr
- $1,154 – $2,142
Heat risk 5/10 · Moderate
- Hot days now (above 107°F)
- 7 days/yr
- Hot days in 30 yrs
- 18 days/yr
Wind risk 2/10 · Minimal
- Chance of severe wind over 30 yrs
- 0.0%
Air-quality risk 3/10 · Minor
- Unhealthy air days now
- 2 days/yr
- Unhealthy air days in 30 yrs
- 3 days/yr
Risk factors via First Street. Map © Google.
Why this score? — see what drove the B- grade
The composite is a weighted blend of 9 inputs, each scored 0–100. Each bar is that input's sub-score; the figure is the points it added to the 100-point composite (weight × sub-score).
- Cash flow +26.0/30.0
- DSCR +8.8/10.0
- ARV discount +7.5/15.0
- 1% rule +6.6/10.0
- Appreciation +5.3/10.0
- Schools +3.5/10.0
- Livability +2.8/5.0
- Rent growth +2.5/5.0
- Condition / age +2.5/5.0
$67,000
🖨 Deal sheet 📄 Offer letter ✓ Due diligence
Key facts
- New plumbing system
- New hot water tank
- Window a/c unit
Tags
Property features AI
Exterior
- Parking: 1-car garage
- Utilities: Public water; Sewer available; Natural gas available
- Home design: Single-family onsite built home
- Exterior features: One-level layout; Crawl space foundation; Composition roof
Interior
- Kitchen: Includes dishwasher, refrigerator, and range
- Bathrooms: 1 full bathroom
- Heating & cooling: Forced air heat; Wall/window air conditioning units
- Interior features: Dishwasher, Refrigerator, Range; No basement
- Laundry & utility: Laundry in a separate room
Neighborhood map
What this means for you Summary
Snapshot
- This is a 1-bed/1.0-bath single-family listed at $67k.
Deal economics
- At list price, monthly cash flow is $168 ($2k/yr) — positive.
- The deal already cash-flows at list — no discount required.
- Meets the 1% rule at list price ($778 rent vs $67k).
- Recommended offer: $66k (1.5% below list) — sets the bar for market timing.
Location & tenants
- Location reads 56/100 on livability (#555 in KS) — a working-class tenant base; expect higher turnover. Strengths: cost of living A+, housing B; Watch: employment D, crime F, amenities F.
- Remington-Whitewater (rural): math 36% / reading 42% proficiency, ranked #31 of 169 in KS (top 18%) — families likely to look elsewhere, expect single-tenant / working-renter base with shorter leases.
- Zoned schools: Remington Elementary At Potwin (math 54% / reading 54%, grade C, #107 of 684 statewide, top 18%, 198 students, 38% FRL); Remington Middle School (math 32% / reading 42%, grade F, #37 of 219 statewide, top 19%, 142 students, 43% FRL); Frederic Remington High (math 10% / reading 10%, grade F, #289 of 327 statewide, top 93%, 148 students, 32% FRL).
- Market conditions: 2 active listings in the ZIP; 235 units permitted in Butler County in 2024 (0 in 5+ unit buildings).
Forward outlook
- In year one you build about $868 of equity ($463 loan paydown + $405 appreciation (0.6% local appreciation)).
- At projected returns (0.6% appreciation + 3.0% rent growth), your $19k cash investment doubles in ~6 years — after that, you're playing with house money.
Negotiation context
- It's been on market 28 days — a 2% lower offer ($66k) is reasonable based on typical stale-listing flexibility.
Risks & watch-outs
- Watch-outs: built in 1918 — expect roof / HVAC / electrical / plumbing capex.
- Climate carrying-cost: moderate wildfire risk; extreme-heat days projected 7→18/yr by 2055 (HVAC capex compounding) — expect insurance premiums to compound above CPI over the hold.
Questions for the listing agent
- Built in 1918 — when were the roof, HVAC, electrical panel, plumbing, and water heater last replaced?
- Is there a deadline driving the sale (1031 exchange, divorce, estate, relocation)? That informs how much negotiation room exists.
- Crime grade is F in this area — have there been break-ins, vandalism, or insurance claims at this property in the last 3 years? What carrier currently insures it and at what premium?
- What's the average days-on-market for RENTAL listings here right now (not sales)? A rising rental-DOM trend means longer vacancies and softer asking-rent achievability than the comps imply.
- What's the recent tenant-quality profile in this submarket — average credit score on applications, eviction rate, late-payment / NSF rate, and stable-employment percentage? A property-management company in the area should have these aggregated.
- How much new for-sale + rental construction is in the pipeline within 1–3 miles? Heavy new supply typically softens prices + rents 12–24 months out; constrained supply supports both.
Investment metrics
- 1% rule
- 1.16% ✓
- Cap rate
- 9.30%
- Cash-on-cash
- 10.73%
- DSCR
- 1.48
- GRM
- 7.2
CMA / ARV
No comps found within radius.
Projected returns pro-forma
0.61% appreciation · 3.0% rent growth · sell at horizon
- IRR
- 11.4%
- Equity multiple
- 1.57×
- Total profit
- $10,652
- Equity at exit
- $21,507
- IRR
- 15.6%
- Equity multiple
- 2.82×
- Total profit
- $34,064
- Equity at exit
- $27,552
Cash invested: $18,760 (down + closing). Projections, not guarantees.
Landlord ↔ Tenant lean methodology
- Overall (STATE)
- 83 Strongly Landlord-Friendly
- State Kansas
- 83 Strongly Landlord-Friendly · R+10
- County
- — inherits STATE
- City
- — inherits STATE
ZIP-level market 67123
- Home prices YoY
- 0.3%
- Active inventory
- 2
- Price-to-rent
- 7.2×
Monthly cashflow live
- Estimated rent
- $778 medium interval (Pro) →
- Mortgage (P&I)
- −$351
- Tax from tax record
- −$68 /mo · $813/yr
- Insurance
- −$28
- HOA
- −$0
- Vacancy / Maint / Mgmt
- −$163
- Net cashflow
- $168
Break-even live
UW: 25.0% down · 7.5% · 30yr · 1.5% tax · 5.0% vac · 8.0% maint · 8.0% mgmt
Financing live
Cash to close
- Down payment
- $16,750
- Closing costs
- $2,010
- Reserves months
- —
- Total cash needed
- —
Loan-product check · same deal, 3 products live
Conventional
25% down · 7.5% · 30yr
- Down + closing
- —
- Monthly P&I
- —
- Monthly cashflow
- —
- DSCR
- —
- Eligible?
- —
Personal DTI + credit; lowest rate.
DSCR
20% down · 8.5% · 30yr
- Down + closing
- —
- Monthly P&I
- —
- Monthly cashflow
- —
- DSCR
- —
- Eligible?
- —
No personal income docs; deal must DSCR.
Hard money
10% down · 12.0% · 12mo
- Down + closing
- —
- Monthly P&I
- —
- Monthly cashflow
- —
- DSCR
- —
- Eligible?
- —
Short-term bridge; refi at stabilization.
Listing history 16 events
-
2026-06-18days on market $67,000 Active 28 DOM
-
2026-06-17days on market $67,000 Active 27 DOM
-
2026-06-16days on market $67,000 Active 26 DOM
-
2026-06-15days on market $67,000 Active 25 DOM
-
2026-06-14pricedays on market $67,000 Active 23 DOM
-
2026-06-10days on market $70,000 Active 20 DOM
-
2026-06-09days on market $70,000 Active 19 DOM
-
2026-06-08days on market $70,000 Active 18 DOM
-
2026-06-07days on market $70,000 Active 17 DOM
-
2026-06-03days on market $70,000 Active 13 DOM
-
2026-06-02days on market $70,000 Active 12 DOM
-
2026-06-01days on market $70,000 Active 11 DOM
-
2026-05-31days on market $70,000 Active 10 DOM
-
2026-05-30days on market $70,000 Active 9 DOM
-
2026-05-21$70,000 Active
-
2006-12-14soldstatus
ⓘ Source: listings_history table (triggers on properties + properties_extension) + one-shot
backfill from property_details.listing_events for pre-trigger history.
Tax reassessment forecast KS · Resets to sale price
- Current annual tax
- $813 · $68/mo
- Projected year-2 tax
- $945 · $79/mo
- Expected delta
- +$131/yr (+$11/mo · 16.1%)
ⓘ Screening estimate from a state-policy table — verify with the county assessor before closing.
Climate risk First Street
- Flood 1/10 Low FEMA zone X (unshaded) · 0% chance over 30 yrs
- Wildfire 5/10 Major
- Heat 5/10 Major 7 d/yr ≥107°F today · 18 d/yr by 30 yrs out
- Wind 2/10 Low 0% chance of damaging wind over 30 yrs
- Air quality 3/10 Moderate 2 unhealthy d/yr today · 3 by 30 yrs out
Nearby sold comps map
Loading sold comps map…
Walkable amenities ~0.75 mi
Loading nearby amenities…
Taxation est. · year 1
- Rental income
- $9,338
- − Mortgage interest
- −$3,753
- − Property taxes
- −$813
- − Insurance
- −$335
- − Repairs & maintenance
- −$747
- − Management
- −$747
- − Depreciation
- −$1,949
- Taxable income
- $993
- Est. tax owed @ 24.0%
- −$238
- After-tax cash flow
- $1,774/yr
For passive investors: Depreciation is non-cash, so a rental often shows a tax loss while cash-flowing — sheltering income. Rental losses are passive: they offset passive income freely, and up to $25,000/yr can offset ordinary (W-2) income if you actively participate and your MAGI is under $100k (phasing out to $0 by $150k); unused losses carry forward. On sale, claimed depreciation is recaptured at up to 25%, and gains may owe capital-gains tax (a 1031 exchange can defer both). Figures are a year-1 estimate at your 24.0% rate — not tax advice; consult a CPA.
Schools (NCES district)
- District
- Remington-Whitewater
- NCES district ID
- 2006240
- Math proficiency
- 36% ▲ 4.00%
- Reading proficiency
- 42% ▲ 4.00%
- Median HH income
- $58,876
- Composite
- 34.5/100
- National rank
- #5179
- State rank
- #31 of 169 in KS
Livability — Potwin
- Score
- 56/100
- State rank
- #555
- US rank
- #22849
Category grades
Schools grade is shown separately in the Schools card above.
Census & demographics
- Census place
- Potwin, KS
- Population (ZIP)
- 783
Population outlook (Butler County) Hauer SSP2
- Today (2025)
- 69,002 people
- By 2030
- 69,822 · +1.2%
- By 2040
- 70,461 · +2.1%
- By 2050
- 69,940 · +1.4%
- By 2075
- 68,666 · -0.5%
- By 2100
- 63,071 · -8.6%
Race, ethnicity, and origin ACS 2023
- Neighborhood character
- Predominantly White (84%)
- Race & ethnicity
- White 84% Two or more races 13% Hispanic / Latino 3%
- Common ancestry
- Slovak 3% Italian 2% Scotch-Irish 2%
Political lean MEDSL · Butler
- 2024 margin
- Solid R (+41.2) · D 28.4% · R 69.6% · Other 2.0%
- 2008→2024 swing
- -8.9pp toward R · 2008: -32.3pp · 2024: -41.2pp
- All cycles
- 2024: R+41.2 2020: R+41.5 2016: R+45.4 2012: R+41.8 2008: R+32.3
Not yet ingested
- Civics
- —
Market trends
- HPI YoY
- ▲ 0.61%
- Current HPI
- 206.1936
- Rent YoY
- —
- Metro
- —
- State GDP YoY
- —
- F500 in state
- 0
Price history
2 events — show timeline
- 2026-05-21 Listed $70,000 SCKMLS as Distributed by MLS Grid
- 2006-12-14 Sold (Public Records) — Public Records
Property tax history
+7.7%/yrLatest (2025): $813 · +4.5% YoY. Source: county tax records.
Cash-flow waterfall
monthlySold comps — $/sqft
last 12 mo · ≤1 miLoading sold comps…