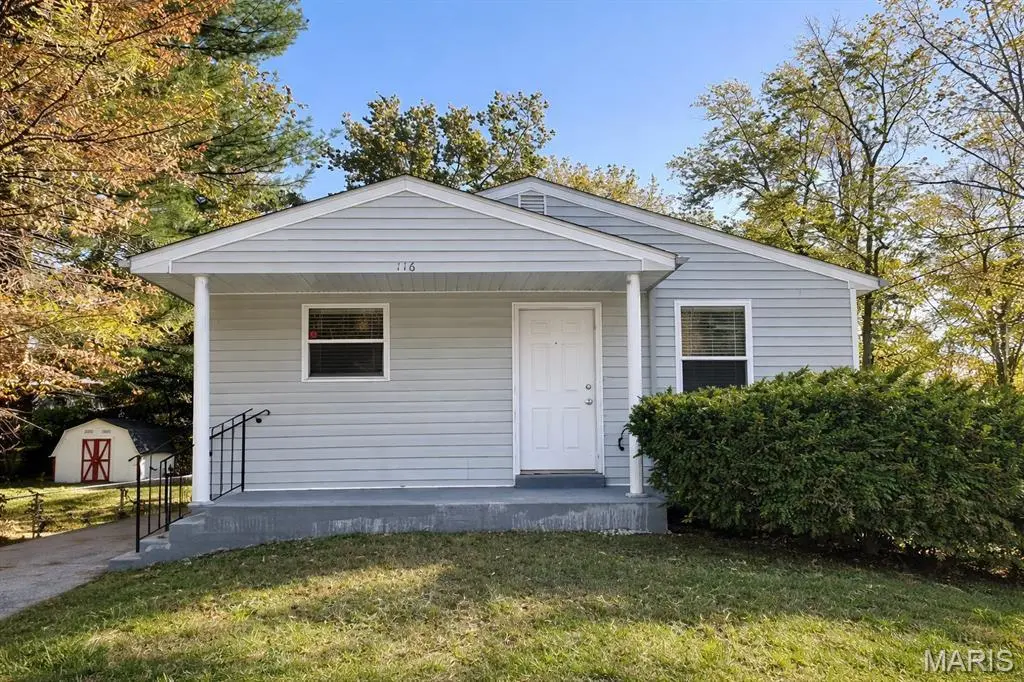
116 Grether Ave · Hazelwood, MO
Flood risk 1/10 · Minimal
- FEMA flood zone
- X (unshaded)
- Chance of flooding over 30 yrs
- 0.0%
- Est. flood insurance / yr
- $473 – $860
Fire risk 1/10 · Minimal
- Est. fire insurance / yr
- $1,054 – $1,958
Heat risk 4/10 · Minor
- Hot days now (above 106°F)
- 7 days/yr
- Hot days in 30 yrs
- 20 days/yr
Wind risk 2/10 · Minimal
- Chance of severe wind over 30 yrs
- 1.0%
Air-quality risk 3/10 · Minor
- Unhealthy air days now
- 3 days/yr
- Unhealthy air days in 30 yrs
- 5 days/yr
Risk factors via First Street. Map © Google.
Why this score? — see what drove the B- grade
The composite is a weighted blend of 9 inputs, each scored 0–100. Each bar is that input's sub-score; the figure is the points it added to the 100-point composite (weight × sub-score).
- Cash flow +29.5/30.0
- DSCR +10.0/10.0
- 1% rule +7.5/10.0
- ARV discount +7.3/15.0
- Rent growth +4.8/5.0
- Livability +3.1/5.0
- Condition / age +2.5/5.0
- Schools +1.2/10.0
- Appreciation +0.0/10.0
$109,900
🖨 Deal sheet 📄 Offer letter ✓ Due diligence
Listing remarks MLS
Welcome to this charming 3-bedroom, 1-bath ranch-style home featuring a bright and inviting open floor plan. Enjoy easy living with low-maintenance laminate flooring flowing throughout the main level. The spacious living area seamlessly connects to the kitchen and dining space, making it perfect for entertaining or everyday comfort. Downstairs, you’ll find an unfinished basement full of potential—ideal for adding extra living space, a recreation room, or a home office. Situated on a level lot, this home offers a versatile yard that’s great for outdoor activities, gardening, or relaxing evenings. With its simple layout and endless possibilities, this property is the perfect opportunity to make it your own!
Key facts
- 6,229 sq ft lot
- Built 1991
- Listed 10 days
Property features AI
Finance
- Financial info: Lease not considered
Exterior
- Utilities: Public water; Public sewer; Ameren electric; Cable available; Electricity available; Natural gas available
- Home design: Single-family residence; One story; House
- Construction: Vinyl siding
- Exterior features: Back yard
Interior
- Bedrooms: Three bedrooms on the main level
- Bathrooms: One full bathroom on the main level
- Heating & cooling: Forced air heating; Central air conditioning
- Interior features: Full basement
Neighborhood map
What this means for you Summary
Snapshot
- This is a 3-bed/1.0-bath single-family listed at $110k.
Deal economics
- At list price, monthly cash flow is $395 ($5k/yr) — positive.
- The deal already cash-flows at list — no discount required.
- Meets the 1% rule at list price ($1k rent vs $110k).
- Cap rate 10.6% vs local median 7.2% in Hazelwood — top-decile yield for the area; either an underpriced asset or a hidden risk that comps aren't pricing in. Stress-test before assuming the spread holds.
Location & tenants
- Location reads 62/100 on livability (#395 in MO) — a middle-class / working-renter tenant base. Strengths: cost of living A+, housing A+; Watch: crime F, amenities F, commute F.
- Ferguson-Florissant R-II (suburban): math 7% / reading 20% proficiency, ranked #311 of 324 in MO (top 96%) — low school quality limits family demand, transient renter base, plan for 1-2y turnover; 70% free/reduced lunch — lower-income household profile, screen leases tightly.
- Zoned schools: Walnut Grove Elem. (342 students, 99% FRL); Mccluer High (math 0% / reading 17%, grade F, #511 of 521 statewide, top 98%, 1,181 students, 100% FRL) — zoned schools average 99% FRL vs 70% district-wide (30 pts higher); higher-poverty schools than district average — tighter screening recommended.
- Market conditions: Rents rising fast (+9.0%/yr); 162 active listings in the ZIP; 40 comparable units currently listed for rent nearby; rentals at typical pace (median 24d on market — plan ~3-4 weeks tenant-placement turnaround); 920 units permitted in St. Louis County in 2024 (250 in 5+ unit buildings).
- This rent runs 31% of the median local income ($52k/yr) — at the standard rent-burdened threshold; future hikes will face affordability resistance.
Forward outlook
- Local home prices are declining (-3.0%/yr); year-one equity from $760 of loan paydown is wiped out by about $3k of value loss. Plan a longer hold.
- At projected returns (-3.0% appreciation + 8.0% rent growth), your $31k cash investment doubles in ~6 years — after that, you're playing with house money.
Negotiation context
- Only 10 days on market — expect competitive offers; lowballing is unlikely to land.
- 7 sale attempts since 2y ago with the ask held roughly flat each time — persistent listings suggest the price (not the market) is what's stuck; bring a comps-based counter.
- Current owner paid $64k; list at $110k implies a 72% gain — meaningful room to come down on a strong offer.
Questions for the listing agent
- Is there a deadline driving the sale (1031 exchange, divorce, estate, relocation)? That informs how much negotiation room exists.
- Schools are D-rated, which usually means shorter tenancies and higher turnover. Who's the typical renter profile here, and what's been the actual vacancy rate?
- Crime grade is F in this area — have there been break-ins, vandalism, or insurance claims at this property in the last 3 years? What carrier currently insures it and at what premium?
- What's the average days-on-market for RENTAL listings here right now (not sales)? A rising rental-DOM trend means longer vacancies and softer asking-rent achievability than the comps imply.
- What's the recent tenant-quality profile in this submarket — average credit score on applications, eviction rate, late-payment / NSF rate, and stable-employment percentage? A property-management company in the area should have these aggregated.
- How much new for-sale + rental construction is in the pipeline within 1–3 miles? Heavy new supply typically softens prices + rents 12–24 months out; constrained supply supports both.
Investment metrics
- 1% rule
- 1.25% ✓
- Cap rate
- 10.60%
- Cash-on-cash
- 15.39%
- DSCR
- 1.68
- GRM
- 6.7
CMA / ARV
- ARV (on-the-fly)
- $109,512
- Comps found
- 12
Show comp detail 12 sales within ~0.75 mi
| Address | Dist | Beds/Ba | Sqft | Sold | Price | $/sf | Match |
|---|---|---|---|---|---|---|---|
| 116 Grether Ave | 0.00mi | 3/1.0 | 936 (0%) | 1mo | $109,900 | $117 | 100 |
| 6637 Torlina Dr | 0.40mi | 3/1.0 | 960 (+3%) | 2mo | $109,900 | $114 | 76 |
| 194 Elbring Dr | 0.19mi | 3/1.5 | 864 (-8%) | 3mo | $109,600 | $127 | 74 |
| 6625 Thurston Ave | 0.43mi | 2/1.0 (-1) | 939 (+0%) | 4mo | $74,900 | $80 | 72 |
| 201 Becker Dr | 0.50mi | 3/1.0 | 962 (+3%) | 2mo | $130,000 | $135 | 70 |
| 6717 Thurston Ave | 0.32mi | 2/1.0 (-1) | 840 (-10%) | 2mo | $60,000 | $71 | 62 |
| 233 Buddie Ave | 0.43mi | 2/1.0 (-1) | 862 (-8%) | 0mo | $74,900 | $87 | 62 |
| 211 Frost Ave | 0.35mi | 3/1.0 | 1,066 (+14%) | 2mo | $84,900 | $80 | 59 |
| 258 Williams Blvd | 0.36mi | 3/1.0 | 1,075 (+15%) | 0mo | $129,900 | $121 | 58 |
| 116 Barto Dr | 0.52mi | 3/1.0 | 836 (-11%) | 3mo | $115,000 | $138 | 55 |
| 1825 S New Florissant Rd | 0.57mi | 2/1.0 (-1) | 1,029 (+10%) | 2mo | $125,000 | $121 | 50 |
| 8379 Midwood Ave | 0.65mi | 2/1.0 (-1) | 1,052 (+12%) | 2mo | $89,900 | $85 | 42 |
Match score weights: distance 35% · size 25% · config 20% · recency 20%. Top-matched comps best support the ARV.
Projected returns pro-forma
-3.0% appreciation · 8.0% rent growth · sell at horizon
- IRR
- 11.3%
- Equity multiple
- 1.47×
- Total profit
- $14,534
- Equity at exit
- $16,386
- IRR
- 23.8%
- Equity multiple
- 3.53×
- Total profit
- $77,839
- Equity at exit
- $9,502
Cash invested: $30,772 (down + closing). Projections, not guarantees.
Landlord ↔ Tenant lean methodology
- Overall (STATE)
- 81 Strongly Landlord-Friendly
- State Missouri
- 81 Strongly Landlord-Friendly · R+10
- County
- — inherits STATE
- City
- — inherits STATE
ZIP-level market 63135
- Rents YoY
- 9.0%
- Active inventory
- 162
- Price-to-rent
- 6.7×
Monthly cashflow live
- Estimated rent
- $1,368 high interval (Pro) →
- Mortgage (P&I)
- −$576
- Tax from tax record
- −$64 /mo · $772/yr
- Insurance
- −$46
- HOA
- −$0
- Vacancy / Maint / Mgmt
- −$287
- Net cashflow
- $395
Break-even live
UW: 25.0% down · 7.5% · 30yr · 1.5% tax · 5.0% vac · 8.0% maint · 8.0% mgmt
Financing live
Cash to close
- Down payment
- $27,475
- Closing costs
- $3,297
- Reserves months
- —
- Total cash needed
- —
Loan-product check · same deal, 3 products live
Conventional
25% down · 7.5% · 30yr
- Down + closing
- —
- Monthly P&I
- —
- Monthly cashflow
- —
- DSCR
- —
- Eligible?
- —
Personal DTI + credit; lowest rate.
DSCR
20% down · 8.5% · 30yr
- Down + closing
- —
- Monthly P&I
- —
- Monthly cashflow
- —
- DSCR
- —
- Eligible?
- —
No personal income docs; deal must DSCR.
Hard money
10% down · 12.0% · 12mo
- Down + closing
- —
- Monthly P&I
- —
- Monthly cashflow
- —
- DSCR
- —
- Eligible?
- —
Short-term bridge; refi at stabilization.
Rent comps 40 comps
| Address | Beds | Baths | Sqft | Rent | $/sqft | DOM | Units | Dist |
|---|---|---|---|---|---|---|---|---|
| 24 Vierling Dr Saint Louis, MO | 2.0 | 1.0 | 850 | $1,290 | $1.52 | 7d | 1 | 0.13mi |
| 153 Bascom Dr Saint Louis, MO | 3.0 | 1.0 | 1076 | $1,195 | $1.11 | 19d | 1 | 0.16mi |
| 46 Bascom Dr Saint Louis, MO | 2.0 | 1.0 | 932 | $1,175 | $1.26 | 43d | 1 | 0.19mi |
| 171 Elbring Dr Saint Louis, MO | 3.0 | 1.5 | 1008 | $1,395 | $1.38 | 12d | 1 | 0.22mi |
| 1275 N Florissant Rd Saint Louis, MO | 2.0 | 1.0 | 1008 | $1,275 | $1.26 | 23d | 1 | 0.27mi |
| 107 Anistasia Dr Saint Louis, MO | 2.0 | 2.0 | 1030 | $1,400 | $1.36 | 23d | 1 | 0.31mi |
| 11 Anistasia Dr Saint Louis, MO | 3.0 | 1.5 | 1120 | $1,345 | $1.20 | 23d | 1 | 0.38mi |
| 6625 Thurston Ave Saint Louis, MO | 2.0 | 1.0 | 939 | $1,300 | $1.38 | 43d | 1 | 0.39mi |
| 6625 Thurston Ave Saint Louis, MO | 2.0 | 1.0 | 939 | $1,400 | $1.49 | 23d | 1 | 0.39mi |
| 260 Sadonia Ave Saint Louis, MO | 3.0 | 2.0 | 1088 | $1,623 | $1.49 | 20d | 1 | 0.46mi |
| 36 Connolly Dr Saint Louis, MO | 3.0 | 1.0 | 1024 | $1,149 | $1.12 | 23d | 1 | 0.48mi |
| 263 Sadonia Ave Saint Louis, MO | 3.0 | 2.0 | 888 | $1,350 | $1.52 | 43d | 1 | 0.48mi |
| 24 Barto Dr Saint Louis, MO | 3.0 | 1.0 | 864 | $1,400 | $1.62 | 43d | 1 | 0.53mi |
| 241 Flora Dr Saint Louis, MO | 2.0 | 1.0 | 703 | $1,075 | $1.53 | 23d | 1 | 0.55mi |
| 8330 Woodhurst Dr Saint Louis, MO | 3.0 | 1.0 | 1120 | $1,000 | $0.89 | 7d | 1 | 0.56mi |
| 7025 Richwood Ln Hazelwood, MO | 3.0 | 1.0 | 936 | $1,375 | $1.47 | 17d | 1 | 0.62mi |
| 221 Barto Dr Saint Louis, MO | 3.0 | 2.0 | 958 | $1,295 | $1.35 | 20d | 1 | 0.64mi |
| 220 Du Bourg Ln Florissant, MO | 2.0 | 1.0 | 816 | $1,150 | $1.41 | 43d | 1 | 0.70mi |
| 6333 Peurifoy Ave Saint Louis, MO | 3.0 | 2.0 | 840 | $1,295 | $1.54 | 23d | 1 | 0.80mi |
| 1465 W Duchesne Dr Florissant, MO | 3.0 | 1.0 | 896 | $1,500 | $1.67 | 43d | 1 | 0.88mi |
| 6336 Washington Ave Berkeley, MO | 2.0 | 1.0 | 720 | $1,175 | $1.63 | 43d | 1 | 0.93mi |
| 6334 Washington Ave Berkeley, MO | 3.0 | 1.0 | 864 | $1,100 | $1.27 | 4d | 1 | 0.94mi |
| 222 Henquin Dr Saint Louis, MO | 2.0 | 1.0 | 816 | $1,050 | $1.29 | 17d | 1 | 0.95mi |
| 6315 Washington Ave Berkeley, MO | 2.0 | 1.0 | 739 | $1,175 | $1.59 | 16d | 1 | 0.99mi |
| 6132 Eaton Dr Saint Louis, MO | 2.0 | 1.0 | 792 | $1,125 | $1.42 | 23d | 1 | 1.00mi |
| 6156 Wulff Dr Saint Louis, MO | 3.0 | 2.0 | 960 | $1,425 | $1.48 | 10d | 1 | 1.01mi |
| 50 Lynn Meadows Ln Florissant, MO | 3.0 | 1.0 | 864 | $1,450 | $1.68 | 23d | 1 | 1.04mi |
| 1180 S New Florissant Rd Florissant, MO | 3.0 | 1.0 | 925 | $1,225 | $1.32 | 23d | 1 | 1.05mi |
| 6214 Jefferson Ave Saint Louis, MO | 2.0 | 1.0 | 816 | $1,195 | $1.46 | 23d | 1 | 1.06mi |
| 8306 Whitewater Dr Saint Louis, MO | 3.0 | 1.0 | 792 | $1,195 | $1.51 | 7d | 1 | 1.08mi |
| 8507 Tally Ho Dr Hazelwood, MO | 2.0 | 1.5 | 1478 | $1,300 | $0.88 | 43d | 5 | 1.09mi |
| 6044 Cascade Dr Saint Louis, MO | 2.0 | 1.0 | 984 | $1,150 | $1.17 | 7d | 1 | 1.10mi |
| 60 Mayme Dr Saint Louis, MO | 3.0 | 1.0 | 960 | $1,285 | $1.34 | 43d | 1 | 1.15mi |
| 6234 Hancock Ave Berkeley, MO | 2.0 | 1.0 | 846 | $1,050 | $1.24 | 43d | 1 | 1.16mi |
| 910 Disco Dr Saint Louis, MO | 3.0 | 1.0 | 924 | $1,260 | $1.36 | 16d | 1 | 1.21mi |
| 135 Saint Maurice Ln Florissant, MO | 3.0 | 1.0 | 816 | $1,395 | $1.71 | 43d | 1 | 1.24mi |
| 401 Millman Dr Saint Louis, MO | 3.0 | 1.0 | 1008 | $1,450 | $1.44 | 16d | 1 | 1.30mi |
| 1050 Ozment Dr Florissant, MO | 3.0 | 2.0 | 984 | $1,525 | $1.55 | 43d | 1 | 1.30mi |
| 601 Carson Rd Saint Louis, MO | 2.0 | 1.0 | 743 | $950 | $1.28 | 23d | 1 | 1.31mi |
| 650 Robert Ave Ferguson, MO | 3.0 | 1.0 | 816 | $1,224 | $1.50 | 43d | 1 | 1.35mi |
Listing history 23 events
-
2026-04-30status Pending
-
2026-04-20$109,900 Active
-
2025-12-15historical $1,395
-
2025-12-02price $1,395
-
2025-11-11$1,445
-
2025-11-03soldstatus Closed 732-char remark
Show marketing remark (732 chars)
Welcome to this charming 3-bedroom, 1-bath ranch-style home featuring a bright and inviting open floor plan. Enjoy easy living with low-maintenance laminate flooring flowing throughout the main level. The spacious living area seamlessly connects to the kitchen and dining space, making it perfect for entertaining or everyday comfort. Downstairs, you’ll find an unfinished basement full of potential—ideal for adding extra living space, a recreation room, or a home office. Situated on a level lot, this home offers a versatile yard that’s great for outdoor activities, gardening, or relaxing evenings. With its simple layout and endless possibilities, this property is the perfect opportunity to make it your own!
-
2025-09-26historical Active Under Contract 732-char remark
Show marketing remark (732 chars)
Welcome to this charming 3-bedroom, 1-bath ranch-style home featuring a bright and inviting open floor plan. Enjoy easy living with low-maintenance laminate flooring flowing throughout the main level. The spacious living area seamlessly connects to the kitchen and dining space, making it perfect for entertaining or everyday comfort. Downstairs, you’ll find an unfinished basement full of potential—ideal for adding extra living space, a recreation room, or a home office. Situated on a level lot, this home offers a versatile yard that’s great for outdoor activities, gardening, or relaxing evenings. With its simple layout and endless possibilities, this property is the perfect opportunity to make it your own!
-
2025-09-25$120,000 Active 732-char remark
Show marketing remark (732 chars)
Welcome to this charming 3-bedroom, 1-bath ranch-style home featuring a bright and inviting open floor plan. Enjoy easy living with low-maintenance laminate flooring flowing throughout the main level. The spacious living area seamlessly connects to the kitchen and dining space, making it perfect for entertaining or everyday comfort. Downstairs, you’ll find an unfinished basement full of potential—ideal for adding extra living space, a recreation room, or a home office. Situated on a level lot, this home offers a versatile yard that’s great for outdoor activities, gardening, or relaxing evenings. With its simple layout and endless possibilities, this property is the perfect opportunity to make it your own!
-
2025-09-23historical $120,000 732-char remark
Show marketing remark (732 chars)
Welcome to this charming 3-bedroom, 1-bath ranch-style home featuring a bright and inviting open floor plan. Enjoy easy living with low-maintenance laminate flooring flowing throughout the main level. The spacious living area seamlessly connects to the kitchen and dining space, making it perfect for entertaining or everyday comfort. Downstairs, you’ll find an unfinished basement full of potential—ideal for adding extra living space, a recreation room, or a home office. Situated on a level lot, this home offers a versatile yard that’s great for outdoor activities, gardening, or relaxing evenings. With its simple layout and endless possibilities, this property is the perfect opportunity to make it your own!
-
2025-06-15historical $1,370
-
2025-06-08price $1,370
-
2025-05-22$1,395
-
2025-05-17historical $1,395
-
2025-05-14$1,395
-
2024-10-25soldstatus Closed 474-char remark
Show marketing remark (474 chars)
This Property was recently tenant occupied. Currently vacant but listed for rent. Will sell or rent which ever comes first. This property is in great shape. All appliances included in purchase. This is a great buy an hold investment property to add to any investors portfolio. All agents can go and show at will. The property is vacant. Seller will not pay for inspections or repairs property being sold AS-IS. All offers to be sent to email address listed in agent remarks.
-
2024-10-06historical $1,337
-
2024-09-26status Pending 474-char remark
Show marketing remark (474 chars)
This Property was recently tenant occupied. Currently vacant but listed for rent. Will sell or rent which ever comes first. This property is in great shape. All appliances included in purchase. This is a great buy an hold investment property to add to any investors portfolio. All agents can go and show at will. The property is vacant. Seller will not pay for inspections or repairs property being sold AS-IS. All offers to be sent to email address listed in agent remarks.
-
2024-09-21$92,999 Active 474-char remark
Show marketing remark (474 chars)
This Property was recently tenant occupied. Currently vacant but listed for rent. Will sell or rent which ever comes first. This property is in great shape. All appliances included in purchase. This is a great buy an hold investment property to add to any investors portfolio. All agents can go and show at will. The property is vacant. Seller will not pay for inspections or repairs property being sold AS-IS. All offers to be sent to email address listed in agent remarks.
-
2024-08-12$1,337
-
2018-08-24soldstatus $64,000
-
2018-01-10soldstatus $35,000
-
2010-01-11soldstatus $817,719
-
1991-05-01soldstatus
ⓘ Source: listings_history table (triggers on properties + properties_extension) + one-shot
backfill from property_details.listing_events for pre-trigger history.
Tax reassessment forecast MO · Resets to sale price
- Current annual tax
- $772 · $64/mo
- Projected year-2 tax
- $1,066 · $89/mo
- Expected delta
- +$294/yr (+$25/mo · 38.1%)
ⓘ Screening estimate from a state-policy table — verify with the county assessor before closing.
Climate risk First Street
- Flood 1/10 Low FEMA zone X (unshaded) · 0% chance over 30 yrs
- Wildfire 1/10 Low
- Heat 4/10 Moderate 7 d/yr ≥106°F today · 20 d/yr by 30 yrs out
- Wind 2/10 Low 100% chance of damaging wind over 30 yrs
- Air quality 3/10 Moderate 3 unhealthy d/yr today · 5 by 30 yrs out
Nearby sold comps map
Loading sold comps map…
Walkable amenities ~0.75 mi
Loading nearby amenities…
Taxation est. · year 1
- Rental income
- $16,422
- − Mortgage interest
- −$6,156
- − Property taxes
- −$772
- − Insurance
- −$550
- − Repairs & maintenance
- −$1,314
- − Management
- −$1,314
- − Depreciation
- −$3,197
- Taxable income
- $3,119
- Est. tax owed @ 24.0%
- −$749
- After-tax cash flow
- $3,987/yr
For passive investors: Depreciation is non-cash, so a rental often shows a tax loss while cash-flowing — sheltering income. Rental losses are passive: they offset passive income freely, and up to $25,000/yr can offset ordinary (W-2) income if you actively participate and your MAGI is under $100k (phasing out to $0 by $150k); unused losses carry forward. On sale, claimed depreciation is recaptured at up to 25%, and gains may owe capital-gains tax (a 1031 exchange can defer both). Figures are a year-1 estimate at your 24.0% rate — not tax advice; consult a CPA.
Schools (NCES district)
- District
- Ferguson-Florissant R-II
- NCES district ID
- 2912010
- Math proficiency
- 7% ▼ -9.00%
- Reading proficiency
- 20% ▼ -6.00%
- Median HH income
- $44,610
- Composite
- 11.96/100
- National rank
- #9666
- State rank
- #311 of 324 in MO
Livability — Hazelwood
- Score
- 62/100
- State rank
- #395
- US rank
- #16956
Category grades
Schools grade is shown separately in the Schools card above.
Census & demographics
- Census place
- Hazelwood, MO
- County
- Saint Louis County · 888,823 people
- City population
- 17,813
- Metro
- St. Louis, MO-IL
- Population (ZIP)
- 18,381
- Household income
- $52,328
- Rent vs Own
- Severe rent burden
- 957.0
Population outlook (St. Louis County) Hauer SSP2
- Today (2025)
- 1,025,227 people
- By 2030
- 1,028,023 · +0.3%
- By 2040
- 1,020,940 · -0.4%
- By 2050
- 1,007,280 · -1.8%
- By 2075
- 987,277 · -3.7%
- By 2100
- 921,984 · -10.1%
Race, ethnicity, and origin ACS 2023
- Neighborhood character
- Predominantly Black (66%)
- Race & ethnicity
- Black 66% White 28% Two or more races 3% Hispanic / Latino 2%
- Common ancestry
- Lithuanian 1% Iranian 1% Romanian 1%
- Foreign-born
- 1% · Canada
- Languages at home
- 95% English-only · Spanish 4%
Political lean MEDSL · St. Louis
- 2024 margin
- Strong D (+23.4) · D 60.8% · R 37.4% · Other 1.7%
- 2008→2024 swing
- +3.5pp toward D · 2008: 19.9pp · 2024: 23.4pp
- All cycles
- 2024: D+23.4 2020: D+24.0 2016: D+16.2 2012: D+13.7 2008: D+19.9
Not yet ingested
- Civics
- —
Market trends
- HPI YoY
- ▼ -152.56%
- Current HPI
- 138.6781
- Rent YoY
- ▲ 9.03%
- Metro
- St. Louis, MO-IL
- State GDP YoY
- ▲ 1.84%
- F500 in state
- 20
Industry mix (Fortune 500 HQ in MO)
| Industry | F500 HQs | Revenue |
|---|---|---|
| Healthcare | 1 | $163B |
|
||
| Insurance | 1 | $21B |
|
||
| Industrial Technology | 1 | $17B |
|
||
| Retail | 1 | $16B |
|
||
| Industrial Distribution | 1 | $10B |
|
||
| Utilities | 1 | $9B |
|
||
Price history
-86.6% since first listed23 events — show timeline
- 2026-04-30 Pending — MARIS as Distributed by MLS Grid
- 2026-04-20 Listed $109,900 MARIS as Distributed by MLS Grid
- 2025-12-15 Rental Removed $1,395 SHOWMOJO
- 2025-12-02 Price Changed $1,395 SHOWMOJO
- 2025-11-11 Listed for Rent $1,445 SHOWMOJO
- 2025-11-03 Sold (MLS) — MARIS as Distributed by MLS Grid
- 2025-09-26 Contingent — MARIS as Distributed by MLS Grid
- 2025-09-25 Listed $120,000 MARIS as Distributed by MLS Grid
- 2025-09-23 Coming Soon $120,000 MARIS as Distributed by MLS Grid
- 2025-06-15 Rental Removed $1,370 RENTLY
- 2025-06-08 Price Changed $1,370 RENTLY
- 2025-05-22 Listed for Rent $1,395 RENTLY
- 2025-05-17 Rental Removed $1,395 RENTLY
- 2025-05-14 Listed for Rent $1,395 RENTLY
- 2024-10-25 Sold (MLS) — MARIS as Distributed by MLS Grid
- 2024-10-06 Rental Removed $1,337 RENTFEEDER
- 2024-09-26 Pending — MARIS as Distributed by MLS Grid
- 2024-09-21 Listed $92,999 MARIS as Distributed by MLS Grid
- 2024-08-12 Listed for Rent $1,337 RENTFEEDER
- 2018-08-24 Sold (Public Records) $64,000 Public Records
- 2018-01-10 Sold (Public Records) $35,000 Public Records
- 2010-01-11 Sold (Public Records) $817,719 Public Records
- 1991-05-01 Sold (Public Records) — Public Records
Property tax history
+4.4%/yrLatest (2022): $772 · +0.5% YoY. Source: county tax records.
Cash-flow waterfall
monthlySold comps — $/sqft
last 12 mo · ≤1 miLoading sold comps…