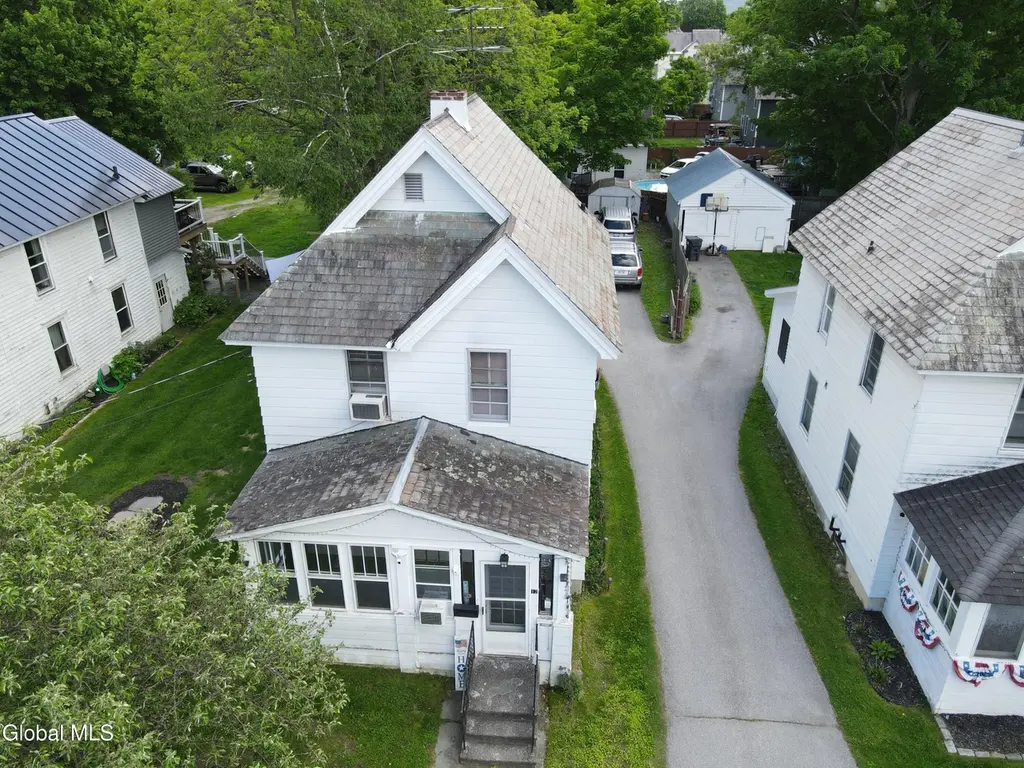
12 Pacific St · Granville, NY
Flood risk 1/10 · Minimal
- FEMA flood zone
- X
- Chance of flooding over 30 yrs
- 0.0%
- Est. flood insurance / yr
- $473 – $860
Fire risk 1/10 · Minimal
- Est. fire insurance / yr
- $691 – $1,283
Heat risk 3/10 · Minor
- Hot days now (above 94°F)
- 7 days/yr
- Hot days in 30 yrs
- 17 days/yr
Wind risk 2/10 · Minimal
- Chance of severe wind over 30 yrs
- 3.0%
Air-quality risk 2/10 · Minimal
- Unhealthy air days now
- 0 days/yr
- Unhealthy air days in 30 yrs
- 1 days/yr
Risk factors via First Street. Map © Google.
Why this score? — see what drove the B- grade
The composite is a weighted blend of 9 inputs, each scored 0–100. Each bar is that input's sub-score; the figure is the points it added to the 100-point composite (weight × sub-score).
- Cash flow +23.4/30.0
- ARV discount +15.0/15.0
- 1% rule +7.5/10.0
- DSCR +7.5/10.0
- Appreciation +4.4/10.0
- Schools +3.4/10.0
- Livability +3.1/5.0
- Rent growth +2.5/5.0
- Condition / age +2.5/5.0
$99,900
🖨 Deal sheet (PDF) 📄 Offer letter ✓ Due diligence
Listing remarks MLS
Nice home , barn garage, well kept, shared driveway, above ground pool, deck, many wood floors
Key facts
- Public sewer
- Spacious kitchen
- Vinyl siding
Tags
Property features AI
Exterior
- Parking: Two garage spaces; Two total parking spaces; Off-street paved driveway
- Security: Smoke detector(s); Carbon monoxide detector(s)
- Utilities: Public water; Public sewer; 150 amp electric service
- Home design: Single-family residence; Fixer condition
- Construction: Vinyl siding; Slate and asphalt roof
- Exterior features: Deck; Front porch; Glass-enclosed porch / 3-seasons room; Porch; Paved driveway / drive-paved; Wood fencing; Level, private lot
Interior
- Kitchen: Electric oven / oven; Range hood; Dishwasher; Refrigerator
- Bedrooms: Two bedrooms on the second floor; An additional second-floor room (other)
- Flooring: Wood flooring; Vinyl flooring
- Bathrooms: One full bathroom on the second floor; One half bathroom on the first floor
- Heating & cooling: Forced air oil heating; Window cooling units
- Interior features: Seven total rooms; Smoke and carbon monoxide detectors
- Laundry & utility: Washer and dryer included; Main-level laundry in a laundry closet
Neighborhood map
What this means for you Summary
Snapshot
- This is a 3-bed/1.5-bath single-family listed at $100k.
Deal economics
- At list price, monthly cash flow is $185 ($2k/yr) — positive.
- The deal already cash-flows at list — no discount required.
- Meets the 1% rule at list price ($1k rent vs $100k).
Location & tenants
- Location reads 62/100 on livability (#846 in NY) — a middle-class / working-renter tenant base. Strengths: cost of living A+, housing A+, crime B+; Watch: employment D, amenities F, commute F.
- Granville Central School District (town): math 38% / reading 43% proficiency, ranked #521 of 590 in NY (top 88%) — families likely to look elsewhere, expect single-tenant / working-renter base with shorter leases.
- Zoned schools: Granville Junior-Senior High School (math 57% / reading 42%, grade D, #974 of 1,100 statewide, top 91%, 496 students, 40% FRL) — zoned schools at 40% FRL track the district average.
- Market conditions: 62 active listings in the ZIP; 106 units permitted in Washington County in 2024 (0 in 5+ unit buildings).
Forward outlook
- Local home prices are declining (-1.3%/yr); year-one equity from $691 of loan paydown is wiped out by about $1k of value loss. Plan a longer hold.
- Washington County population projected at -20% by 2050 — secular population decline; favor cash flow + early exit over multi-decade hold.
- At projected returns (-1.3% appreciation + 3.0% rent growth), your $28k cash investment doubles in ~9 years — after that, you're playing with house money.
Negotiation context
- Only 3 days on market — expect competitive offers; lowballing is unlikely to land.
- 3 sale attempts since 22y ago with the ask held roughly flat each time — persistent listings suggest the price (not the market) is what's stuck; bring a comps-based counter.
- Current owner paid $80k; 26% above their basis — modest negotiation headroom, anchor on the comps not their cost.
Risks & watch-outs
- Watch-outs: property tax is 2.9% of price; built in 1900 — expect roof / HVAC / electrical / plumbing capex.
Questions for the listing agent
- Built in 1900 — when were the roof, HVAC, electrical panel, plumbing, and water heater last replaced?
- Property tax is high relative to price — has the assessment been appealed recently, and will the sale trigger a re-assessment?
- Is there a deadline driving the sale (1031 exchange, divorce, estate, relocation)? That informs how much negotiation room exists.
- Schools are D-rated, which usually means shorter tenancies and higher turnover. Who's the typical renter profile here, and what's been the actual vacancy rate?
- What's the average days-on-market for RENTAL listings here right now (not sales)? A rising rental-DOM trend means longer vacancies and softer asking-rent achievability than the comps imply.
- What's the recent tenant-quality profile in this submarket — average credit score on applications, eviction rate, late-payment / NSF rate, and stable-employment percentage? A property-management company in the area should have these aggregated.
- How much new for-sale + rental construction is in the pipeline within 1–3 miles? Heavy new supply typically softens prices + rents 12–24 months out; constrained supply supports both.
Investment metrics
- 1% rule
- 1.25% ✓
- Cap rate
- 8.52%
- Cash-on-cash
- 7.94%
- DSCR
- 1.35
- GRM
- 6.6
CMA / ARV
- ARV (on-the-fly)
- $172,056
- Comps found
- 12
Show comp detail 12 sales within ~0.75 mi
| Address | Dist | Beds/Ba | Sqft | Sold | Price | $/sf | Match |
|---|---|---|---|---|---|---|---|
| 17 S Maple St | 0.25mi | 3/1.5 | 1,265 (-2%) | 2mo | $145,000 | $115 | 84 |
| 2 Washington St | 0.09mi | 3/1.5 | 1,384 (+8%) | 6mo | $199,400 | $144 | 78 |
| 3 Potter Ave | 0.24mi | 3/1.0 | 1,297 (+1%) | 16mo | $57,750 | $45 | 72 |
| 1 Norton St | 0.18mi | 3/1.0 | 1,444 (+12%) | 1mo | $192,920 | $134 | 68 |
| 1 Bulkley Ave | 0.19mi | 3/1.5 | 1,144 (-11%) | 6mo | $154,000 | $135 | 68 |
| 36 Morrison Ave | 0.31mi | 3/2.0 | 1,400 (+9%) | 6mo | $154,250 | $110 | 63 |
| 23 E Quaker St | 0.40mi | 3/1.0 | 1,395 (+9%) | 3mo | $225,000 | $161 | 62 |
| 4 Morrison Ave | 0.17mi | 3/1.0 | 1,410 (+10%) | 19mo | $189,000 | $134 | 58 |
| 82 Mettowee St | 0.52mi | 3/1.0 | 1,348 (+5%) | 10mo | $61,000 | $45 | 57 |
| 16 Williams St | 0.20mi | 3/2.0 | 1,098 (-14%) | 15mo | $219,900 | $200 | 52 |
| 55 Pine St | 0.66mi | 4/1.5 (+1) | 1,386 (+8%) | 2mo | $55,000 | $40 | 49 |
| 22 Broadview Ter | 0.61mi | 2/1.5 (-1) | 1,410 (+10%) | 10mo | $200,000 | $142 | 42 |
Match score weights: distance 35% · size 25% · config 20% · recency 20%. Top-matched comps best support the ARV.
Projected returns pro-forma
-1.3% appreciation · 3.0% rent growth · sell at horizon
- IRR
- 2.5%
- Equity multiple
- 1.11×
- Total profit
- $3,021
- Equity at exit
- $22,697
- IRR
- 9.5%
- Equity multiple
- 1.89×
- Total profit
- $24,952
- Equity at exit
- $22,646
Cash invested: $27,972 (down + closing). Projections, not guarantees.
Landlord ↔ Tenant lean methodology
- Overall (STATE)
- 15 Strongly Tenant-Friendly
- State New York
- 15 Strongly Tenant-Friendly · D+10
- County
- — inherits STATE
- City
- — inherits STATE
ZIP-level market 12832
- Home prices YoY
- -0.4%
- Active inventory
- 62
- Price-to-rent
- 6.6×
Monthly cashflow live
- Estimated rent
- $1,253 medium interval (Pro) →
- Mortgage (P&I)
- −$524
- Tax from tax record
- −$239 /mo · $2,873/yr
- Insurance
- −$42
- HOA
- −$0
- Vacancy / Maint / Mgmt
- −$263
- Net cashflow
- $185
Break-even live
Sensitivity live
| Price | -10% $242 | -5% $213 | +0% $185 | +5% $157 | +10% $129 |
|---|---|---|---|---|---|
| Rent | -10% $86 | -5% $136 | +0% $185 | +5% $235 | +10% $284 |
| Rate | -1.0pp $235 | -0.5pp $210 | base $185 | +0.5pp $159 | +1.0pp $133 |
UW: 25.0% down · 7.5% · 30yr · 1.5% tax · 5.0% vac · 8.0% maint · 8.0% mgmt
Financing live
Cash to close
- Down payment
- $24,975
- Closing costs
- $2,997
- Reserves months
- —
- Total cash needed
- —
Loan-product check · same deal, 3 products live
Conventional
25% down · 7.5% · 30yr
- Down + closing
- —
- Monthly P&I
- —
- Monthly cashflow
- —
- DSCR
- —
- Eligible?
- —
Personal DTI + credit; lowest rate.
DSCR
20% down · 8.5% · 30yr
- Down + closing
- —
- Monthly P&I
- —
- Monthly cashflow
- —
- DSCR
- —
- Eligible?
- —
No personal income docs; deal must DSCR.
Hard money
10% down · 12.0% · 12mo
- Down + closing
- —
- Monthly P&I
- —
- Monthly cashflow
- —
- DSCR
- —
- Eligible?
- —
Short-term bridge; refi at stabilization.
Listing history 4 events
-
2026-06-05statusdays on market $99,900 Pending 3 DOM
-
2026-06-04days on market $99,900 Active 2 DOM
-
2026-06-01remarks 699-char remark
-
2026-06-01$99,900 Active 1 DOM
ⓘ Source: listings_history table (triggers on properties + properties_extension) + one-shot
backfill from property_details.listing_events for pre-trigger history.
Tax reassessment forecast NY · Partial reset (capped growth)
- Current annual tax
- $2,873 · $239/mo
- Projected year-2 tax
- $2,873 · $239/mo
- Expected delta
- $0/yr ($0/mo · 0.0%)
ⓘ Screening estimate from a state-policy table — verify with the county assessor before closing.
Climate risk First Street
- Flood 1/10 Low FEMA zone X · 0% chance over 30 yrs
- Wildfire 1/10 Low
- Heat 3/10 Moderate 7 d/yr ≥94°F today · 17 d/yr by 30 yrs out
- Wind 2/10 Low 3% chance of damaging wind over 30 yrs
- Air quality 2/10 Low 0 unhealthy d/yr today · 1 by 30 yrs out
Nearby sold comps map
Loading sold comps map…
Walkable amenities ~0.75 mi
Loading nearby amenities…
Taxation est. · year 1
- Rental income
- $15,037
- − Mortgage interest
- −$5,596
- − Property taxes
- −$2,873
- − Insurance
- −$500
- − Repairs & maintenance
- −$1,203
- − Management
- −$1,203
- − Depreciation
- −$2,906
- Taxable income
- $757
- Est. tax owed @ 24.0%
- −$182
- After-tax cash flow
- $2,039/yr
For passive investors: Depreciation is non-cash, so a rental often shows a tax loss while cash-flowing — sheltering income. Rental losses are passive: they offset passive income freely, and up to $25,000/yr can offset ordinary (W-2) income if you actively participate and your MAGI is under $100k (phasing out to $0 by $150k); unused losses carry forward. On sale, claimed depreciation is recaptured at up to 25%, and gains may owe capital-gains tax (a 1031 exchange can defer both). Figures are a year-1 estimate at your 24.0% rate — not tax advice; consult a CPA.
Schools (NCES district)
- District
- Granville Central School District
- NCES district ID
- 3612450
- Math proficiency
- 38% ▼ -5.00%
- Reading proficiency
- 43% ▼ -3.00%
- Median HH income
- $43,936
- Composite
- 34.32/100
- National rank
- #5237
- State rank
- #521 of 590 in NY
Livability — Granville
- Score
- 62/100
- State rank
- #846
- US rank
- #16391
Category grades
Schools grade is shown separately in the Schools card above.
Census & demographics
- Census place
- Granville, NY
- Population (ZIP)
- 6,395
Population outlook (Washington County) Hauer SSP2
- Today (2025)
- 59,576 people
- By 2030
- 57,618 · -3.3%
- By 2040
- 52,751 · -11.5%
- By 2050
- 47,514 · -20.2%
- By 2075
- 35,690 · -40.1%
- By 2100
- 24,807 · -58.4%
Race, ethnicity, and origin ACS 2023
- Neighborhood character
- Predominantly White (88%)
- Race & ethnicity
- White 88% Two or more races 6% Black 2% Hispanic / Latino 2% Asian 2%
- Common ancestry
- Lithuanian 7% Romanian 4% Iranian 1%
- Foreign-born
- 3% · Canada
- Languages at home
- 98% English-only · Spanish 1%
Political lean MEDSL · Washington
- 2024 margin
- Strong R (+21.2) · D 39.4% · R 60.6%
- 2008→2024 swing
- -22.0pp toward R · 2008: 0.8pp · 2024: -21.2pp
- All cycles
- 2024: R+21.2 2020: R+15.6 2016: R+20.2 2012: D+1.6 2008: D+0.8
Not yet ingested
- Civics
- —
Market trends
- HPI YoY
- ▼ -1.30%
- Current HPI
- 326.4556
- Rent YoY
- —
- Metro
- —
- State GDP YoY
- ▲ 2.60%
- F500 in state
- 92
Industry mix (Fortune 500 HQ in NY)
| Industry | F500 HQs | Revenue |
|---|---|---|
| Financial Services | 10 | $950B |
|
||
| Consumer Goods | 9 | $162B |
|
||
| Insurance | 4 | $225B |
|
||
| Telecommunications | 2 | $144B |
|
||
| Pharmaceuticals | 2 | $112B |
|
||
| Media / Entertainment | 2 | $69B |
|
||
Price history
+33.2% since first listed6 events — show timeline
- 2026-06-01 Listed $99,900 Global MLS
- 2019-03-01 Listing Removed — Global MLS
- 2008-05-16 Listed $96,500 Global MLS
- 2005-12-29 Sold (Public Records) $79,500 Public Records
- 2005-12-14 Sold (MLS) $79,500 Global MLS
- 2004-04-25 Listed $75,000 Global MLS
Property tax history
+2.5%/yrLatest (2025): $2,873 · +4.4% YoY. Source: county tax records.
Cash-flow waterfall
monthlySold comps — $/sqft
last 12 mo · ≤1 miLoading sold comps…