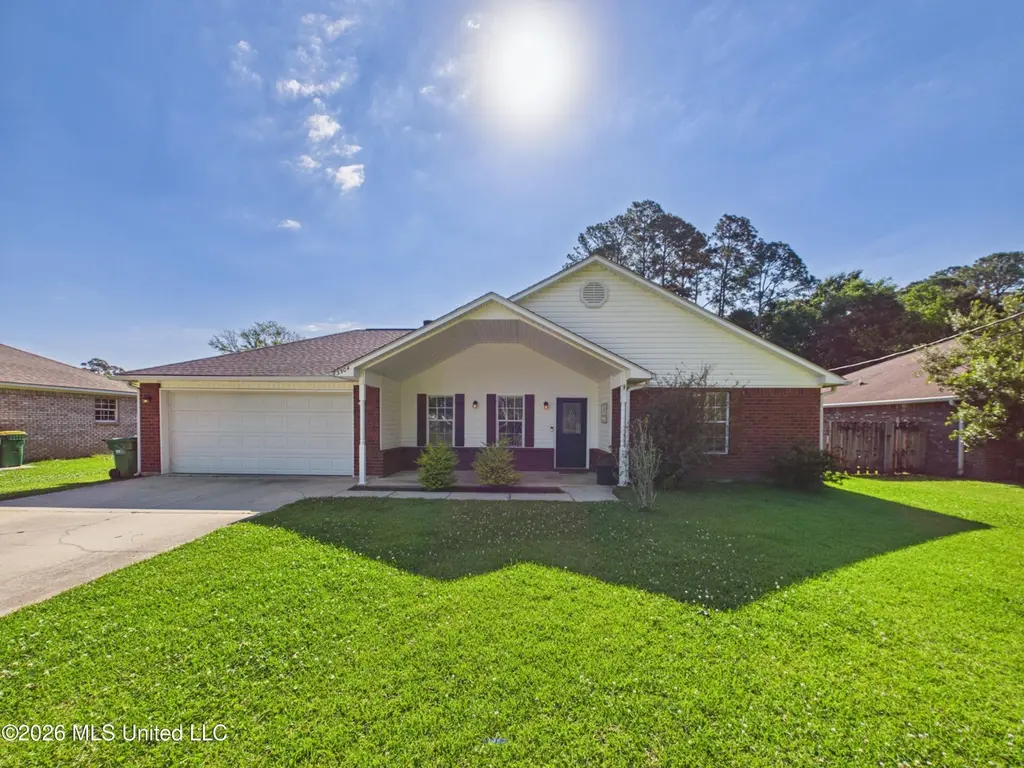
3504 N 7th St · Gulf Park Estates, MS
Flood risk 4/10 · Minor
- FEMA flood zone
- X (shaded)
- Chance of flooding over 30 yrs
- 0.13%
- Est. flood insurance / yr
- $507 – $1,088
Fire risk 5/10 · Moderate
- Est. fire insurance / yr
- $1,241 – $2,305
Heat risk 10/10 · Severe
- Hot days now (above 106°F)
- 7 days/yr
- Hot days in 30 yrs
- 24 days/yr
Wind risk 9/10 · Severe
- Chance of severe wind over 30 yrs
- 99.0%
Air-quality risk 2/10 · Minimal
- Unhealthy air days now
- 1 days/yr
- Unhealthy air days in 30 yrs
- 2 days/yr
Risk factors via First Street. Map © Google.
Why this score? — see what drove the C- grade
The composite is a weighted blend of 9 inputs, each scored 0–100. Each bar is that input's sub-score; the figure is the points it added to the 100-point composite (weight × sub-score).
- Cash flow +19.0/30.0
- ARV discount +10.7/15.0
- DSCR +6.0/10.0
- Schools +5.3/10.0
- 1% rule +4.0/10.0
- Livability +3.5/5.0
- Rent growth +2.8/5.0
- Condition / age +2.5/5.0
- Appreciation +0.0/10.0
$269,900
🖨 Deal sheet (PDF) 📄 Offer letter ✓ Due diligence
Listing remarks
Nestled in the highly desirable Gulf Park Estates neighborhood. This beautiful 4-bedroom, 2-bath home offers the perfect blend of comfort and style. Step inside to a spacious living room featuring a cozy fireplace, creating a warm and inviting atmosphere. The kitchen is designed to impress with quartz countertops, stainless steel appliances, and a convenient breakfast bar perfect for casual dining or gathering with guests. Outside, enjoy your private backyard retreat complete with a back patio and firepit—ideal for entertaining or unwinding on peaceful evenings. Conveniently located to Highway 90, Top A-rated schools, Chevron, Ingalls, shopping, and entertaining! Don't miss your oppor
Key facts
- Quartz countertops
- Cozy fireplace
- Breakfast bar
Tags
Property features AI
Exterior
- Parking: Detached or attached 2-car garage with driveway; Garage faces front with direct access and concrete drive
- Utilities: Public water; Public sewer; Electricity connected; Cable connected
- Home design: Single-family house; One level; Move-in ready; Vinyl and brick exterior; Slab foundation; Architectural shingle roof
- Construction: Built (year source: public records)
- Exterior features: Front porch; Patio (slab); Fire pit; Private yard; Rain gutters; Fenced yard with wood privacy fencing; Landscaped yard with few trees; Rectangular lot
Interior
- Kitchen: Dishwasher; Free-standing electric oven and range
- Flooring: Luxury vinyl
- Bathrooms: 2 full bathrooms
- Heating & cooling: Central heating (electric) and fireplace heating; Central air (electric); Ceiling fans
- Interior features: Ceiling fans; Pantry; Tray ceilings; Walk-in closets; Double vanity; Breakfast bar; Double-pane windows; Wood-burning fireplace in the living room
- Laundry & utility: Laundry room with washer and electric dryer hookups; Water heater
Neighborhood map
What this means for you Summary
Snapshot
- This is a 4-bed/2.0-bath single-family listed at $270k.
Deal economics
- At list price, monthly cash flow is $283 ($3k/yr) — positive.
- The deal already cash-flows at list — no discount required.
- To meet the 1% rule (rent ≥ 1% of price), the offer needs to be $243k (10.0% below list).
- Recommended offer: $243k (10.0% below list) — sets the bar for 1% rule.
- Cap rate 7.6% vs local median 5.2% in Gulf Park Estates — top-decile yield for the area; either an underpriced asset or a hidden risk that comps aren't pricing in. Stress-test before assuming the spread holds.
Location & tenants
- Location reads 70/100 on livability (#43 in MS) — a middle-class / working-renter tenant base. Strengths: crime A+, cost of living A+, housing A+; Watch: schools D+, health & safety D+, amenities F.
- Ocean Springs School District (suburban): math 64% / reading 59% proficiency, ranked #1 of 130 in MS (top 1%) — acceptable for families but not a draw, mixed tenant base, ~2y average lease.
- Market conditions: Rents rising (+1.3%/yr); 714 active listings in the ZIP; 2 comparable units currently listed for rent nearby; solid renter incomes; 516 units permitted in Jackson County in 2024 (6 in 5+ unit buildings).
- This rent runs 37% of the median local income ($79k/yr) — at the standard rent-burdened threshold; future hikes will face affordability resistance.
Forward outlook
- Local home prices are declining (-3.0%/yr); year-one equity from $2k of loan paydown is wiped out by about $8k of value loss. Plan a longer hold.
Negotiation context
- It's been on market 30 days — a 2% lower offer ($266k) is reasonable based on typical stale-listing flexibility.
Risks & watch-outs
- Climate carrying-cost: severe wind risk, 99% chance of damaging wind over 30y; moderate wildfire risk; extreme-heat days projected 7→24/yr by 2055 (HVAC capex compounding) — expect insurance premiums to compound above CPI over the hold.
Questions for the listing agent
- Is there a deadline driving the sale (1031 exchange, divorce, estate, relocation)? That informs how much negotiation room exists.
- Schools are D-rated, which usually means shorter tenancies and higher turnover. Who's the typical renter profile here, and what's been the actual vacancy rate?
- What's the average days-on-market for RENTAL listings here right now (not sales)? A rising rental-DOM trend means longer vacancies and softer asking-rent achievability than the comps imply.
- What's the recent tenant-quality profile in this submarket — average credit score on applications, eviction rate, late-payment / NSF rate, and stable-employment percentage? A property-management company in the area should have these aggregated.
- How much new for-sale + rental construction is in the pipeline within 1–3 miles? Heavy new supply typically softens prices + rents 12–24 months out; constrained supply supports both.
Investment metrics
- 1% rule
- 0.90% ✗
- Cap rate
- 7.55%
- Cash-on-cash
- 4.49%
- DSCR
- 1.20
- GRM
- 9.3
CMA / ARV
- ARV (on-the-fly)
- $290,850
- Comps found
- 12
Show comp detail 12 sales within ~0.75 mi
| Address | Dist | Beds/Ba | Sqft | Sold | Price | $/sf | Match |
|---|---|---|---|---|---|---|---|
| 3425 Beachview Dr | 0.11mi | 4/2.0 | 1,993 (+3%) | 5mo | $279,900 | $140 | 86 |
| 3524 N 8th St | 0.10mi | 4/2.0 | 1,835 (-5%) | 2mo | $275,000 | $150 | 85 |
| 3300 N 9th St | 0.18mi | 3/2.0 (-1) | 1,858 (-4%) | 2mo | $315,000 | $170 | 78 |
| 3301 N 7th St | 0.22mi | 4/2.0 | 1,829 (-6%) | 7mo | $275,000 | $150 | 75 |
| 124 Spanish Cove Dr | 0.42mi | 3/2.0 (-1) | 1,937 (-0%) | 6mo | $400,000 | $207 | 70 |
| 9321 Coconut Dr | 0.46mi | 3/3.0 (-1) | 1,836 (-5%) | 1mo | $270,000 | $147 | 60 |
| 3301 Pineridge Dr | 0.56mi | 3/2.0 (-1) | 2,048 (+6%) | 0mo | $349,000 | $170 | 59 |
| 3717 Tangerine St | 0.39mi | 3/2.0 (-1) | 1,752 (-10%) | 2mo | $250,000 | $143 | 59 |
| 9336 Ridgeview Dr | 0.45mi | 3/2.0 (-1) | 1,785 (-8%) | 7mo | $380,000 | $213 | 55 |
| 2804 Beachview Dr | 0.71mi | 4/2.5 | 1,798 (-7%) | 4mo | $235,000 | $131 | 50 |
| 2808 Hickory Ln | 0.69mi | 3/2.5 (-1) | 2,073 (+7%) | 1mo | $269,000 | $130 | 49 |
| 9504 Live Oak Ave | 0.74mi | 3/2.0 (-1) | 1,761 (-9%) | 5mo | $224,900 | $128 | 41 |
Match score weights: distance 35% · size 25% · config 20% · recency 20%. Top-matched comps best support the ARV.
Projected returns pro-forma
-3.0% appreciation · 1.31% rent growth · sell at horizon
- IRR
- -11.1%
- Equity multiple
- 0.60×
- Total profit
- $-29,892
- Equity at exit
- $40,243
- IRR
- -4.2%
- Equity multiple
- 0.74×
- Total profit
- $-19,376
- Equity at exit
- $23,336
Cash invested: $75,572 (down + closing). Projections, not guarantees.
Landlord ↔ Tenant lean methodology
- Overall (STATE)
- 90 Strongly Landlord-Friendly
- State Mississippi
- 90 Strongly Landlord-Friendly · R+11
- County
- — inherits STATE
- City
- — inherits STATE
ZIP-level market 39564
- Home prices YoY
- -26.8%
- Rents YoY
- 1.3%
- Active inventory
- 714
- Price-to-rent
- 9.3×
Monthly cashflow live
- Estimated rent
- $2,430 medium interval (Pro) →
- Mortgage (P&I)
- −$1,415
- Tax from tax record
- −$109 /mo · $1,306/yr
- Insurance
- −$112
- HOA
- −$0
- Vacancy / Maint / Mgmt
- −$510
- Net cashflow
- $283
Break-even live
Sensitivity live
| Price | -10% $436 | -5% $359 | +0% $283 | +5% $206 | +10% $130 |
|---|---|---|---|---|---|
| Rent | -10% $91 | -5% $187 | +0% $283 | +5% $379 | +10% $475 |
| Rate | -1.0pp $419 | -0.5pp $351 | base $283 | +0.5pp $213 | +1.0pp $142 |
UW: 25.0% down · 7.5% · 30yr · 1.5% tax · 5.0% vac · 8.0% maint · 8.0% mgmt
Financing live
Cash to close
- Down payment
- $67,475
- Closing costs
- $8,097
- Reserves months
- —
- Total cash needed
- —
Loan-product check · same deal, 3 products live
Conventional
25% down · 7.5% · 30yr
- Down + closing
- —
- Monthly P&I
- —
- Monthly cashflow
- —
- DSCR
- —
- Eligible?
- —
Personal DTI + credit; lowest rate.
DSCR
20% down · 8.5% · 30yr
- Down + closing
- —
- Monthly P&I
- —
- Monthly cashflow
- —
- DSCR
- —
- Eligible?
- —
No personal income docs; deal must DSCR.
Hard money
10% down · 12.0% · 12mo
- Down + closing
- —
- Monthly P&I
- —
- Monthly cashflow
- —
- DSCR
- —
- Eligible?
- —
Short-term bridge; refi at stabilization.
Rent comps 2 comps
| Address | Beds | Baths | Sqft | Rent | $/sqft | DOM | Units | Dist |
|---|---|---|---|---|---|---|---|---|
| 3305 N 8th St Ocean Springs, MS | 4.0 | 2.0 | 1802 | $2,250 | $1.25 | 21d | 1 | 0.19mi |
| 106 Booth Cir Ocean Springs, MS | 4.0 | 2.0 | 2100 | $2,500 | $1.19 | 14d | 1 | 0.90mi |
Listing history 15 events
-
2026-06-18days on market $269,900 Active 30 DOM
-
2026-06-17days on market $269,900 Active 29 DOM
-
2026-06-16days on market $269,900 Active 28 DOM
-
2026-06-15days on market $269,900 Active 27 DOM
-
2026-06-14status $269,900 Active 25 DOM
-
2026-06-13status $269,900 Pending 25 DOM
-
2026-06-10days on market $269,900 Active 25 DOM
-
2026-06-09days on market $269,900 Active 24 DOM
-
2026-06-08days on market $269,900 Active 23 DOM
-
2026-06-07days on market $269,900 Active 22 DOM
-
2026-06-02days on market $269,900 Active 17 DOM
-
2026-06-01days on market $269,900 Active 16 DOM
-
2026-05-31days on market $269,900 Active 15 DOM
-
2026-05-30days on market $269,900 Active 14 DOM
-
2026-05-16$269,900 Active
ⓘ Source: listings_history table (triggers on properties + properties_extension) + one-shot
backfill from property_details.listing_events for pre-trigger history.
Tax reassessment forecast MS · Resets to sale price
- Current annual tax
- $1,306 · $109/mo
- Projected year-2 tax
- $2,132 · $178/mo
- Expected delta
- +$826/yr (+$69/mo · 63.2%)
ⓘ Screening estimate from a state-policy table — verify with the county assessor before closing.
Climate risk First Street
- Flood 4/10 Moderate FEMA zone X (shaded) · 13% chance over 30 yrs
- Wildfire 5/10 Major
- Heat 10/10 Extreme 7 d/yr ≥106°F today · 24 d/yr by 30 yrs out
- Wind 9/10 Extreme 99% chance of damaging wind over 30 yrs
- Air quality 2/10 Low 1 unhealthy d/yr today · 2 by 30 yrs out
Nearby sold comps map
Loading sold comps map…
Walkable amenities ~0.75 mi
Loading nearby amenities…
Taxation est. · year 1
- Rental income
- $29,157
- − Mortgage interest
- −$15,119
- − Property taxes
- −$1,306
- − Insurance
- −$1,350
- − Repairs & maintenance
- −$2,333
- − Management
- −$2,333
- − Depreciation
- −$7,852
- Taxable loss
- −$1,134
- Est. tax savings @ 24.0%
- +$272
- After-tax cash flow
- $3,666/yr
For passive investors: Depreciation is non-cash, so a rental often shows a tax loss while cash-flowing — sheltering income. Rental losses are passive: they offset passive income freely, and up to $25,000/yr can offset ordinary (W-2) income if you actively participate and your MAGI is under $100k (phasing out to $0 by $150k); unused losses carry forward. On sale, claimed depreciation is recaptured at up to 25%, and gains may owe capital-gains tax (a 1031 exchange can defer both). Figures are a year-1 estimate at your 24.0% rate — not tax advice; consult a CPA.
Schools (NCES district)
- District
- Ocean Springs School District
- NCES district ID
- 2803360
- Math proficiency
- 64% ▼ -3.00%
- Reading proficiency
- 59% ▲ 1.00%
- Median HH income
- $60,485
- Composite
- 53.35/100
- National rank
- #1477
- State rank
- #1 of 130 in MS
Livability — Gulf Park Estates
- Score
- 70/100
- State rank
- #43
- US rank
- #7955
Category grades
Schools grade is shown separately in the Schools card above.
Census & demographics
- Census place
- Gulf Park Estates, MS
- County
- Jackson County · 82,196 people
- Metro
- Gulfport-Biloxi, MS
- Population (ZIP)
- 43,240
- Household income
- $78,596
- Rent vs Own
- Severe rent burden
- 734.0
Population outlook (Jackson County) Hauer SSP2
- Today (2025)
- 146,926 people
- By 2030
- 148,442 · +1.0%
- By 2040
- 149,631 · +1.8%
- By 2050
- 148,723 · +1.2%
- By 2075
- 147,845 · +0.6%
- By 2100
- 144,510 · -1.6%
Race, ethnicity, and origin ACS 2023
- Neighborhood character
- Predominantly White (74%)
- Race & ethnicity
- White 74% Black 10% Hispanic / Latino 8% Two or more races 7% Asian 4%
- Hispanic origin (detail)
- Mexican 3% Puerto Rican 2%
- Common ancestry
- Lithuanian 5% Slovak 4% Romanian 2%
- Foreign-born
- 5% · Canada, South Korea, Vietnam
- Languages at home
- 93% English-only · Spanish 3% Vietnamese 2% Tagalog/Filipino 1%
Political lean MEDSL · Jackson
- 2024 margin
- Solid R (+39.9) · D 29.5% · R 69.4% · Other 1.1%
- 2008→2024 swing
- -6.4pp toward R · 2008: -33.5pp · 2024: -39.9pp
- All cycles
- 2024: R+39.9 2020: R+34.6 2016: R+39.9 2012: R+36.1 2008: R+33.5
Not yet ingested
- Civics
- —
Market trends
- HPI YoY
- ▼ -74.77%
- Current HPI
- 204.2244
- Rent YoY
- ▲ 1.31%
- Metro
- Gulfport-Biloxi, MS
- State GDP YoY
- —
- F500 in state
- 0
Price history
1 event — show timeline
- 2026-05-16 Listed $269,900 MLSU
Property tax history
+2.0%/yrLatest (2025): $1,306 · +4.2% YoY. Source: county tax records.
Cash-flow waterfall
monthlySold comps — $/sqft
last 12 mo · ≤1 miLoading sold comps…