300 S Columbus St #108 · West Liberty, IA
Flood risk No data
- FEMA flood zone
- —
- Chance of flooding over 30 yrs
- %
- Est. flood insurance / yr
- —
Fire risk No data
- Est. fire insurance / yr
- —
Heat risk No data
- Hot days now (above °F)
- days/yr
- Hot days in 30 yrs
- days/yr
Wind risk No data
- Chance of severe wind over 30 yrs
- %
Air-quality risk No data
- Unhealthy air days now
- days/yr
- Unhealthy air days in 30 yrs
- days/yr
Risk factors via First Street. Map © Google.
Why this score? — see what drove the B grade
The composite is a weighted blend of 9 inputs, each scored 0–100. Each bar is that input's sub-score; the figure is the points it added to the 100-point composite (weight × sub-score).
- Cash flow +30.0/30.0
- 1% rule +10.0/10.0
- DSCR +10.0/10.0
- ARV discount +7.5/15.0
- Schools +4.3/10.0
- Livability +3.8/5.0
- Rent growth +2.5/5.0
- Condition / age +2.5/5.0
- Appreciation +0.0/10.0
$70,000
🖨 Deal sheet 📄 Offer letter ✓ Due diligence
Listing remarks
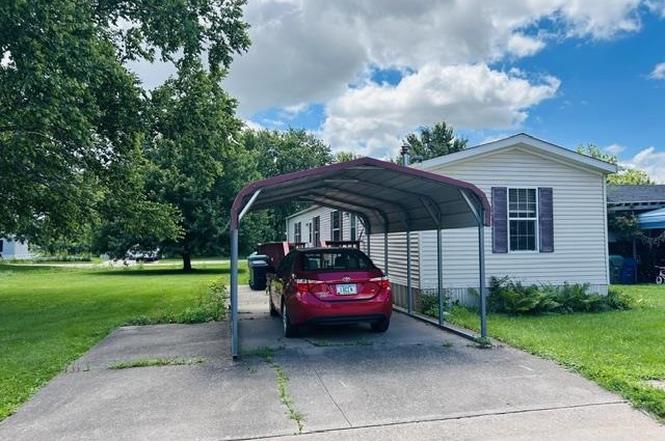
2007 Fairmont Bayview for sale in Clines Mobile Village in West Liberty. This is a very well maintained 80' x 16' home at the end of a dead end street. Lot rent is $345 per month, which includes lawn mowing and plowing the street to the home. It has a spacious primary suite on one end with its own bathroom and big walk in closet, with the laundry room right across the hall. The 2nd bedroom is on the other side, with another bathroom in the hallway, then the kitchen area and a big living room in between. The Kitchen has a big island with lots of cupboard space, a new kitchen faucet and an Amana range. New water heater in 2025. The washer and dryer stay with the home, along with the 12' x 21'
Key facts
- Big island
- New water heater
- Big walk in closet
Tags
Neighborhood map
What this means for you Summary
Snapshot
- This is a 2-bed/2.0-bath manufactured listed at $70k.
Deal economics
- At list price, monthly cash flow is $353 ($4k/yr) — positive.
- The deal already cash-flows at list — no discount required.
- Meets the 1% rule at list price ($1k rent vs $70k).
Location & tenants
- Location reads 76/100 on livability (#200 in IA, #3,661 nationally) — a middle-class / working-renter tenant base. Strengths: cost of living A+, housing A+, health & safety A+; Watch: amenities F, commute F.
- West Liberty Community School District (town): math 46% / reading 54% proficiency, ranked #279 of 289 in IA (top 96%) — acceptable for families but not a draw, mixed tenant base, ~2y average lease.
- Market conditions: 26 active listings in the ZIP; 65 units permitted in Muscatine County in 2024 (45 in 5+ unit buildings).
Forward outlook
- Local home prices are declining (-3.0%/yr); year-one equity from $484 of loan paydown is wiped out by about $2k of value loss. Plan a longer hold.
- Muscatine County population projected at +8% by 2050 — modest demand growth; plan on rents tracking national, not racing it.
- At projected returns (-3.0% appreciation + 3.0% rent growth), your $20k cash investment doubles in ~6 years — after that, you're playing with house money.
Negotiation context
- Only 1 days on market — expect competitive offers; lowballing is unlikely to land.
Questions for the listing agent
- Is there a deadline driving the sale (1031 exchange, divorce, estate, relocation)? That informs how much negotiation room exists.
- What's the average days-on-market for RENTAL listings here right now (not sales)? A rising rental-DOM trend means longer vacancies and softer asking-rent achievability than the comps imply.
- What's the recent tenant-quality profile in this submarket — average credit score on applications, eviction rate, late-payment / NSF rate, and stable-employment percentage? A property-management company in the area should have these aggregated.
- How much new for-sale + rental construction is in the pipeline within 1–3 miles? Heavy new supply typically softens prices + rents 12–24 months out; constrained supply supports both.
Investment metrics
- 1% rule
- 1.51% ✓
- Cap rate
- 12.34%
- Cash-on-cash
- 21.58%
- DSCR
- 1.96
- GRM
- 5.5
CMA / ARV
No comps found within radius.
Projected returns pro-forma
-3.0% appreciation · 3.0% rent growth · sell at horizon
- IRR
- 14.2%
- Equity multiple
- 1.57×
- Total profit
- $11,125
- Equity at exit
- $10,437
- IRR
- 23.0%
- Equity multiple
- 2.97×
- Total profit
- $38,663
- Equity at exit
- $6,052
Cash invested: $19,600 (down + closing). Projections, not guarantees.
Landlord ↔ Tenant lean methodology
- Overall (STATE)
- 83 Strongly Landlord-Friendly
- State Iowa
- 83 Strongly Landlord-Friendly · R+6
- County
- — inherits STATE
- City
- — inherits STATE
ZIP-level market 52776
- Home prices YoY
- -20.5%
- Active inventory
- 26
- Price-to-rent
- 5.5×
Monthly cashflow live
- Estimated rent
- $1,059 medium interval (Pro) →
- Mortgage (P&I)
- −$367
- Tax est. 1.5%
- −$88 /mo · $1,050/yr
- Insurance
- −$29
- HOA
- −$0
- Vacancy / Maint / Mgmt
- −$222
- Net cashflow
- $353
Break-even live
UW: 25.0% down · 7.5% · 30yr · 1.5% tax · 5.0% vac · 8.0% maint · 8.0% mgmt
Financing live
Cash to close
- Down payment
- $17,500
- Closing costs
- $2,100
- Reserves months
- —
- Total cash needed
- —
Loan-product check · same deal, 3 products live
Conventional
25% down · 7.5% · 30yr
- Down + closing
- —
- Monthly P&I
- —
- Monthly cashflow
- —
- DSCR
- —
- Eligible?
- —
Personal DTI + credit; lowest rate.
DSCR
20% down · 8.5% · 30yr
- Down + closing
- —
- Monthly P&I
- —
- Monthly cashflow
- —
- DSCR
- —
- Eligible?
- —
No personal income docs; deal must DSCR.
Hard money
10% down · 12.0% · 12mo
- Down + closing
- —
- Monthly P&I
- —
- Monthly cashflow
- —
- DSCR
- —
- Eligible?
- —
Short-term bridge; refi at stabilization.
Listing history 2 events
-
2026-06-19remarks 699-char remark
-
2026-06-19$70,000 Active 1 DOM
ⓘ Source: listings_history table (triggers on properties + properties_extension) + one-shot
backfill from property_details.listing_events for pre-trigger history.
Nearby sold comps map
Loading sold comps map…
Walkable amenities ~0.75 mi
Loading nearby amenities…
Taxation est. · year 1
- Rental income
- $12,703
- − Mortgage interest
- −$3,921
- − Property taxes
- −$1,050
- − Insurance
- −$350
- − Repairs & maintenance
- −$1,016
- − Management
- −$1,016
- − Depreciation
- −$2,036
- Taxable income
- $3,313
- Est. tax owed @ 24.0%
- −$795
- After-tax cash flow
- $3,435/yr
For passive investors: Depreciation is non-cash, so a rental often shows a tax loss while cash-flowing — sheltering income. Rental losses are passive: they offset passive income freely, and up to $25,000/yr can offset ordinary (W-2) income if you actively participate and your MAGI is under $100k (phasing out to $0 by $150k); unused losses carry forward. On sale, claimed depreciation is recaptured at up to 25%, and gains may owe capital-gains tax (a 1031 exchange can defer both). Figures are a year-1 estimate at your 24.0% rate — not tax advice; consult a CPA.
Schools (NCES district)
- District
- West Liberty Community School District
- NCES district ID
- 1930990
- Math proficiency
- 46% ▼ -12.00%
- Reading proficiency
- 54% ▼ -3.00%
- Median HH income
- $53,909
- Composite
- 43.13/100
- National rank
- #3080
- State rank
- #279 of 289 in IA
Livability — West Liberty
- Score
- 76/100
- State rank
- #200
- US rank
- #3661
Category grades
Schools grade is shown separately in the Schools card above.
Census & demographics
- Census place
- West Liberty, IA
- Population (ZIP)
- 5,023
Population outlook (Muscatine County) Hauer SSP2
- Today (2025)
- 44,820 people
- By 2030
- 45,461 · +1.4%
- By 2040
- 46,765 · +4.3%
- By 2050
- 48,609 · +8.5%
- By 2075
- 56,014 · +25.0%
- By 2100
- 63,513 · +41.7%
Race, ethnicity, and origin ACS 2023
- Neighborhood character
- Majority White (55%)
- Race & ethnicity
- White 55% Hispanic / Latino 43% Two or more races 11% Native American 1%
- Hispanic origin (detail)
- Mexican 22% Cuban 3%
- Common ancestry
- Lithuanian 1% Italian 1% Portuguese 1%
- Foreign-born
- 18% · Canada
- Languages at home
- 61% English-only · Spanish 37% Arabic 1%
Political lean MEDSL · Muscatine
- 2024 margin
- R (+14.9) · D 41.7% · R 56.6% · Other 1.7%
- 2008→2024 swing
- -30.6pp toward R · 2008: 15.7pp · 2024: -14.9pp
- All cycles
- 2024: R+14.9 2020: R+7.0 2016: R+6.6 2012: D+15.5 2008: D+15.7
Not yet ingested
- Civics
- —
Market trends
- HPI YoY
- ▼ -51.54%
- Current HPI
- 199.6026
- Rent YoY
- —
- Metro
- —
- State GDP YoY
- ▲ 2.48%
- F500 in state
- 4
Industry mix (Fortune 500 HQ in IA)
| Industry | F500 HQs | Revenue |
|---|---|---|
| Financial Services | 1 | $16B |
|
||
| Retail / Convenience | 1 | $15B |
|
||
Cash-flow waterfall
monthlySold comps — $/sqft
last 12 mo · ≤1 miLoading sold comps…