26139 Sea Rosemary Ln · Houston, TX
Flood risk No data
- FEMA flood zone
- —
- Chance of flooding over 30 yrs
- —
- Est. flood insurance / yr
- —
Fire risk No data
- Est. fire insurance / yr
- —
Heat risk No data
- Hot days now (above threshold)
- —
- Hot days in 30 yrs
- —
Wind risk No data
- Chance of severe wind over 30 yrs
- —
Air-quality risk No data
- Unhealthy air days now
- —
- Unhealthy air days in 30 yrs
- —
Risk factors via First Street. Map © Google.
Why this score? — see what drove the D grade
The composite is a weighted blend of 9 inputs, each scored 0–100. Each bar is that input's sub-score; the figure is the points it added to the 100-point composite (weight × sub-score).
- Cash flow +10.5/30.0
- ARV discount +7.5/15.0
- Schools +5.7/10.0
- Condition / age +5.0/5.0
- 1% rule +3.9/10.0
- Livability +3.7/5.0
- DSCR +3.0/10.0
- Rent growth +2.3/5.0
- Appreciation +0.0/10.0
$294,990
🖨 Deal sheet 📄 Offer letter ✓ Due diligence
Listing remarks
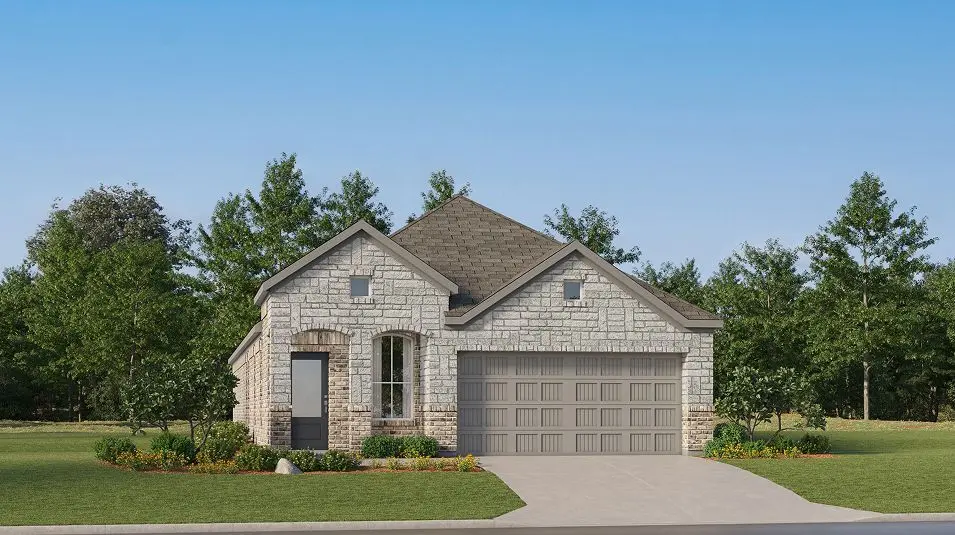
New Construction Lennar Houston Home - The Cornwall Floor Plan - This new four-bedroom home offers convenient single-floor living. An open-concept design blends the kitchen, dining room and family room for optimal multitasking and everyday transitions. A nearby covered patio provides effortless outdoor recreation. Three secondary bedrooms are tucked away to the side of the home, and the luxurious owner’s suite is nestled into a private rear corner, complete with a full bathroom and walk-in closet. The completion date, prices and features may vary and are subject to change. Please verify with Lennar directly. Photos are for illustrative purposes only.
Key facts
- Open-concept design
- Full bathroom
- Walk-in closet
Tags
Property features AI
Finance
- Other: Address: 26139 Sea Rosemary Ln, Park Row, TX 77493; Listing status: Active
- Financial info: List price $331,990
Exterior
- Parking: 2-car garage (2 total parking spaces)
- Home design: Cornwall plan
- Exterior features: Spec home
Interior
- Bedrooms: 4 bedrooms
- Bathrooms: 3 full bathrooms
- Interior features: Open living area (1,868 total living area)
Neighborhood map
What this means for you Summary
Snapshot
- This is a 4-bed/3.0-bath single-family listed at $295k. Condition is rated excellent.
Deal economics
- At list price, monthly cash flow is $-151 ($-2k/yr) — negative.
- To cash-flow at today's rent, offer at most $273k (7.4% below list).
- To meet the 1% rule (rent ≥ 1% of price), the offer needs to be $262k (11.1% below list).
- Recommended offer: $262k (11.1% below list) — sets the bar for 1% rule.
- Cap rate 5.7% vs local median 3.2% in Houston — top-decile yield for the area; either an underpriced asset or a hidden risk that comps aren't pricing in. Stress-test before assuming the spread holds.
Location & tenants
- Location reads 74/100 on livability (#184 in TX, #4,771 nationally) — a middle-class / working-renter tenant base. Strengths: amenities A+, cost of living A+, housing A+; Watch: schools D, crime F.
- Katy ISD (suburban): math 61% / reading 63% proficiency, ranked #29 of 826 in TX (top 4%) — acceptable for families but not a draw, mixed tenant base, ~2y average lease.
- Market conditions: Rents soft (-0.8%/yr); 2696 active listings in the ZIP; 13 comparable units currently listed for rent nearby; rentals lingering (median 44d on market — plan ~5-8 weeks vacancy on turnover, expect pricing pressure); 69% of comp listings sitting > 30 days — soft ceiling on asking rent; high-income renter base; 29,883 units permitted in Harris County in 2024 (8,621 in 5+ unit buildings).
Forward outlook
- Local home prices are declining (-3.0%/yr); year-one equity from $2k of loan paydown is wiped out by about $9k of value loss. Plan a longer hold.
- Harris County population projected at +47% by 2050 — long-run rental-demand tailwind backs the buy-and-hold thesis.
Negotiation context
- It's been on market 20 days — a 2% lower offer ($291k) is reasonable based on typical stale-listing flexibility.
Questions for the listing agent
- What do current leases actually rent for vs. the listed asking? Can we see a recent rent roll and the last 12 months of T-12 income?
- What does the HOA fee cover, when was the last increase, and are there any pending special assessments or reserve-fund shortfalls?
- Is there a deadline driving the sale (1031 exchange, divorce, estate, relocation)? That informs how much negotiation room exists.
- Schools are D-rated, which usually means shorter tenancies and higher turnover. Who's the typical renter profile here, and what's been the actual vacancy rate?
- Crime grade is F in this area — have there been break-ins, vandalism, or insurance claims at this property in the last 3 years? What carrier currently insures it and at what premium?
- The area grade is low — what's the realistic commute time and amenity access for the typical tenant pool here? Any planned neighborhood developments (good or bad) we should know about?
- What's the average days-on-market for RENTAL listings here right now (not sales)? A rising rental-DOM trend means longer vacancies and softer asking-rent achievability than the comps imply.
- What's the recent tenant-quality profile in this submarket — average credit score on applications, eviction rate, late-payment / NSF rate, and stable-employment percentage? A property-management company in the area should have these aggregated.
- How much new for-sale + rental construction is in the pipeline within 1–3 miles? Heavy new supply typically softens prices + rents 12–24 months out; constrained supply supports both.
Investment metrics
- 1% rule
- 0.89% ✗
- Cap rate
- 5.68%
- Cash-on-cash
- -2.19%
- DSCR
- 0.90
- GRM
- 9.4
CMA / ARV
- ARV (on-the-fly)
- $295,144
- Comps found
- 12
Show comp detail 12 sales within ~0.75 mi
| Address | Dist | Beds/Ba | Sqft | Sold | Price | $/sf | Match |
|---|---|---|---|---|---|---|---|
| 6614 Sienna Sunrise Ln | 0.10mi | 4/2.0 | 2,013 (+8%) | 1mo | $309,790 | $154 | 78 |
| 6634 Sienna Sunrise Ln | 0.15mi | 4/2.0 | 2,013 (+8%) | 0mo | $305,990 | $152 | 76 |
| 6666 Iron Clover Dr | 0.14mi | 4/2.0 | 1,655 (-11%) | 0mo | $283,590 | $171 | 70 |
| 6671 Iron Clover Dr | 0.14mi | 3/2.5 (-1) | 1,635 (-12%) | 0mo | $265,000 | $162 | 66 |
| 26906 Rosebay Woods Dr | 0.48mi | 4/2.0 | 1,760 (-6%) | 1mo | $262,990 | $149 | 63 |
| 26527 Ivory Petal Dr | 0.41mi | 4/2.0 | 2,083 (+12%) | 1mo | $309,140 | $148 | 57 |
| 26803 Scarlet Willow Dr | 0.70mi | 4/2.5 | 1,968 (+5%) | 0mo | $275,240 | $140 | 56 |
| 26607 Ivory Petal Dr | 0.44mi | 4/2.0 | 2,083 (+12%) | 1mo | $380,990 | $183 | 56 |
| 6806 Violet Clover Ave | 0.29mi | 3/2.0 (-1) | 1,629 (-13%) | 1mo | $257,240 | $158 | 55 |
| 26707 Scarlet Willow Dr | 0.59mi | 4/2.0 | 1,720 (-8%) | 1mo | $322,990 | $188 | 54 |
| 6738 Violet Clover Ave | 0.30mi | 3/2.0 (-1) | 1,629 (-13%) | 1mo | $272,890 | $168 | 54 |
| 26811 Scarlet Willow Dr | 0.72mi | 4/2.0 | 1,720 (-8%) | 1mo | $270,590 | $157 | 49 |
Match score weights: distance 35% · size 25% · config 20% · recency 20%. Top-matched comps best support the ARV.
Projected returns pro-forma
-3.0% appreciation · 0.0% rent growth · sell at horizon
- IRR
- -23.6%
- Equity multiple
- 0.21×
- Total profit
- $-64,930
- Equity at exit
- $43,984
- IRR
- -31.2%
- Equity multiple
- -0.19×
- Total profit
- $-97,971
- Equity at exit
- $25,505
Cash invested: $82,597 (down + closing). Projections, not guarantees.
Landlord ↔ Tenant lean methodology
- Overall (STATE)
- 87 Strongly Landlord-Friendly
- State Texas
- 87 Strongly Landlord-Friendly · R+5
- County
- — inherits STATE
- City
- — inherits STATE
ZIP-level market 77493
- Rents YoY
- -0.8%
- Active inventory
- 2696
- Price-to-rent
- 9.4×
Monthly cashflow live
- Estimated rent
- $2,621 high interval (Pro) →
- Mortgage (P&I)
- −$1,547
- Tax est. 1.5%
- −$369 /mo · $4,425/yr
- Insurance
- −$123
- HOA
- −$183
- Vacancy / Maint / Mgmt
- −$550
- Net cashflow
- $-151
Break-even live
UW: 25.0% down · 7.5% · 30yr · 1.5% tax · 5.0% vac · 8.0% maint · 8.0% mgmt
Financing live
Cash to close
- Down payment
- $73,748
- Closing costs
- $8,850
- Reserves months
- —
- Total cash needed
- —
Loan-product check · same deal, 3 products live
Conventional
25% down · 7.5% · 30yr
- Down + closing
- —
- Monthly P&I
- —
- Monthly cashflow
- —
- DSCR
- —
- Eligible?
- —
Personal DTI + credit; lowest rate.
DSCR
20% down · 8.5% · 30yr
- Down + closing
- —
- Monthly P&I
- —
- Monthly cashflow
- —
- DSCR
- —
- Eligible?
- —
No personal income docs; deal must DSCR.
Hard money
10% down · 12.0% · 12mo
- Down + closing
- —
- Monthly P&I
- —
- Monthly cashflow
- —
- DSCR
- —
- Eligible?
- —
Short-term bridge; refi at stabilization.
Rent comps 13 comps
| Address | Beds | Baths | Sqft | Rent | $/sqft | DOM | Units | Dist |
|---|---|---|---|---|---|---|---|---|
| 6758 Sunset Velvet Dr Katy, TX | 3.0 | 2.0 | 1580 | $2,350 | $1.49 | 43d | 1 | 0.31mi |
| 26642 Prairie Smoke Ln Katy, TX | 3.0 | 2.0 | 1949 | $2,300 | $1.18 | 43d | 1 | 0.60mi |
| 26811 Prairie Smoke Ln Katy, TX | 4.0 | 2.0 | 1656 | $2,250 | $1.36 | 43d | 1 | 0.75mi |
| 6414 Orchid Beach Dr Katy, TX | 5.0 | 4.0 | 2490 | $3,000 | $1.20 | 12d | 1 | 1.01mi |
| 26802 Cenzontle Dr Katy, TX | 3.0 | 2.0 | 1470 | $1,850 | $1.26 | 43d | 1 | 1.04mi |
| 7410 Hillside Arbor Dr Katy, TX | 4.0 | 2.0 | 2289 | $2,400 | $1.05 | 43d | 1 | 1.11mi |
| 7402 Clover Chase Dr Katy, TX | 4.0 | 3.0 | 1840 | $2,400 | $1.30 | 43d | 1 | 1.14mi |
| 6303 Marigold Blaze Dr Katy, TX | 3.0 | 2.0 | 1474 | $2,250 | $1.53 | 43d | 1 | 1.21mi |
| 6427 Seafoam Lake Dr Katy, TX | 4.0 | 4.0 | 2479 | $3,000 | $1.21 | 1d | 1 | 1.32mi |
| 27507 Hudson Sands Ln Katy, TX | 4.0 | 3.0 | 2294 | $3,000 | $1.31 | 16d | 1 | 1.35mi |
| 5819 Bright Keel Dr Katy, TX | 4.0 | 3.0 | 2598 | $2,400 | $0.92 | 43d | 1 | 1.42mi |
| 27327 Blue Pool Dr Katy, TX | 4.0 | 3.0 | 2100 | $2,600 | $1.24 | 43d | 1 | 1.42mi |
| 5631 Pearl Vista Dr Katy, TX | 4.0 | 3.0 | 2039 | $3,000 | $1.47 | 20d | 1 | 1.47mi |
HOA detail
- Monthly dues
- $183 · $2,196/yr
Listing history 12 events
-
2026-06-15remarks 658-char remark
-
2026-06-15status $294,990 Pending 20 DOM
-
2026-06-15days on market $294,990 Active 20 DOM
-
2026-06-13days on market $294,990 Active 18 DOM
-
2026-06-09days on market $294,990 Active 14 DOM
-
2026-06-08days on market $294,990 Active 13 DOM
-
2026-06-07days on market $294,990 Active 12 DOM
-
2026-06-04days on market $294,990 Active 9 DOM
-
2026-06-03days on market $294,990 Active 8 DOM
-
2026-06-02days on market $294,990 Active 7 DOM
-
2026-06-01days on market $294,990 Active 6 DOM
-
2026-05-31days on market $294,990 Active 5 DOM
ⓘ Source: listings_history table (triggers on properties + properties_extension) + one-shot
backfill from property_details.listing_events for pre-trigger history.
Nearby sold comps map
Loading sold comps map…
Walkable amenities ~0.75 mi
Loading nearby amenities…
Taxation est. · year 1
- Rental income
- $31,457
- − Mortgage interest
- −$16,524
- − Property taxes
- −$4,425
- − Insurance
- −$1,475
- − Repairs & maintenance
- −$2,517
- − Management
- −$2,517
- − HOA
- −$2,196
- − Depreciation
- −$8,582
- Taxable loss
- −$6,778
- Est. tax savings @ 24.0%
- +$1,627
- After-tax cash flow
- $-182/yr
For passive investors: Depreciation is non-cash, so a rental often shows a tax loss while cash-flowing — sheltering income. Rental losses are passive: they offset passive income freely, and up to $25,000/yr can offset ordinary (W-2) income if you actively participate and your MAGI is under $100k (phasing out to $0 by $150k); unused losses carry forward. On sale, claimed depreciation is recaptured at up to 25%, and gains may owe capital-gains tax (a 1031 exchange can defer both). Figures are a year-1 estimate at your 24.0% rate — not tax advice; consult a CPA.
Condition & rehab AI · 23 photos
This home is in excellent condition with modern finishes and a well-maintained exterior. It is move-in ready and would benefit from minor updates to the interior walls and flooring to further enhance its resale and rental value.
Value-add opportunities
- Resale Painting the interior walls — Fresh paint can enhance the home's curb appeal and make it more inviting
- Resale Updating the flooring in the bathrooms — Modern flooring can improve the overall aesthetic and functionality of the bathrooms
- Both Adding smart home features — Smart home features can increase convenience and appeal to potential buyers/renters
Renovation cost estimate screening
Value-add ROI direction
- Resale Painting the interior walls — Fresh paint can enhance the home's curb appeal and make it more inviting ↑
- Resale Updating the flooring in the bathrooms — Modern flooring can improve the overall aesthetic and functionality of the bathrooms ↑
- Both Adding smart home features — Smart home features can increase convenience and appeal to potential buyers/renters ↑
ⓘ Cost ranges are severity-bucket heuristics (US national rule-of-thumb). Get contractor quotes + a written scope before underwriting a rehab budget.
Schools (NCES district)
- District
- Katy ISD
- NCES district ID
- 4825170
- Math proficiency
- 61% ▼ -7.00%
- Reading proficiency
- 63% ▼ -3.00%
- Median HH income
- $90,312
- Composite
- 56.59/100
- National rank
- #1146
- State rank
- #29 of 826 in TX
Livability — Houston
- Score
- 74/100
- State rank
- #184
- US rank
- #4771
Category grades
Schools grade is shown separately in the Schools card above.
Census & demographics
- County
- Harris County · 4,702,590 people
- City population
- 3,226,434
- Metro
- Houston-The Woodlands-Sugar Land, TX
- Population (ZIP)
- 71,484
- Household income
- $118,464
- Rent vs Own
- Severe rent burden
- 913.0
Population outlook (Harris County) Hauer SSP2
- Today (2025)
- 5,571,493 people
- By 2030
- 6,089,821 · +9.3%
- By 2040
- 7,142,806 · +28.2%
- By 2050
- 8,185,864 · +46.9%
- By 2075
- 10,574,329 · +89.8%
- By 2100
- 12,109,958 · +117.4%
Race, ethnicity, and origin ACS 2023
- Neighborhood character
- Highly diverse neighborhood (Simpson 0.73)
- Race & ethnicity
- White 36% Hispanic / Latino 33% Two or more races 16% Black 15% Asian 12%
- Hispanic origin (detail)
- Mexican 20%
- Common ancestry
- Lithuanian 2% Slovak 1% Italian 1%
- Foreign-born
- 21% · Canada, Vietnam, Jamaica
- Languages at home
- 64% English-only · Spanish 22% Vietnamese 5% French/Haitian/Cajun 4%
Political lean MEDSL · Harris
- 2024 margin
- Lean D (+5.5) · D 52.0% · R 46.4% · Other 1.6%
- 2008→2024 swing
- +3.9pp toward D · 2008: 1.6pp · 2024: 5.5pp
- All cycles
- 2024: D+5.5 2020: D+13.3 2016: D+12.4 2012: D+0.1 2008: D+1.6
Not yet ingested
- Civics
- —
Market trends
- HPI YoY
- ▼ -140.65%
- Current HPI
- 233.1683
- Rent YoY
- ▼ -0.80%
- Metro
- Houston-The Woodlands-Sugar Land, TX
- State GDP YoY
- ▲ 3.95%
- F500 in state
- 110
Industry mix (Fortune 500 HQ in TX)
| Industry | F500 HQs | Revenue |
|---|---|---|
| Energy | 16 | $1,198B |
|
||
| Technology | 5 | $198B |
|
||
| Engineering / Construction | 4 | $72B |
|
||
| Energy Services | 3 | $60B |
|
||
| Utilities | 3 | $41B |
|
||
| Healthcare | 2 | $330B |
|
||
Cash-flow waterfall
monthlySold comps — $/sqft
last 12 mo · ≤1 miLoading sold comps…